. 2022 Mar 1;12(3):730-751.
doi: 10.1158/2159-8290.CD-21-0385.

EP300 Selectively Controls the Enhancer Landscape of MYCN-Amplified Neuroblastoma

Affiliations

EP300 Selectively Controls the Enhancer Landscape of MYCN-Amplified Neuroblastoma

Adam D Durbin et al. Cancer Discov. .

Abstract

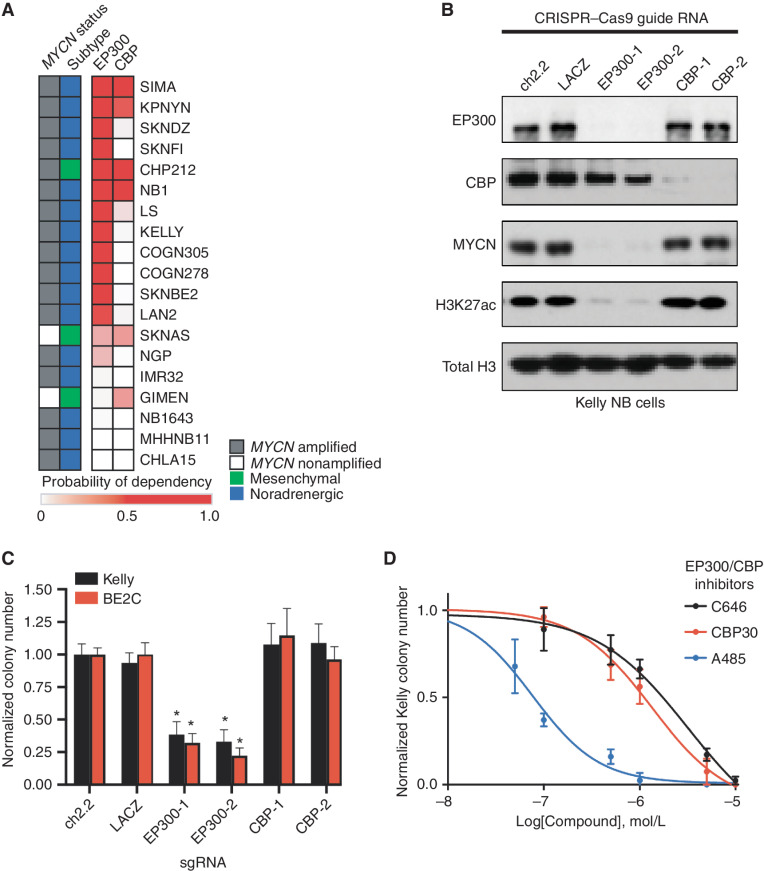
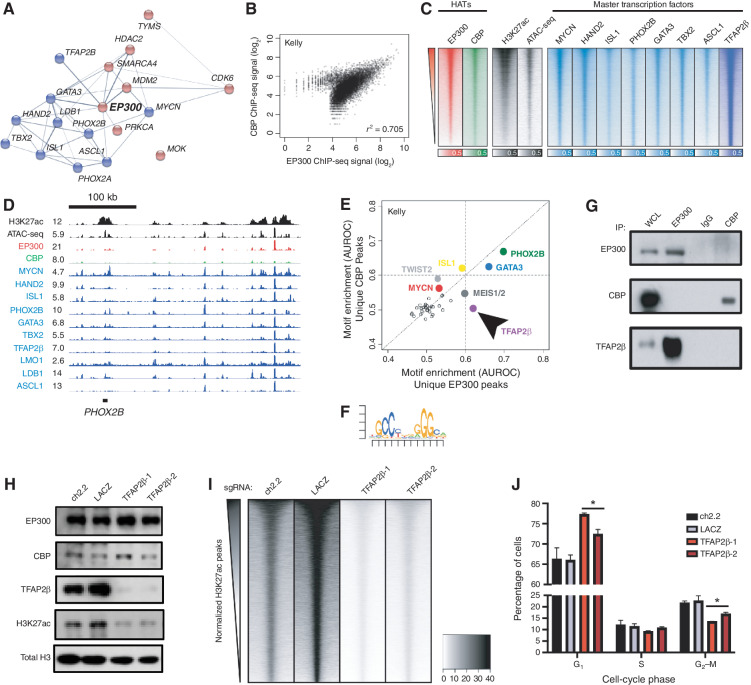
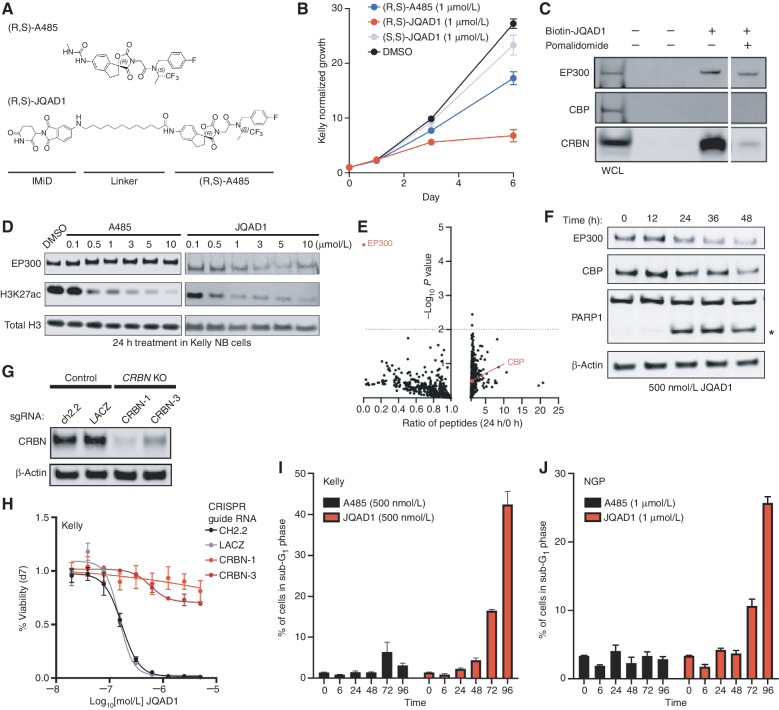
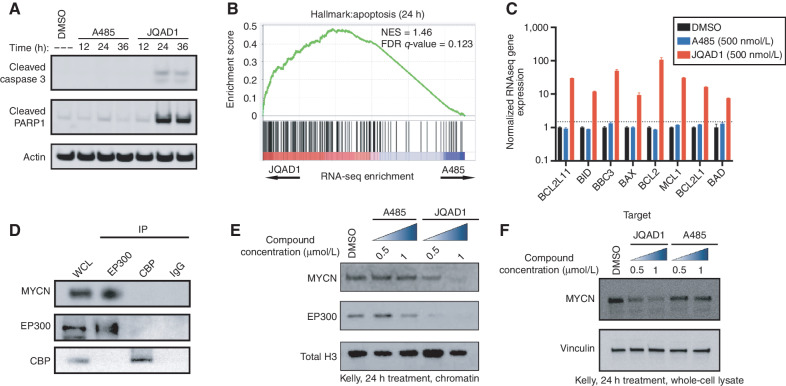
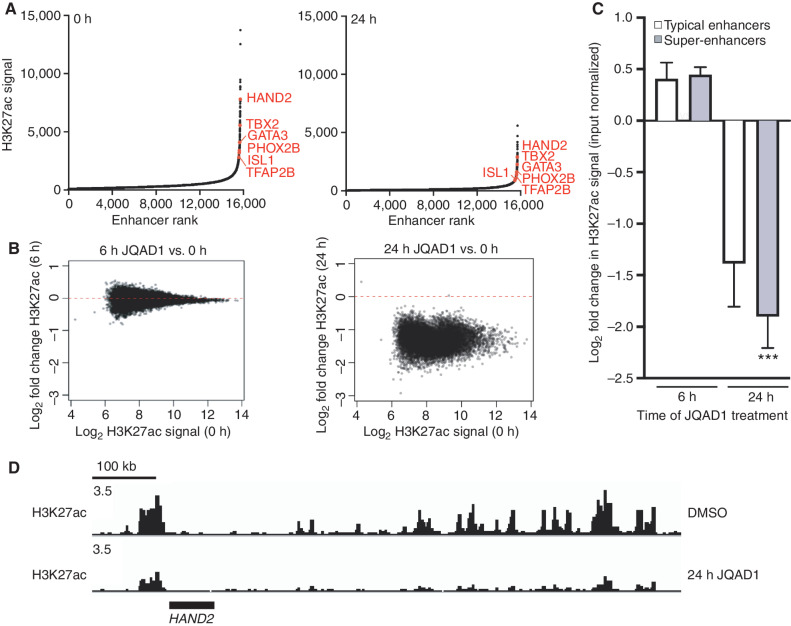
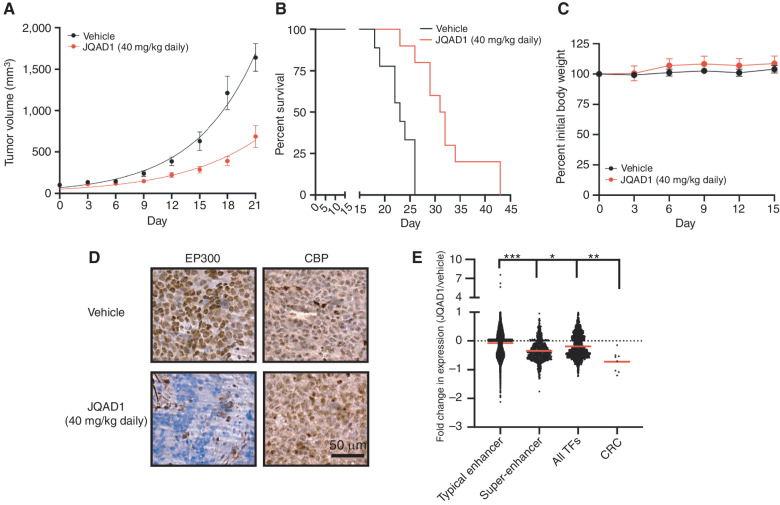
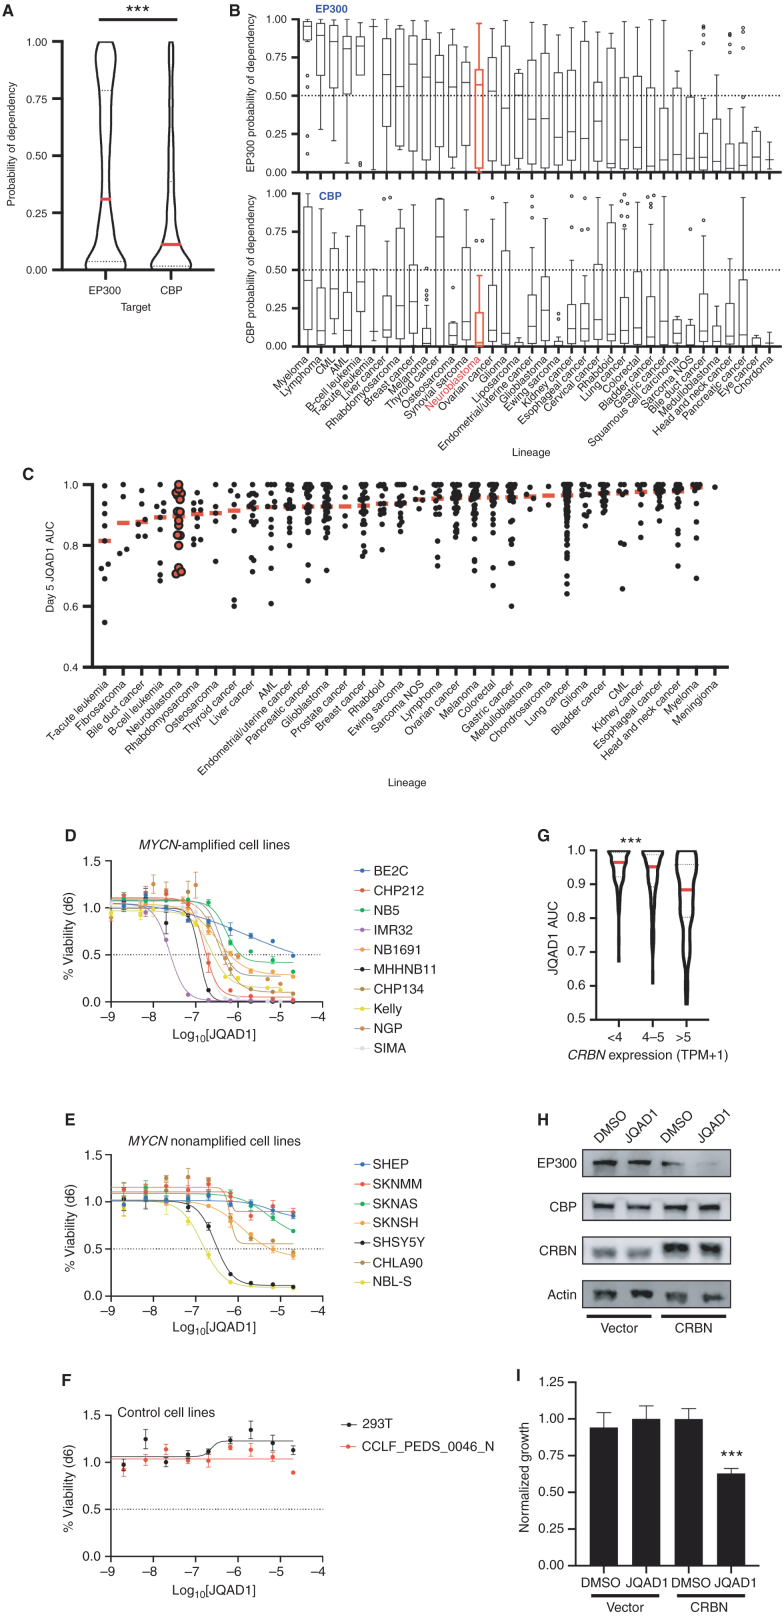
Gene expression is regulated by promoters and enhancers marked by histone H3 lysine 27 acetylation (H3K27ac), which is established by the paralogous histone acetyltransferases (HAT) EP300 and CBP. These enzymes display overlapping regulatory roles in untransformed cells, but less characterized roles in cancer cells. We demonstrate that the majority of high-risk pediatric neuroblastoma (NB) depends on EP300, whereas CBP has a limited role. EP300 controls enhancer acetylation by interacting with TFAP2β, a transcription factor member of the lineage-defining transcriptional core regulatory circuitry (CRC) in NB. To disrupt EP300, we developed a proteolysis-targeting chimera (PROTAC) compound termed "JQAD1" that selectively targets EP300 for degradation. JQAD1 treatment causes loss of H3K27ac at CRC enhancers and rapid NB apoptosis, with limited toxicity to untransformed cells where CBP may compensate. Furthermore, JQAD1 activity is critically determined by cereblon (CRBN) expression across NB cells.

Significance: EP300, but not CBP, controls oncogenic CRC-driven transcription in high-risk NB by binding TFAP2β. We developed JQAD1, a CRBN-dependent PROTAC degrader with preferential activity against EP300 and demonstrated its activity in NB. JQAD1 has limited toxicity to untransformed cells and is effective in vivo in a CRBN-dependent manner. This article is highlighted in the In This Issue feature, p. 587.


Figures

Figure 1. EP300, but not CBP, is required for NB cell growth. A, Heat map of probability of dependency on NB cell lines (n = 19) in the DepMap 20Q2 data release demonstrates that most NB cell lines depend on EP300 (darker red color) compared with only few requiring CBP. B, Kelly cells stably expressing Cas9 were infected with single-guide RNAs (sgRNA) targeting EP300 (EP300-1,2), CBP (CBP-1,2), or controls (ch2.2, LACZ) for five days, prior to Western blotting to the noted targets. Data are representative of three independent sgRNA infections and lysates. C, Colony formation assays were performed following sgRNA infection as in C in Kelly and BE2C cells. Cells were cultured for 10 days after infection. n = 3 independent replicates per cell line, per treatment. *, P < 0.05. Bars, SEM. D, Kelly NB cells were treated in colony formation assays with a range of concentrations of the EP300/CBP combined inhibitors C646, CBP30, and A485. n = 3 independent replicates per cell line, per treatment. Bars, SEM. See also Supplementary Fig. S1.
Figure 1.
EP300, but not CBP, is required for NB cell growth. A, Heat map of probability of dependency on NB cell lines (n = 19) in the DepMap 20Q2 data release demonstrates that most NB cell lines depend on EP300 (darker red color) compared with only few requiring CBP. B, Kelly cells stably expressing Cas9 were infected with single-guide RNAs (sgRNA) targeting EP300 (EP300-1,2), CBP (CBP-1,2), or controls (ch2.2, LACZ) for five days, prior to Western blotting to the noted targets. Data are representative of three independent sgRNA infections and lysates. C, Colony formation assays were performed following sgRNA infection as in C in Kelly and BE2C cells. Cells were cultured for 10 days after infection. n = 3 independent replicates per cell line, per treatment. *, P < 0.05. Bars, SEM. D, Kelly NB cells were treated in colony formation assays with a range of concentrations of the EP300/CBP combined inhibitors C646, CBP30, and A485. n = 3 independent replicates per cell line, per treatment. Bars, SEM. See also Supplementary Fig. S1.
Figure 2. EP300 regulates the NB CRC directed by TFAP2β. A, STRING database interaction plot of nuclear dependency genes in NB cells. Data are derived from ref. 9. Displayed are CRC TFs in blue and proteins with available targeting compounds in red. Connecting lines indicate previously demonstrated protein–protein interactions. B, Scatter plot of log2-transformed read counts of EP300 or CBP ChIP-seq in the collapsed union of separately identified high-confidence CBP- and EP300-binding sites in Kelly cells. R indicates the Spearman correlation coefficient demonstrating a strong linear relationship in coverage. See Supplementary Fig. S2A for a similar analysis in BE2C cells. C, Genome-wide heat map analysis of chromatin composition at the collapsed union of separately identified high-confidence CRC TF–binding sites in Kelly cells. Rows ordered by EP300 signal. See Supplementary Fig. S2B for a similar analysis in BE2C cells. ATAC-seq, Assay for Transposase-Accessible Chromatin using sequencing. D, Representative ChIP-seq plots demonstrating binding of CRC factors (blue), CBP (green), and EP300 (red) at the PHOX2B CRC TF locus in Kelly NB cells. Also shown is the PHOX2B super-enhancer (H3K27ac) and open chromatin (ATAC-seq, black). Data are representative of both Kelly and BE2C cells and all CRC loci. Values represent normalized reads per million. E, Motif enrichment analysis of ChIP-seq to EP300 and CBP in Kelly NB cells. Data were restricted to the top 500 bound peaks by EP300 or CBP in Kelly NB cells. Colored dots indicate known enriched TFs. Arrow indicates specifically enriched motif, corresponding to TFAP2β. F, Position-weight matrix from analysis in D demonstrates the top enriched specific sequence under EP300 peaks compared with CBP peaks, corresponding to the consensus binding sequence for TFAP2β. G, Co-IP followed by Western blotting analysis of EP300 and CBP in Kelly NB cells. IgG, isotype-matched rabbit IgG antibody; WCL, whole-cell lysate. Data are representative of three independent co-IP Western blots. H, Kelly NB cells expressing Cas9 were infected with sgRNAs targeting TFAP2β (TFAP2β-1,2) or control loci (ch2.2, LACZ), followed by Western blotting to the shown targets. Data are representative of three independent lysates and blots. I, Genome-wide heat map analysis of H3K27ac coverage in wild-type and TFAP2β-knockout Kelly cells using cell number and Escherichia coli spike-in normalized CUT&RUN sequencing. Rows represent 6-kb regions centered on the center of the collapsed union of high-confidence peaks separately identified in each condition and are ordered by control (ch2.2) signal. J, Propodium iodide flow cytometry of Kelly NB cells expressing Cas9 and infected with sgRNAs targeting TFAP2β (TFAP2β-1,2) or control loci (ch2.2, LACZ). n = 3 independent infections and flow analyses. *, P < 0.05. Bars, SEM. See also Supplementary Fig. S2.
Figure 2.
EP300 regulates the NB CRC directed by TFAP2β. A, STRING database interaction plot of nuclear dependency genes in NB cells. Data are derived from ref. . Displayed are CRC TFs in blue and proteins with available targeting compounds in red. Connecting lines indicate previously demonstrated protein–protein interactions. B, Scatter plot of log2-transformed read counts of EP300 or CBP ChIP-seq in the collapsed union of separately identified high-confidence CBP- and EP300-binding sites in Kelly cells. R indicates the Spearman correlation coefficient demonstrating a strong linear relationship in coverage. See Supplementary Fig. S2A for a similar analysis in BE2C cells. C, Genome-wide heat map analysis of chromatin composition at the collapsed union of separately identified high-confidence CRC TF–binding sites in Kelly cells. Rows ordered by EP300 signal. See Supplementary Fig. S2B for a similar analysis in BE2C cells. ATAC-seq, Assay for Transposase-Accessible Chromatin using sequencing. D, Representative ChIP-seq plots demonstrating binding of CRC factors (blue), CBP (green), and EP300 (red) at the PHOX2B CRC TF locus in Kelly NB cells. Also shown is the PHOX2B super-enhancer (H3K27ac) and open chromatin (ATAC-seq, black). Data are representative of both Kelly and BE2C cells and all CRC loci. Values represent normalized reads per million. E, Motif enrichment analysis of ChIP-seq to EP300 and CBP in Kelly NB cells. Data were restricted to the top 500 bound peaks by EP300 or CBP in Kelly NB cells. Colored dots indicate known enriched TFs. Arrow indicates specifically enriched motif, corresponding to TFAP2β. F, Position-weight matrix from analysis in D demonstrates the top enriched specific sequence under EP300 peaks compared with CBP peaks, corresponding to the consensus binding sequence for TFAP2β. G, Co-IP followed by Western blotting analysis of EP300 and CBP in Kelly NB cells. IgG, isotype-matched rabbit IgG antibody; WCL, whole-cell lysate. Data are representative of three independent co-IP Western blots. H, Kelly NB cells expressing Cas9 were infected with sgRNAs targeting TFAP2β (TFAP2β-1,2) or control loci (ch2.2, LACZ), followed by Western blotting to the shown targets. Data are representative of three independent lysates and blots. I, Genome-wide heat map analysis of H3K27ac coverage in wild-type and TFAP2β-knockout Kelly cells using cell number and Escherichia coli spike-in normalized CUT&RUN sequencing. Rows represent 6-kb regions centered on the center of the collapsed union of high-confidence peaks separately identified in each condition and are ordered by control (ch2.2) signal. J, Propodium iodide flow cytometry of Kelly NB cells expressing Cas9 and infected with sgRNAs targeting TFAP2β (TFAP2β-1,2) or control loci (ch2.2, LACZ). n = 3 independent infections and flow analyses. *, P < 0.05. Bars, SEM. See also Supplementary Fig. S2.
Figure 3. JQAD1 is a selective EP300 degrader. A, Chemical structure of (R,S)-A485 and (R,S)-JQAD1. B, Kelly cells were treated with 1 μmol/L (R,S)-A485, (R,S)-JQAD1, (S,S)-JQAD1, or DMSO for 6 days, and growth was measured by CellTiter-Glo assay. n = 3 independent experiments and measurements at each time point. Bars, SEM. C, Kelly cell lysates were treated with combinations of Biotin-JQAD1 or pomalidomide prior to streptavidin-bead purification and Western blotting of protein isolates demonstrating enriched interaction of JQAD1 with CRBN and EP300 proteins. WCL, whole-cell lysate. Data are representative of three independent experiments and blots. D, Kelly NB cells were treated with DMSO, A485, or JQAD1 at the noted concentrations (in μmol/L) for 24 hours prior to lysis for Western blotting. Data are representative of three independent biological repeats. E, SILAC-labeled Kelly NB cells were treated with JQAD1 at 500 nmol/L or DMSO vehicle for 24 hours prior to nuclear extraction and analysis by mass spectrometry. Ratio of detected peptides at 0 hours versus 24 hours is demonstrated. Data represent the sum ratio of heavy:light-labeled protein detected in triplicate at 24 hours compared with 0 hours. Dotted line indicates a P value of 0.01. Red labeled points indicate EP300 and CBP. n = 3 independent treatments, lysates, and mass spectrometry reactions. F, Kelly NB cells were treated with JQAD1 at 500 nmol/L for the noted time points prior to lysis for Western blotting. Data are representative of three independent experiments and blots. Asterisk (*) indicates cleaved PARP1 species. G, Kelly cells stably expressing Cas9 were infected with sgRNAs targeting CRBN (CRBN-1,3) or control loci (ch2.2, LACZ), and pools of knockout (KO) cells were established. Western blotting was performed with antibodies against CRBN. Actin is shown as a loading control. Data are representative of three independent Western blots. H, Kelly Cas9 control or CRBN-knockout cells were treated with a range of doses of JQAD1 for seven days, prior to assay by CellTiter-Glo. n = 3 independent replicates per dose and time point. I and J, Propodium iodide flow cytometry of sub-G1 events in Kelly (I) and NGP (J) cells treated with JQAD1 or A485 for the noted time points (in hours). Data are a summary of n > 3 independent flow experiments. Compound treatment was performed at 500 nmol/L (Kelly) and 1 μmol/L (NGP). Similar results were obtained in SIMA cells treated with compounds at 1 μmol/L. Bars, SEM. See also Supplementary Fig. S3.
Figure 3.
JQAD1 is a selective EP300 degrader. A, Chemical structure of (R,S)-A485 and (R,S)-JQAD1. B, Kelly cells were treated with 1 μmol/L (R,S)-A485, (R,S)-JQAD1, (S,S)-JQAD1, or DMSO for 6 days, and growth was measured by CellTiter-Glo assay. n = 3 independent experiments and measurements at each time point. Bars, SEM. C, Kelly cell lysates were treated with combinations of Biotin-JQAD1 or pomalidomide prior to streptavidin-bead purification and Western blotting of protein isolates demonstrating enriched interaction of JQAD1 with CRBN and EP300 proteins. WCL, whole-cell lysate. Data are representative of three independent experiments and blots. D, Kelly NB cells were treated with DMSO, A485, or JQAD1 at the noted concentrations (in μmol/L) for 24 hours prior to lysis for Western blotting. Data are representative of three independent biological repeats. E, SILAC-labeled Kelly NB cells were treated with JQAD1 at 500 nmol/L or DMSO vehicle for 24 hours prior to nuclear extraction and analysis by mass spectrometry. Ratio of detected peptides at 0 hours versus 24 hours is demonstrated. Data represent the sum ratio of heavy:light-labeled protein detected in triplicate at 24 hours compared with 0 hours. Dotted line indicates a P value of 0.01. Red labeled points indicate EP300 and CBP. n = 3 independent treatments, lysates, and mass spectrometry reactions. F, Kelly NB cells were treated with JQAD1 at 500 nmol/L for the noted time points prior to lysis for Western blotting. Data are representative of three independent experiments and blots. Asterisk (*) indicates cleaved PARP1 species. G, Kelly cells stably expressing Cas9 were infected with sgRNAs targeting CRBN (CRBN-1,3) or control loci (ch2.2, LACZ), and pools of knockout (KO) cells were established. Western blotting was performed with antibodies against CRBN. Actin is shown as a loading control. Data are representative of three independent Western blots. H, Kelly Cas9 control or CRBN-knockout cells were treated with a range of doses of JQAD1 for seven days, prior to assay by CellTiter-Glo. n = 3 independent replicates per dose and time point. I and J, Propodium iodide flow cytometry of sub-G1 events in Kelly (I) and NGP (J) cells treated with JQAD1 or A485 for the noted time points (in hours). Data are a summary of n > 3 independent flow experiments. Compound treatment was performed at 500 nmol/L (Kelly) and 1 μmol/L (NGP). Similar results were obtained in SIMA cells treated with compounds at 1 μmol/L. Bars, SEM. See also Supplementary Fig. S3.
Figure 4. EP300 degradation rapidly disrupts MYCN expression and causes apoptosis. A, Kelly NB cells were treated with 1 μmol/L JQAD1, A485, or DMSO control for 12, 24, or 36 hours, prior to lysis and Western blotting for the markers of apoptosis: cleaved caspase-3 and cleaved PARP1. Actin is demonstrated as a loading control. Data is representative of three independent treatments and analyses in Kelly and NGP cells. B, Kelly cells were treated with 500 nmol/L JQAD1, A485, or DMSO control for 24 hours prior to External RNA Controls Consortium (ERCC)–controlled spike in RNA-seq. GSEA of RNA-seq results was performed with the MSigDB hallmarks dataset. n = 3 biological replicates and independent RNA extractions per treatment. C, Normalized RNA-seq gene expression of pro- and antiapopotic mRNA transcripts from Kelly cells treated as in B. Log10 transcript expression is shown, normalized against DMSO and ERCC controls. n = 3 biological replicates and independent RNA extractions per treatment. Bars, SEM. D, Nuclear lysates from Kelly cells were immunoprecipitated with anti-EP300, anti-CBP, or IgG control antibodies. WCL, whole-cell lysate. Data is representative of >3 independent co-IP/Western blots. E and F, Kelly cells were treated with DMSO control, A485 (0.5, 1 μmol/L), or JQAD1 (0.5, 1 μmol/L), followed by extraction of chromatin (E) or whole-cell lysates (F) and Western blotting. Total H3 is shown as a loading control. Data are representative of three independent biological replicates. See also Supplementary Fig. S4. NES, normalized enrichment score.
Figure 4.
EP300 degradation rapidly disrupts MYCN expression and causes apoptosis. A, Kelly NB cells were treated with 1 μmol/L JQAD1, A485, or DMSO control for 12, 24, or 36 hours, prior to lysis and Western blotting for the markers of apoptosis: cleaved caspase-3 and cleaved PARP1. Actin is demonstrated as a loading control. Data is representative of three independent treatments and analyses in Kelly and NGP cells. B, Kelly cells were treated with 500 nmol/L JQAD1, A485, or DMSO control for 24 hours prior to External RNA Controls Consortium (ERCC)–controlled spike in RNA-seq. GSEA of RNA-seq results was performed with the MSigDB hallmarks dataset. n = 3 biological replicates and independent RNA extractions per treatment. C, Normalized RNA-seq gene expression of pro- and antiapopotic mRNA transcripts from Kelly cells treated as in B. Log10 transcript expression is shown, normalized against DMSO and ERCC controls. n = 3 biological replicates and independent RNA extractions per treatment. Bars, SEM. D, Nuclear lysates from Kelly cells were immunoprecipitated with anti-EP300, anti-CBP, or IgG control antibodies. WCL, whole-cell lysate. Data is representative of >3 independent co-IP/Western blots. E and F, Kelly cells were treated with DMSO control, A485 (0.5, 1 μmol/L), or JQAD1 (0.5, 1 μmol/L), followed by extraction of chromatin (E) or whole-cell lysates (F) and Western blotting. Total H3 is shown as a loading control. Data are representative of three independent biological replicates. See also Supplementary Fig. S4. NES, normalized enrichment score.
Figure 5. JQAD1 causes genome-wide loss of histone H3K27ac enriched at super-enhancers. A, Enhancers were ranked by H3K27ac signal at 0 hours (left) and 24 hours (right) after treatment of Kelly cells with 500 nmol/L JQAD1. Data are representative of two independent treatments and ChIP-seq experiments. B, Log2 fold change in enhancer H3K27ac signal resolved by H3K27ac ChIP-seq in Kelly NB cells at 0 versus 6 hours (left) and 0 versus 24 hours (right). C, Log2 fold change in enhancer H3K27ac signal stratified by super-enhancers and typical enhancers at 6 and 24 hours after treatment of Kelly cells with 500 nmol/L JQAD1. ***, P < 0.0001 by Student t test comparing super-enhancer– and typical enhancer–regulated genes at 24 hours. Bars, SEM. D, Representative gene tracks of Kelly cells treated with JQAD1 at 500 nmol/L for 0 and 24 hours at the HAND2 CRC factor locus. Data are representative of the adrenergic CRC factor loci (HAND2, ISL1, PHOX2B, GATA3, TBX2, ASCL1, and TFAP2β) and two independent treatments and ChIP-seq experiments. See also Supplementary Fig. S4.
Figure 5.
JQAD1 causes genome-wide loss of histone H3K27ac enriched at super-enhancers. A, Enhancers were ranked by H3K27ac signal at 0 hours (left) and 24 hours (right) after treatment of Kelly cells with 500 nmol/L JQAD1. Data are representative of two independent treatments and ChIP-seq experiments. B, Log2 fold change in enhancer H3K27ac signal resolved by H3K27ac ChIP-seq in Kelly NB cells at 0 versus 6 hours (left) and 0 versus 24 hours (right). C, Log2 fold change in enhancer H3K27ac signal stratified by super-enhancers and typical enhancers at 6 and 24 hours after treatment of Kelly cells with 500 nmol/L JQAD1. ***, P < 0.0001 by Student t test comparing super-enhancer– and typical enhancer–regulated genes at 24 hours. Bars, SEM. D, Representative gene tracks of Kelly cells treated with JQAD1 at 500 nmol/L for 0 and 24 hours at the HAND2 CRC factor locus. Data are representative of the adrenergic CRC factor loci (HAND2, ISL1, PHOX2B, GATA3, TBX2, ASCL1, and TFAP2β) and two independent treatments and ChIP-seq experiments. See also Supplementary Fig. S4.
Figure 6. JQAD1 causes tumor growth suppression and loss of EP300 in vivo. A, Kelly NB cell xenografts were established in NSG mice and mice treated with vehicle control (n = 9) or JQAD1 at 40 mg/kg i.p. daily (n = 10). Tumor growth curve kinetics were also analyzed by two-way ANOVA with mixed-effects analysis, demonstrating that JQAD1 suppresses tumor growth (P < 0.0001 for vehicle vs. JQAD1 treatment groups). B, Kaplan–Meier survival analysis of mice in A. JQAD1 prolongs survival (log-rank test P = 0.0003 for JQAD1-treated mice compared with vehicle). C, Normalized body weights of animals from A and B. D, IHC of EP300 and CBP in Kelly cell xenografts treated with either vehicle control or JQAD1 (40 mg/kg i.p. daily) for 14 days. Data are representative of three independent animals per treatment. Scale bar, 50 μm. E, ERCC spike-in RNA-seq was performed on tumor cells recovered from animals treated in D. Results are shown as the fold change in expression of animals treated with 40 mg/kg JQAD1 daily (n = 3) compared with vehicle control (n = 4) at day 14. RNA-seq groups of genes are stratified by their regulation by typical or super-enhancers and gene identity of TF or CRC gene. ***, P < 0.0001 between typical enhancer and super-enhancer groups and between typical enhancer and CRC gene expression; *, P = 0.0223 between super-enhancer groups and CRC gene expression; **, P = 0.0013 between all TFs and CRC gene expression. See also Supplementary Fig. S5.
Figure 6.
JQAD1 causes tumor growth suppression and loss of EP300 in vivo. A, Kelly NB cell xenografts were established in NSG mice and mice treated with vehicle control (n = 9) or JQAD1 at 40 mg/kg i.p. daily (n = 10). Tumor growth curve kinetics were also analyzed by two-way ANOVA with mixed-effects analysis, demonstrating that JQAD1 suppresses tumor growth (P < 0.0001 for vehicle vs. JQAD1 treatment groups). B, Kaplan–Meier survival analysis of mice in A. JQAD1 prolongs survival (log-rank test P = 0.0003 for JQAD1-treated mice compared with vehicle). C, Normalized body weights of animals from A and B. D, IHC of EP300 and CBP in Kelly cell xenografts treated with either vehicle control or JQAD1 (40 mg/kg i.p. daily) for 14 days. Data are representative of three independent animals per treatment. Scale bar, 50 μm. E, ERCC spike-in RNA-seq was performed on tumor cells recovered from animals treated in D. Results are shown as the fold change in expression of animals treated with 40 mg/kg JQAD1 daily (n = 3) compared with vehicle control (n = 4) at day 14. RNA-seq groups of genes are stratified by their regulation by typical or super-enhancers and gene identity of TF or CRC gene. ***, P < 0.0001 between typical enhancer and super-enhancer groups and between typical enhancer and CRC gene expression; *, P = 0.0223 between super-enhancer groups and CRC gene expression; **, P = 0.0013 between all TFs and CRC gene expression. See also Supplementary Fig. S5.
Figure 7. Cancer cells display increased dependency on EP300 compared with CBP. A, Probability of dependency of all cell lines in DepMap (n = 757, 20Q2 release), on EP300 and CBP were compared, demonstrating dependency on EP300 in 308 of 757 (40.7%) and CBP in 140 of 757 (18.5%) of all cell lines, determined by probability of dependency >0.5. ***, P < 0.0001 by two-tailed Student t test. AML, acute myeloid leukemia; CML, chronic myeloid leukemia; NOS, not otherwise specified. B, Individual lineages of cell lines from A were identified, and average probability of dependency on EP300 and CBP were plotted. Red, NB; black, other tumor lineages; bar in box, median; whiskers, 10th–90th centiles; dots, outliers. C, Barcoded cancer cell lines (n = 557) were treated with a concentration range of (R,S)-JQAD1 of 1.2 nmol/L to 20 μmol/L for 5 days prior to sequencing of barcodes. Cell lines were individually classified by lineages, and AUC of the dose–response relationship was plotted. Red bars, median; individual black dots, individual cell lines; red dots, NB cell lines. AUC was calculated from triplicate measurements at each dose at time = 120 hours. D–F, NB and control cell lines were grown for 6 days in the presence of JQAD1 in a dose range from 4.3 nmol/L to 20 μmol/L prior to CellTiter-Glo analysis. Dose–response curves are based on three independent replicates per cell line at each dose. Bars, SEM. Analysis was performed on MYCN-amplified (D), nonamplified (E), and control (F) cell lines, including 293T cells and primary human fibroblasts (CCLF_PEDS_0046_N). All cell lines are of the adrenergic subtype except for NB5 and SKNMM (unknown), and CHP212, SHEP, and SKNAS (mesenchymal). Adrenergic or mesenchymal cell state annotations are derived from refs. 33 and 69. G, JQAD1 AUC values from C were plotted against CRBN expression from the CCLE. ***, P < 0.001 by ANOVA for >5 transcripts per million (TPM) compared against <4 and 4 to 5 TPM groups with post hoc Bonferroni correction. H, BE2C cells stably expressing control (zsGreen) or CRBN (CRBN) were established, and pools of cells were treated with DMSO or 10 μmol/L JQAD1 for 24 hours. Cell lysates were subjected to Western blotting for EP300, CBP, and CRBN. Actin is shown as a loading control. Data are representative of three independent treatments and analyses. I, BE2C cells stably expressing control (zsGreen) or CRBN (CRBN) were treated with DMSO or 10 μmol/L JQAD1 for 6 days prior to CellTiter-Glo analysis for cell growth. Data were normalized against BE2C-zsGreen, DMSO-treated cells. ***, P = 0.008 by Student t test comparing BE2C-CRBN DMSO- and JQAD1-treated cells. n = 3 biological replicates. See Supplementary Fig. S6.
Figure 7.
Cancer cells display increased dependency on EP300 compared with CBP. A, Probability of dependency of all cell lines in DepMap (n = 757, 20Q2 release), on EP300 and CBP were compared, demonstrating dependency on EP300 in 308 of 757 (40.7%) and CBP in 140 of 757 (18.5%) of all cell lines, determined by probability of dependency >0.5. ***, P < 0.0001 by two-tailed Student t test. AML, acute myeloid leukemia; CML, chronic myeloid leukemia; NOS, not otherwise specified. B, Individual lineages of cell lines from A were identified, and average probability of dependency on EP300 and CBP were plotted. Red, NB; black, other tumor lineages; bar in box, median; whiskers, 10th–90th centiles; dots, outliers. C, Barcoded cancer cell lines (n = 557) were treated with a concentration range of (R,S)-JQAD1 of 1.2 nmol/L to 20 μmol/L for 5 days prior to sequencing of barcodes. Cell lines were individually classified by lineages, and AUC of the dose–response relationship was plotted. Red bars, median; individual black dots, individual cell lines; red dots, NB cell lines. AUC was calculated from triplicate measurements at each dose at time = 120 hours. D–F, NB and control cell lines were grown for 6 days in the presence of JQAD1 in a dose range from 4.3 nmol/L to 20 μmol/L prior to CellTiter-Glo analysis. Dose–response curves are based on three independent replicates per cell line at each dose. Bars, SEM. Analysis was performed on MYCN-amplified (D), nonamplified (E), and control (F) cell lines, including 293T cells and primary human fibroblasts (CCLF_PEDS_0046_N). All cell lines are of the adrenergic subtype except for NB5 and SKNMM (unknown), and CHP212, SHEP, and SKNAS (mesenchymal). Adrenergic or mesenchymal cell state annotations are derived from refs. 33 and 69. G, JQAD1 AUC values from C were plotted against CRBN expression from the CCLE. ***, P < 0.001 by ANOVA for >5 transcripts per million (TPM) compared against <4 and 4 to 5 TPM groups with post hoc Bonferroni correction. H, BE2C cells stably expressing control (zsGreen) or CRBN (CRBN) were established, and pools of cells were treated with DMSO or 10 μmol/L JQAD1 for 24 hours. Cell lysates were subjected to Western blotting for EP300, CBP, and CRBN. Actin is shown as a loading control. Data are representative of three independent treatments and analyses. I, BE2C cells stably expressing control (zsGreen) or CRBN (CRBN) were treated with DMSO or 10 μmol/L JQAD1 for 6 days prior to CellTiter-Glo analysis for cell growth. Data were normalized against BE2C-zsGreen, DMSO-treated cells. ***, P = 0.008 by Student t test comparing BE2C-CRBN DMSO- and JQAD1-treated cells. n = 3 biological replicates. See Supplementary Fig. S6.

Comment in

  • Cancer Discov. 12:587.
  • Cancer Discov. 12:587.

References

    1. Lambert SA, Jolma A, Campitelli LF, Das PK, Yin Y, Albu Met al. The human transcription factors. Cell 2018;175:598–9. - PubMed
    1. Bradner JE, Hnisz D, Young RA. Transcriptional addiction in cancer. Cell 2017;168:629–43. - PMC - PubMed
    1. Hnisz D, Schuijers J, Lin CY, Weintraub AS, Abraham BJ, Lee TIet al. Convergence of developmental and oncogenic signaling pathways at transcriptional super-enhancers. Mol Cell 2015;58:362–70. - PMC - PubMed
    1. Whyte WA, Orlando DA, Hnisz D, Abraham BJ, Lin CY, Kagey MHet al. Master transcription factors and mediator establish super-enhancers at key cell identity genes. Cell 2013;153:307–19. - PMC - PubMed
    1. Lin CY, Lovén J, Rahl PB, Paranal RM, Burge CB, Bradner JEet al. Transcriptional amplification in tumor cells with elevated c-Myc. Cell 2012;151:56–67. - PMC - PubMed

Publication types