. 2021 Nov 16;118(46):e2105950118.
doi: 10.1073/pnas.2105950118.

iNKT subsets differ in their developmental and functional requirements on Foxo1

Affiliations

iNKT subsets differ in their developmental and functional requirements on Foxo1

Huimin Zhang et al. Proc Natl Acad Sci U S A. .

Abstract

Invariant natural killer T (iNKT) cells play important roles in regulating immune responses. Based on cytokine profiling and key transcriptional factors, iNKT cells are classified into iNKT1, iNKT2, and iNKT17 subsets. However, whether the development and functions of these subsets are controlled by distinct mechanisms remains unclear. Here, we show that forkhead box protein O1 (Foxo1) promotes differentiation of iNKT1 and iNKT2 cells but not iNKT17 cells because of its distinct contributions to IL7R expression in these subsets. Nuclear Foxo1 is essential for Il7r expression in iNKT1 and iNKT2 cells at early stages of differentiation but is dispensable in iNKT17 cells. RORγt, instead of Foxo1, promotes IL7R expression in iNKT17 cells. Additionally, Foxo1 is required for the effector function of iNKT1 and iNKT2 cells but not iNKT17 cells. Cytoplasmic Foxo1 promotes activation of mTORC1 in iNKT1 and iNKT2 cells through inhibiting TSC1-TSC2 interaction, whereas it is dispensable for mTORC1 activation in iNKT17 cells. iNKT17 cells display distinct metabolic gene expression patterns from iNKT1 and iNKT2 cells that match their different functional requirements on Foxo1. Together, our results demonstrate that iNKT cell subsets differ in their developmental and functional requirements on Foxo1.

Keywords: Foxo1; TSC2; development; function; iNKT subsets.


Conflict of interest statement

The authors declare no competing interest.

Figures

Fig. 1.
Fig. 1.
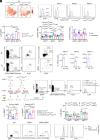
Foxo1 disparately controls the development of iNKT subsets by regulating cell apoptosis. (A) The gating strategy for iNKT cells during stages 0 through 3 in the thymus after enrichment with CD1d-PBS57 tetramer, the representative flow cytometry histogram, and the summarized expression of Foxo1 in thymic iNKT cells at indicated stages (n = 7). Thymocytes from Ja18−/− mice were used as negative controls for tetramer staining. (B) The numbers of thymic iNKT cells at indicated stages in Foxo1fl/fl and pLCKcre Foxo1fl/fl mice (n = 7). (C–E) The percentages of Annexin V+ cells (C, n = 6 to 7), the percentages of Ki67+ cells (D, n = 10), and the expression of Bcl2 (E, n = 9) in iNKT cells during stages 1 through 3 from the thymuses of Foxo1fl/fl and pLCKcre Foxo1fl/fl mice. (F) The summarized expression of Foxo1 in thymic iNKT subsets (n = 7). (G) The gating strategy for identifying iNKT1, iNKT2, and iNKT17 subsets from the thymuses of Foxo1fl/fl and pLCKcre Foxo1fl/fl mice. (H) The cell numbers of indicated iNKT subsets in the thymuses of Foxo1fl/fl (n = 10) and pLCKcre Foxo1fl/fl mice (n = 9). (I) The cell numbers of indicated iNKT subsets in lymph nodes from Foxo1fl/fl and pLCKcre Foxo1fl/fl mice (n = 8). (J and K) The percentages of Annexin V+ cells (J, n = 7 to 10) and the expression of Bcl2 (K, n = 5 to 8) in indicated iNKT subsets from the thymuses of Foxo1fl/fl and pLCKcre Foxo1fl/fl mice. The data are represented as mean ± SD. The Student’s t test was used to determine statistical significance (*P < 0.05, **P < 0.01, ***P < 0.001, n.s., not significant).
Fig. 2.
Fig. 2.
The thymuses of Foxo1-deficient mice display impaired differentiation of iNKT1 and iNKT2 cells at early stages. (A) The sorting strategy and purification of thymic iNKT cells from Foxo1fl/fl and pLCKcre Foxo1fl/fl mice used for scRNA-seq (Left) and t-distributed stochastic neighbor embedding (t-SNE) plot of integrated thymic iNKT cells (Right). Each dot represents one cell (9,308 cells from Foxo1fl/fl mice and 6,922 cells from pLCKcre Foxo1fl/fl mice). (B) A heatmap showing the expression of the three highest differentially expressed genes (Bonferroni-corrected P values < 0.05, Wilcoxson test) per cluster for all iNKT cells. (C) The expression patterns of signature genes including Cd24a, Itm2a, Lef1, Rorc, Tmem176a, Zbtb16, Plac8, Izumo1r, Tbx21, Nkg7, Klrd1, Gzmb, and Ifit3 in thymic iNKT cells from Foxo1fl/fl mice. (D) The pseudotime trajectories of indicated iNKT cell clusters from Foxo1fl/fl and pLCKcre Foxo1fl/fl mice. (E) The expression pattern of Foxo1 in thymic iNKT cells from Foxo1fl/fl and pLCKcre Foxo1fl/fl mice. (F) Visualizing clusters of sorted thymic iNKT cells from Foxo1fl/fl and pLCKcre Foxo1fl/fl mice, respectively, using t-SNE. (G) The composition of iNKT cell clusters in Foxo1fl/fl and pLCKcre Foxo1fl/fl mice. (H) The expression pattern of Bcl2 in thymic iNKT cells from Foxo1fl/fl and pLCKcre Foxo1fl/fl mice.
Fig. 3.
Fig. 3.
Distinct IL7R expression in Foxo1-deficient iNKT subsets explains their developmental differences. (A) The expression pattern of the Il7r gene in thymic iNKT cells from Foxo1fl/fl and pLCKcre Foxo1fl/fl mice. (B) The representative flow cytometry analysis of IL7R expression in iNKT1, iNKT2, and iNKT17 cells from the thymuses of wild-type mice. The data are representative of at least three independent experiments. (C and D) The representative flow cytometry analysis (C) and the summarized expression of IL7R (D) in indicated iNKT subsets from the thymuses of Foxo1fl/fl and pLCKcre Foxo1fl/fl mice (n = 3). (E) The summarized phosphorylated STAT5 levels in indicated iNKT subsets from the spleens of Foxo1fl/fl (n = 8) and pLCKcre Foxo1fl/fl mice (n = 9) after stimulation with IL7 or PBS as control for 6 h. (F) The expression of IL7R in indicated splenic iNKT subsets after treatment with AS1842856 or DMSO (control) for 8 h (n = 11). (G) The representative flow cytometry analysis and summarized percentages of iNKT subsets in the thymuses from wild-type or Il7r−/ mice (n = 3). (H) A schematic illustration of the bone marrow transfer procedure and gating strategy for measuring IL7R expression in thymic iNKT1 cells derived from indicated retrovirus-transduced donor cells. (I) The percentages of thymic iNKT1 cells and splenic iNKT1 cells derived from indicated retrovirus-transduced donor cells (n = 9). (J) The expression of IL7R in indicated iNKT subsets from the spleens of Foxo1fl/fl and pLCKcre Foxo1fl/fl mice after treatment with GSK805 or DMSO for 8 h (n = 7). (K) The representative flow cytometry analysis of EGFP expression in DN32.D3 cells transfected with mock, pEGFP-C1, or RORγt-EGFP-C1. (L) The flow cytometry analysis of RORγt and IL7R expression in DN32.D3 cells as control and in DN32.D3 cells transfected with pEGFP-C1 or RORγt-EGFP-C1. The data are representative of three independent experiments in K and L. The data are represented as mean ± SD. The Student’s t test was used to determine statistical significance (*P < 0.05, **P < 0.01, ***P < 0.001, n.s., not significant).
Fig. 4.
Fig. 4.
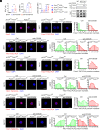
Foxo1 is required for cytokine production and mTORC1 activation in iNKT1 and iNKT2 cells but not in iNKT17 cells. (A and B) The expression of CD25 (A) and CD69 (B) in indicated iNKT subsets from the spleens of Foxo1fl/fl and pLCKcre Foxo1fl/fl mice 4 h after αGalCer (αGC, n = 5 to 7) injection or PBS injection (n = 3 to 7) as control. (C) The summarized percentages of IFN-γ+ iNKT1, IL4+ iNKT1, IL4+ iNKT2, and IL17A+ iNKT17 cells from the spleens of Foxo1fl/fl and pLCKcre Foxo1fl/fl mice 4 h after αGalCer (αGC, n = 7 to 13) injection or PBS injection (n = 3 to 7). (D) The summarized levels of phosphorylated S6 in iNKT1, iNKT2, and iNKT17 cells from the spleens of Foxo1fl/fl and pLCKcre Foxo1fl/fl mice 4 h after αGalCer (αGC, n = 7 to 9) injection or PBS injection (n = 3 to 5). (E) The percentages of splenic IFN-γ+ iNKT1 (n = 10 to 13), IL4+ iNKT2 (n = 4 to 5), and IL17A+ iNKT17 cells (n = 13) in mice injected with αGalCer (2 μg per mouse) or αGalCer plus rapamycin (Rapa, 50 μg per mouse). Mice injected with PBS were used as controls (Ctrl, n = 3 to 4). (F) The flow cytometry analysis of TSC2 expression in splenic iNKT1 cells transfected with shNC or shTsc2 (n = 10). (G) The percentages of IFN-γ+ iNKT1 cells from the spleens of Foxo1fl/fl and pLCKcre Foxo1fl/fl mice (n = 4 or 5) with or without knockdown of Tsc2 after activation with or without anti-CD3 plus anti-CD28. The data are represented as mean ± SD. The Student’s t test was used to determine statistical significance (*P < 0.05, **P < 0.01, ***P < 0.001, n.s., not significant).
Fig. 5.
Fig. 5.
Cytoplasmic Foxo1 inhibits the TSC1–TSC2 interaction in iNKT1 and iNKT2 cells but not in iNKT17 cells after activation. (A and B) The summarized percentages of IFN-γ+ iNKT1 cells (A) and phosphorylated S6 levels (B) in splenic iNKT1 cells after activation with or without plate-coated anti-CD3 plus anti-CD28 in the presence or absence of AS1842856 (AS, 1 μM) for 4 h (n = 3 to 6). (C) The levels of phosphorylated AKT in splenic iNKT1 cells from Foxo1fl/fl and pLCKcre Foxo1fl/fl mice after injection with αGC or PBS for 4 h (n = 4 to 6). (D) The coimmunoprecipitation of Foxo1, TSC2, and TSC1 in sorted iNKT1 cells activated with or without anti-CD3 plus anti-CD28 for 90 min. The data are representative of three independent experiments. (E–G) The location of Foxo1 (E), representative images of the Foxo1–TSC2 interaction (F), and distribution of Foxo1–TSC2 PLA punctum numbers (G) in sorted thymic iNKT1 cells from Foxo1fl/fl mice with or without anti-CD3 plus anti-CD28 stimulation. The sorted thymic iNKT1 cells from pLCKcre Foxo1fl/fl mice were used as negative controls. (H and I) Some representative images of the TSC1–TSC2 interaction (H) and the distribution of TSC1–TSC2 PLA punctum numbers (I) in sorted thymic iNKT1 cells from pLCKcre Foxo1fl/fl and Foxo1fl/fl mice with or without anti-CD3 plus anti-CD28 antibody stimulation. (J–N) The location of Foxo1 (J), representative images of the Foxo1–TSC2 interaction (K), distribution of Foxo1–TSC2 PLA punctum numbers (L), representative images of the TSC1–TSC2 interaction (M), and distribution of TSC1–TSC2 PLA punctum numbers (N) in sorted thymic iNKT2 cells from indicated mice with or without anti-CD3 plus anti-CD28 antibody stimulation. (O–S) The location of Foxo1 (O), representative images of the Foxo1–TSC2 interaction (P), distribution of Foxo1–TSC2 PLA punctum numbers (Q), representative images of the TSC1–TSC2 interaction (R), and distribution of TSC1–TSC2 PLA punctum numbers (S) in sorted thymic iNKT17 cells from indicated mice with or without anti-CD3 plus anti-CD28 antibody stimulation. The data are representative of (E, F, H, J, K, M, O, P, and R) or pooled from (G, I, L, N, Q, and S) three independent experiments. (Scale bars, 5 μm.) The data are represented as mean ± SD. The Student’s t test was used to determine statistical significance (n.s., not significant).
Fig. 6.
Fig. 6.
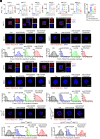
Distinct metabolism in iNKT subsets supports their Foxo1-dependent and Foxo1-independent activation of mTORC1. (A–C) Cytokine production and S6 phosphorylation in iNKT1 (A), iNKT2 (B), and iNKT17 cells (C) from the spleens of wild-type mice injected with PBS (control) (n = 3), αGC (n = 4 to 8), αGC plus 2DG (n = 4 to 10), or αGC plus etomoxir for 4 h (n = 4 to 10). (D) The levels of phosphorylated AKT at site 308 (pAKT308) in sorted thymic iNKT1 cells stimulated with PBS (control) or anti-CD3 plus anti-CD28 (anti-CD3/28) in the presence or absence of 2-DG (5 mM) or etomoxir (20 μM). The samples were analyzed with confocal and were pooled from five wild-type mice. (E–I) The location of Foxo1 (E), representative images of the Foxo1–TSC2 interaction (F), distribution of Foxo1–TSC2 PLA punctum numbers (G), representative images of the TSC1–TSC2 interaction (H), and distribution of TSC1–TSC2 PLA punctum numbers (I) in sorted thymic iNKT1 cells from wild-type mice with or without indicated stimulation. (J–N) The location of Foxo1 (J), representative images of the Foxo1–TSC2 interaction (K), distribution of Foxo1–TSC2 PLA punctum numbers (L), representative images of the TSC1–TSC2 interaction (M), and distribution of TSC1–TSC2 PLA punctum numbers (N) in sorted thymic iNKT2 cells from wild-type mice with or without indicated stimulation. (O–R) Some representative images of the TSC1–TSC2 interaction (O), distribution of TSC1–TSC2 PLA punctum numbers (P), representative images of the TSC1–TSC2 interaction (Q), and distribution of TSC1–TSC2 PLA punctum numbers (R) in sorted thymic iNKT17 cells from indicated mice with or without indicated stimulation. The data are representative of (E, F, H, J, K, M, O, and Q) or pooled from (G, I, L, N, P, and R) three independent experiments. (Scale bars, 5 μm.) The data are represented as mean ± SD. The Student’s t test was used to determine statistical significance (*P < 0.05, ***P < 0.001, n.s., not significant).

Similar articles

Cited by

  • Markers and makers of NKT17 cells.
    Liman N, Park JH. Liman N, et al. Exp Mol Med. 2023 Jun;55(6):1090-1098. doi: 10.1038/s12276-023-01015-y. Epub 2023 Jun 1. Exp Mol Med. 2023. PMID: 37258582 Free PMC article. Review.

References

    1. Bendelac A., Savage P. B., Teyton L., The biology of NKT cells. Annu. Rev. Immunol. 25, 297–336 (2007). - PubMed
    1. Fujiki K., et al. , IL-12 and IL-18 induction and subsequent NKT activation effects of the Japanese botanical medicine Juzentaihoto. Int. J. Mol. Sci. 9, 1142–1155 (2008). - PMC - PubMed
    1. Taniguchi M., Seino K., Nakayama T., The NKT cell system: Bridging innate and acquired immunity. Nat. Immunol. 4, 1164–1165 (2003). - PubMed
    1. Watarai H., et al. , Development and function of invariant natural killer T cells producing T(h)2- and T(h)17-cytokines. PLoS Biol. 10, e1001255 (2012). - PMC - PubMed
    1. Lee Y. J., Holzapfel K. L., Zhu J., Jameson S. C., Hogquist K. A., Steady-state production of IL-4 modulates immunity in mouse strains and is determined by lineage diversity of iNKT cells. Nat. Immunol. 14, 1146–1154 (2013). - PMC - PubMed

Publication types

MeSH terms

Substances