. 2021 Nov 12;12(1):6550.
doi: 10.1038/s41467-021-26591-3.

Dynamic mechanochemical feedback between curved membranes and BAR protein self-organization

Affiliations

Dynamic mechanochemical feedback between curved membranes and BAR protein self-organization

Anabel-Lise Le Roux et al. Nat Commun. .

Abstract

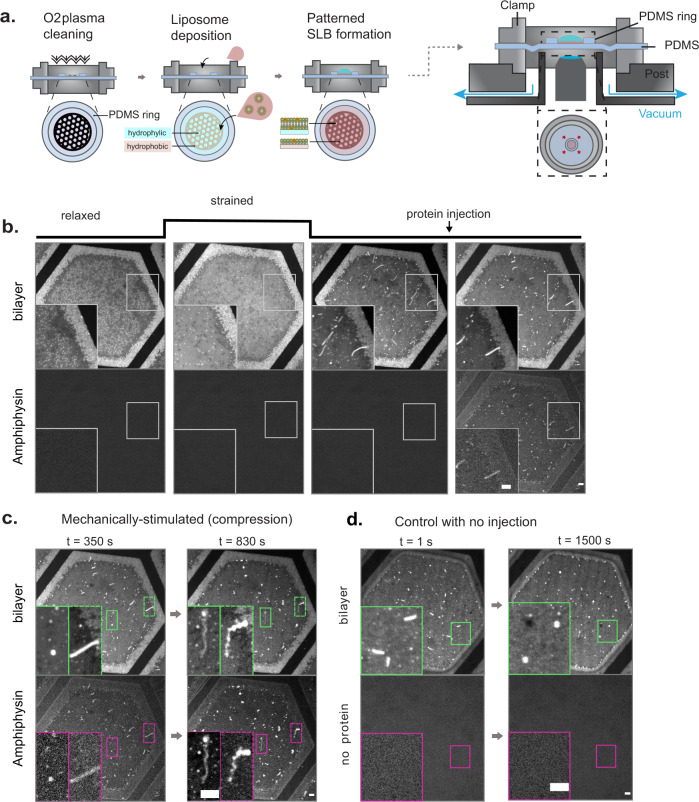
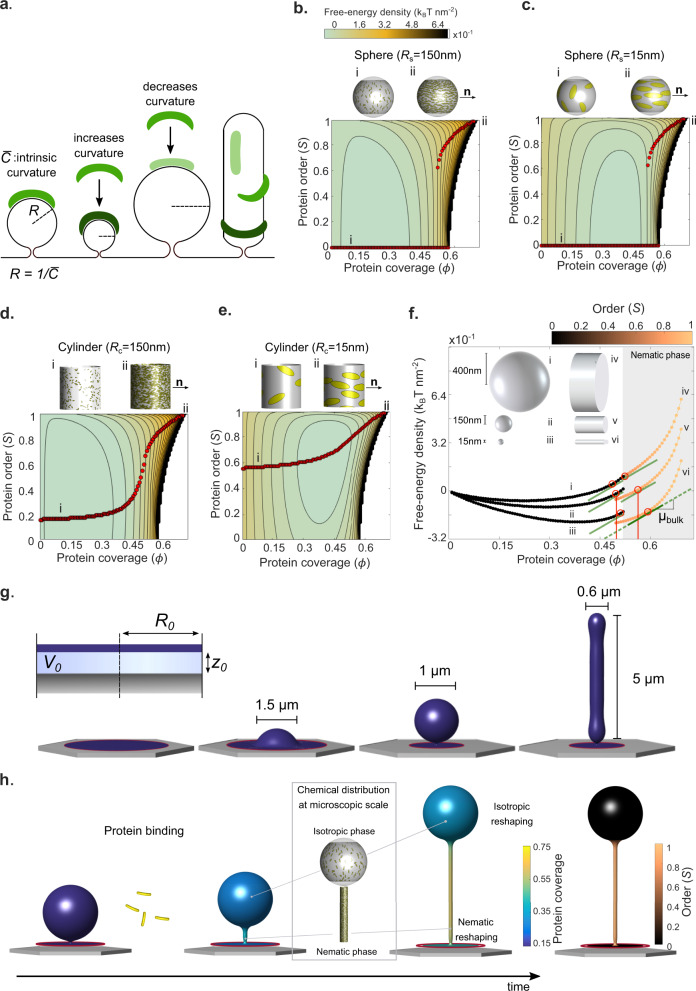
In many physiological situations, BAR proteins reshape membranes with pre-existing curvature (templates), contributing to essential cellular processes. However, the mechanism and the biological implications of this reshaping process remain unclear. Here we show, both experimentally and through modelling, that BAR proteins reshape low curvature membrane templates through a mechanochemical phase transition. This phenomenon depends on initial template shape and involves the co-existence and progressive transition between distinct local states in terms of molecular organization (protein arrangement and density) and membrane shape (template size and spherical versus cylindrical curvature). Further, we demonstrate in cells that this phenomenon enables a mechanotransduction mode, in which cellular stretch leads to the mechanical formation of membrane templates, which are then reshaped into tubules by BAR proteins. Our results demonstrate the interplay between membrane mechanics and BAR protein molecular organization, integrating curvature sensing and generation in a comprehensive framework with implications for cell mechanical responses.


Conflict of interest statement

The authors declare no competing interests.

Figures

Fig. 1
Fig. 1. Experimental system.
a Schematics of the patterned supported lipid bilayer (pSLB) placed in a stretch system compatible with confocal microscopy. The pSLB is obtained by plasma cleaning a PDMS membrane in presence of a TEM grid. Only the exposed PDMS becomes hydrophilic, and subsequent liposome deposition renders a SLB after buffer rinse. The non-exposed PDMS remains hydrophobic and a lipid monolayer is formed instead. b Representative images of the mechanical stimulation of the pSLB, showing both lipid and protein fluorescence images. In the resting initial state, excess liposomes stand on top of the pSLB. With strain, the liposomes incorporate in the pSLB. Upon release, excess lipids are expelled in the form or tubes or buds. At this stage, fluorescent Amphiphysin is gently microinjected on top of pSLB and its binding to the tubes and buds is monitored with time. c Membrane tubes (green inset) and buds (purple inset) before (left) and after (right) being reshaped by Amphiphysin. d Control in which no protein is injected on top of the pSLB. Scale bar, 5 μm.
Fig. 2
Fig. 2. Theoretical and computational modeling.
a Schematic diagram of a BAR domain interacting with a lipid membrane. Protein elastic energy depends on surface curvature and protein orientation. For cylindrical surface, curvature is maximal (dark green) and minimal (light green) along perpendicular directions. be Landscape of free-energy density per unit area Fprot according to our mean-field density functional theory (Section 4.1 of Supplementary Note 1) depending on protein coverage Φ, nematic alignment S, and the shape and size of the underlying membrane (sphere or cylinder as illustrated on top of each plot, where we have generated microscopic realizations of molecular organization consistent with coverage and orientational order of the mean-field theory using a Monte Carlo algorithm). Red dots denote states of equilibrium alignments S for a given protein coverage ϕ, i.e., minimizers of the free energy along vertical profiles, depicting the transition from isotropic (i) to nematic phase (ii–iii). The white region in the energy landscape is forbidden due to steric protein interactions. b, c Discontinuous transitions for protein alignment on isotropically curved membranes. d, e Continuous transitions for anisotropically curved membrane. The intrinsic protein radius of curvature is 1C¯=15 nm (see Supplementary Note 1 for other model parameters). f Free-energy density profiles for spheres and cylinders of different sizes along the equilibrium paths. The chemical potential of proteins is the slope of these curves. All points marked with red circles have the same chemical potential at the tangent points µb and hence are in chemical equilibrium. g Membrane protrusions obtained by lateral compression of an adhered membrane patch of radius R0 interacting with a substrate with a potential U(z) and for various amounts of enclosed volume V0, see Supplementary Note 1. h Schematic of reshaping dynamics involving membrane relaxation, and protein binding, diffusion, and ordering.
Fig. 3
Fig. 3. Dynamics of membrane reshaping.
a Results of simulations (top) and experiments (bottom) showing bud reshaping with time in response to Amphiphysin. Scale bar, 5 μm. b Results of simulations (up) and experiments (down) showing tube reshaping with time in response to Amphiphysin. These simulations were performed using the reference mechanical ensemble described in Supplementary Note 1. Scale bar, 5 μm. c Examples of Amphiphysin fluorescence intensities in buds incubated at two different concentrations. Bud elongation times are marked with an arrow. Source data are provided as a Source data file. d Examples of Amphiphysin fluorescence intensities in tubes incubated at two different concentrations. Tube pearling times are marked with an arrow. Source data are provided as a Source data file. e Ratios of protein coverage on tubes versus buds, normalized to the values measured for the lipid bilayer. Left: experimental values (n = 15), right: theoretical concentration ratios ϕtϕv for a 1 µm diameter bud, exposed to different bulk concentrations. Data are shown as mean ± s.d. and source data are provided as a Source data file. f Left: Initial and final states of pressurized caps (obtained from an hypoosmotic shock) upon incubation with Amphiphysin. At 2.5 µM concentration, lysis of the caps can be observed. Scale bars, 5 μm. Right: Model prediction in pressurized caps of about 1.5 µm in diameter in radius exposed to different Amphiphysin concentrations. States in the pink shaded area are prone to membrane lysis.
Fig. 4
Fig. 4. Mechanical stretch in cells triggers Amphiphysin-mediated tubulation.
a Representative images (in both membrane and Amphiphysin channels) of a cell before, during, and after stretch release. b Detail of membrane and Amphiphysin channels during tubulation. c Quantification of the number of Amphiphysin tubes at rest, during stretch, and once stretch is released (n = 22, Friedman test (two-tailed)). Data are shown as mean ± s.d., and source data are provided as a Source data file. Scale bars, 5 μm.

References

    1. Frost A, Unger VM, De Camilli P. The BAR domain superfamily: membrane-molding macromolecules. Cell. 2009;137:191–196. - PMC - PubMed
    1. Mim C, et al. Structural basis of membrane bending by the N-BAR protein endophilin. Cell. 2012;149:137–145. - PMC - PubMed
    1. Shi Z, Baumgart T. Membrane tension and peripheral protein density mediate membrane shape transitions. Nat. Commun. 2015;6:1–8. - PMC - PubMed
    1. Sorre B, et al. Nature of curvature coupling of amphiphysin with membranes depends on its bound density. Proc. Natl Acad. Sci. USA. 2012;109:173–178. - PMC - PubMed
    1. Lou HY, Zhao W, Zeng Y, Cui B. The role of membrane curvature in nanoscale topography-induced intracellular signaling. Acc. Chem. Res. 2018;51:1046–1053. - PMC - PubMed

Publication types

MeSH terms