. 2021 Nov 12;12(1):6571.
doi: 10.1038/s41467-021-26513-3.

Burdens of post-acute sequelae of COVID-19 by severity of acute infection, demographics and health status

Affiliations

Burdens of post-acute sequelae of COVID-19 by severity of acute infection, demographics and health status

Yan Xie et al. Nat Commun. .

Abstract

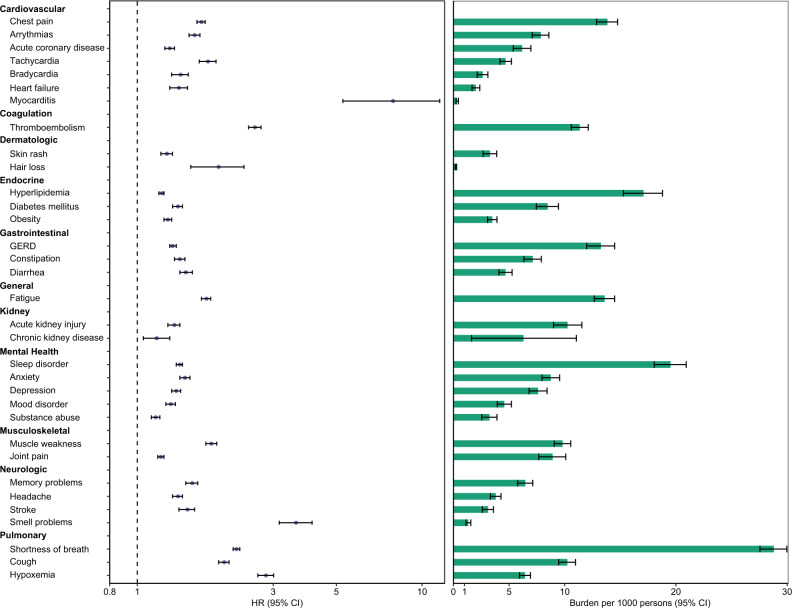
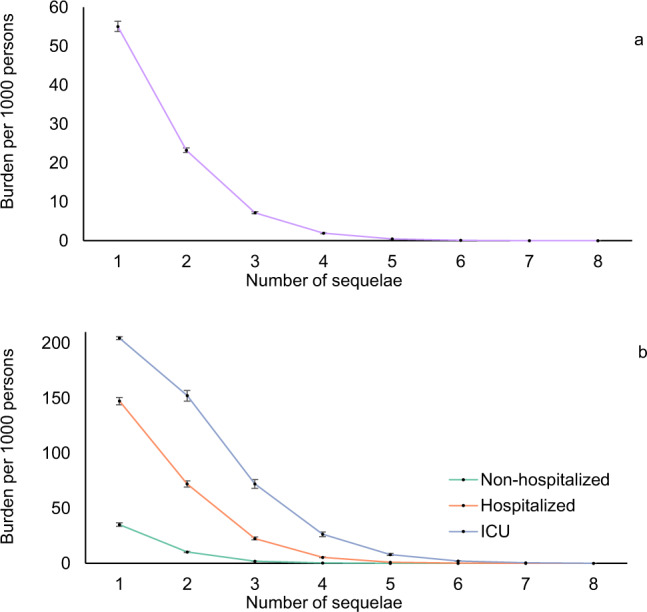
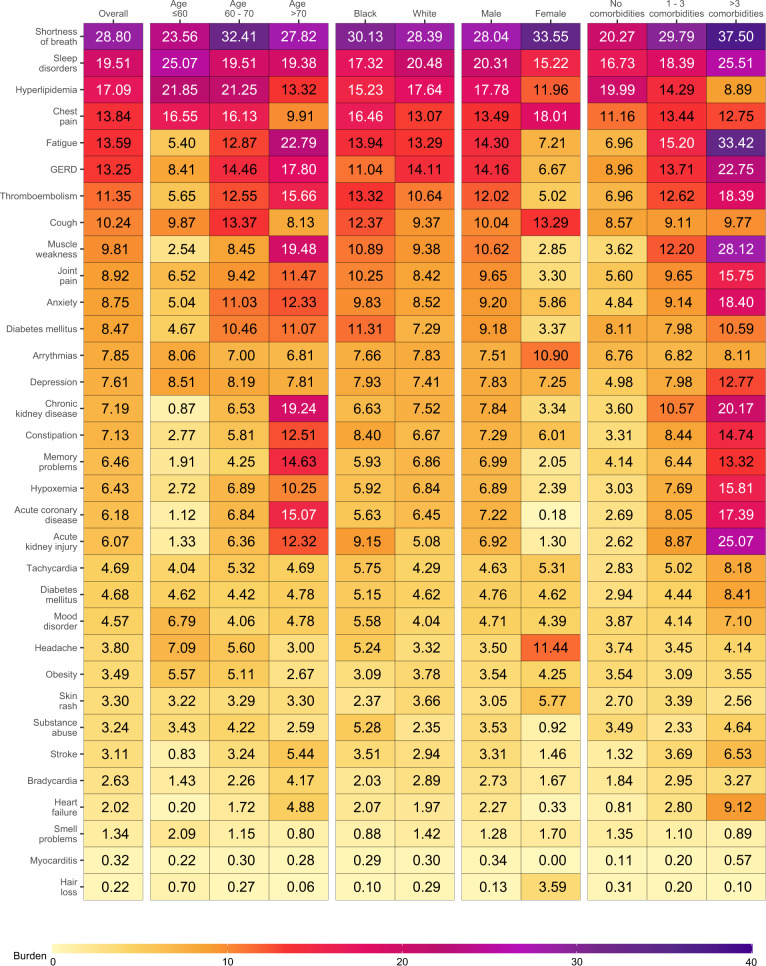
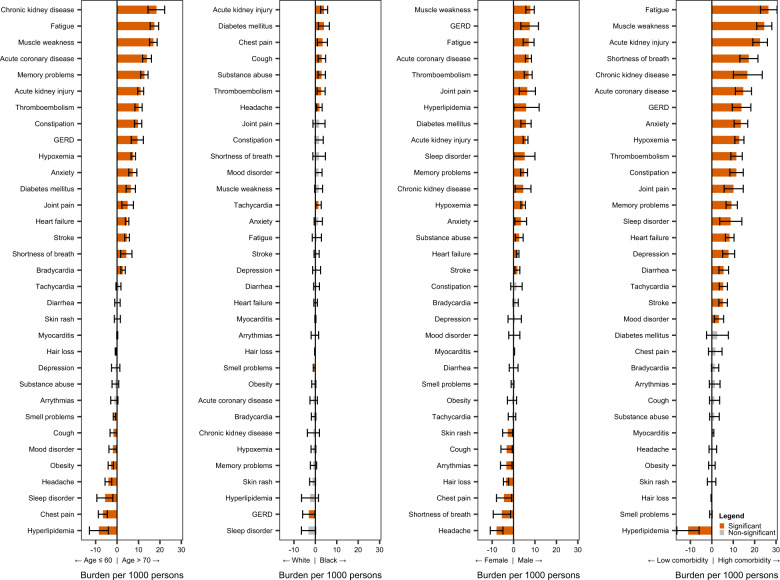
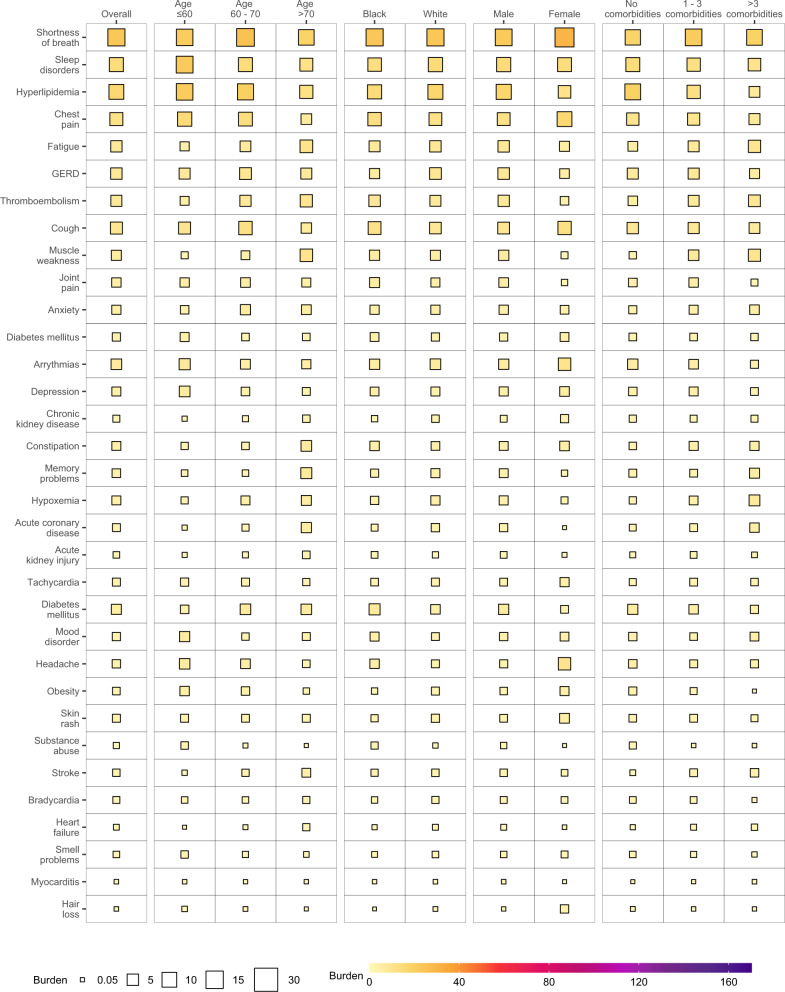
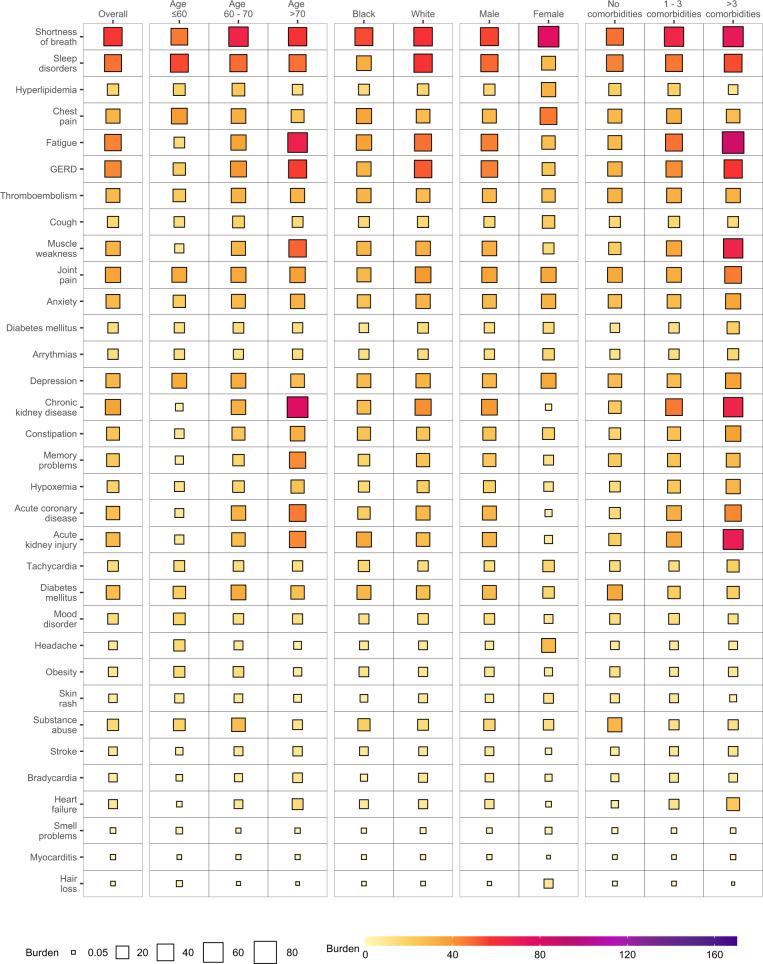
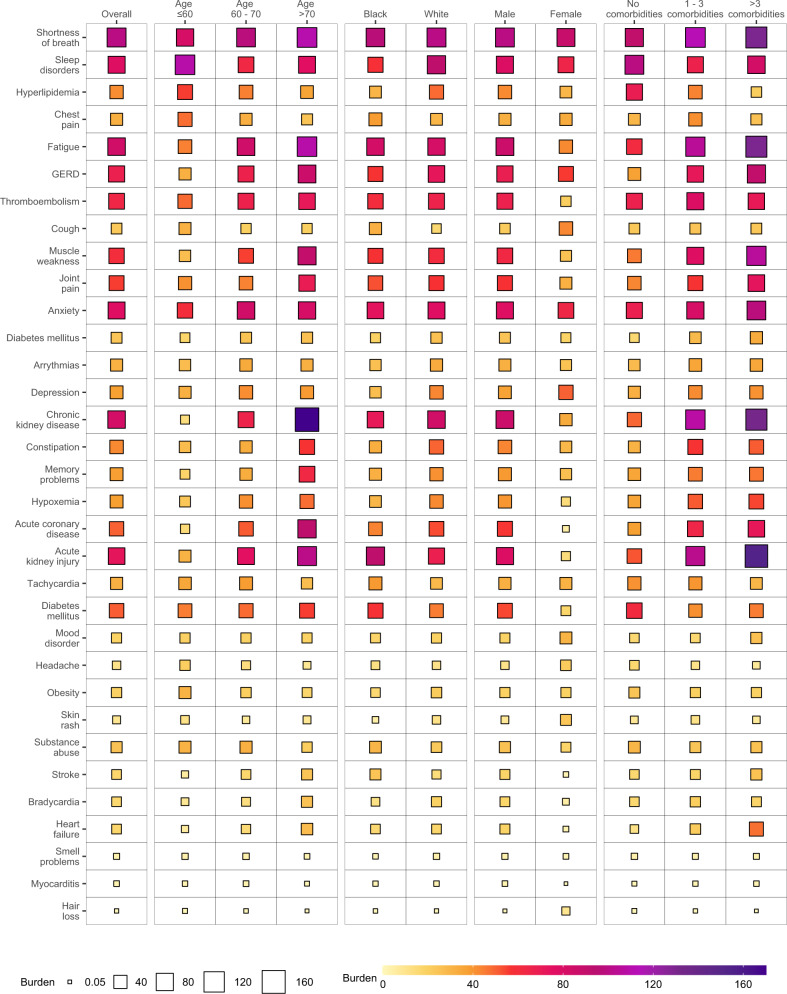
The Post-Acute Sequelae of SARS-CoV-2 infection (PASC) have been characterized; however, the burden of PASC remains unknown. Here we used the healthcare databases of the US Department of Veterans Affairs to build a cohort of 181,384 people with COVID-19 and 4,397,509 non-infected controls and estimated that burden of PASC-defined as the presence of at least one sequela in excess of non-infected controls-was 73.43 (72.10, 74.72) per 1000 persons at 6 months. Burdens of individual sequelae varied by demographic groups (age, race, and sex) but were consistently higher in people with poorer baseline health and in those with more severe acute infection. In sum, the burden of PASC is substantial; PASC is non-monolithic with sequelae that are differentially expressed in various population groups. Collectively, our results may be useful in informing health systems capacity planning and care strategies of people with PASC.


Conflict of interest statement

The authors declare no competing interests.

Figures

Fig. 1
Fig. 1. Risks and burdens of post-acute sequelae of SARS-CoV-2 infection (PASC).
Organ systems are presented in bolded font. Post-acute sequelae were ascertained from 30 days after infection until the end of follow-up. Hazard ratio and 95% confidence intervals are presented in the left panel and burdens per 1000 COVID-19 patients at 6 months are presented in the right panel; right limit of the bar represents estimated burden and error bars represent the 95% confidence interval. Models were adjusted for age, race, sex, receipt of long-term care, Area Deprivation Index, number of outpatient encounters, number of hospital admissions, number of outpatient prescriptions, number of outpatient serum creatinine measurements, chronic lung disease, cancer, cardiovascular disease, cerebrovascular disease, dementia, diabetes mellitus, hypertension, hyperlipidemia, depression, anxiety, chronic kidney disease, hepatitis C and peripheral artery disease, overweight, obesity, smoking status, Charlson Comorbidity Index, US geographic region, total number of beds, number of COVID-19 tests administered, COVID-19 positivity rate, and average hospital bed occupancy during the week of participant enrollment.
Fig. 2
Fig. 2. Burden of post-acute sequelae of COVID-19 as a function of the number of sequelae.
a Overall cohort (purple), and b by care setting (non-hospitalized (green), hospitalized (orange), and admitted to intensive care (blue) during the acute phase of the infection). Post-acute sequelae were ascertained from 30 days after infection until the end of follow-up. Estimates of burdens per 1000 COVID-19 patients at 6 months are presented; line represent the estimated burden and error bars represent the 95% confidence interval for the corresponding number of sequelae. Models were adjusted for age, race, sex, receipt of long-term care, Area Deprivation Index, number of outpatient encounters, number of hospital admissions, number of outpatient prescriptions, number of outpatient serum creatinine measurements, chronic lung disease, cancer, cardiovascular disease, cerebrovascular disease, dementia, diabetes mellitus, hypertension, hyperlipidemia, depression, anxiety, chronic kidney disease, hepatitis C and peripheral artery disease, overweight, obesity, smoking status, Charlson Comorbidity Index, US geographic region, total number of beds, number of COVID-19 tests administered, COVID-19 positivity rate, and average hospital bed occupancy during the week of participant enrollment.
Fig. 3
Fig. 3. Burden of post-acute sequelae of COVID-19 in the overall cohort and by age, race, sex, and health status.
Post-acute sequelae were ascertained from 30 days after infection until the end of follow-up. Estimates of burdens per 1000 COVID-19 patients at 6 months are presented. Models were adjusted for age, race, sex, receipt of long-term care, Area Deprivation Index, number of outpatient encounters, number of hospital admissions, number of outpatient prescriptions, number of outpatient serum creatinine measurements, chronic lung disease, cancer, cardiovascular disease, cerebrovascular disease, dementia, diabetes mellitus, hypertension, hyperlipidemia, depression, anxiety, chronic kidney disease, hepatitis C and peripheral artery disease, overweight, obesity, smoking status, Charlson Comorbidity Index, US geographic region, total number of beds, number of COVID-19 tests administered, COVID-19 positivity rate, and average hospital bed occupancy during the week of participant enrollment when appropriated.
Fig. 4
Fig. 4. Differences in burden of individual post-acute sequelae of COVID-19 by age, race, sex, and health status.
Differences in burden per 1000 COVID-19 patients at 6 months are presented along with 95% confidence intervals.
Fig. 5
Fig. 5. Burden of post-acute sequelae of COVID-19 in the overall cohort and by age, race, sex, and health status in non-hospitalized COVID-19.
Estimates of burdens per 1000 COVID-19 patients at 6 months are presented. The size of the square represents the burden within each care setting. The intensity of color from light yellow to deep purple represents the range of burdens across care settings. Models adjusted for age, race, sex, receipt of long-term care, Area Deprivation Index, number of outpatient encounters, number of hospital admissions, number of outpatient prescriptions, number of outpatient serum creatinine measurements, chronic lung disease, cancer, cardiovascular disease, cerebrovascular disease, dementia, diabetes mellitus, hypertension, hyperlipidemia, depression, anxiety, chronic kidney disease, hepatitis C and peripheral artery disease, overweight, obesity, smoking status, Charlson Comorbidity Index, US geographic region, total number of beds, number of COVID-19 tests administered, COVID-19 positivity rate, and average hospital bed occupancy during the week of participant enrollment when appropriated.
Fig. 6
Fig. 6. Burden of post-acute sequelae of COVID-19 in the overall cohort and by age, race, sex, and health status in hospitalized COVID-19.
Estimates of burdens per 1000 COVID-19 patients at 6 months are presented. The size of the square represents the burden within each care setting. The intensity of color from light yellow to deep purple represents the range of burdens across care settings. Models adjusted for age, race, sex, receipt of long-term care, Area Deprivation Index, number of outpatient encounters, number of hospital admissions, number of outpatient prescriptions, number of outpatient serum creatinine measurements, chronic lung disease, cancer, cardiovascular disease, cerebrovascular disease, dementia, diabetes mellitus, hypertension, hyperlipidemia, depression, anxiety, chronic kidney disease, hepatitis C and peripheral artery disease, overweight, obesity, smoking status, Charlson Comorbidity Index, US geographic region, total number of beds, number of COVID-19 tests administered, COVID-19 positivity rate, and average hospital bed occupancy during the week of participant enrollment when appropriated.
Fig. 7
Fig. 7. Burden of post-acute sequelae of COVID-19 in the overall cohort and by age, race, sex, and health status in COVID-19 patients admitted to intensive care.
Estimates of burdens per 1000 COVID-19 patients at 6 months are presented. The size of the square represents the burden within each care setting. The intensity of color from light yellow to deep purple represents the range of burdens across care settings. Models adjusted for age, race, sex, receipt of long-term care, Area Deprivation Index, number of outpatient encounters, number of hospital admissions, number of outpatient prescriptions, number of outpatient serum creatinine measurements, chronic lung disease, cancer, cardiovascular disease, cerebrovascular disease, dementia, diabetes mellitus, hypertension, hyperlipidemia, depression, anxiety, chronic kidney disease, hepatitis C and peripheral artery disease, overweight, obesity, smoking status, Charlson Comorbidity Index, US geographic region, total number of beds, number of COVID-19 tests administered, COVID-19 positivity rate, and average hospital bed occupancy during the week of participant enrollment when appropriated.

References

    1. Al-Aly, Z., Xie, Y. & Bowe, B. High-dimensional characterization of post-acute sequelae of COVID-19. Nature594, 259–264 (2021). - PubMed
    1. WHO. In the Wake of the Pandemic: Preparing for Long COVID (World Health Organization, 2021). - PubMed
    1. Greenhalgh T, Knight M, A’Court C, Buxton M, Husain L. Management of post-acute covid-19 in primary care. BMJ. 2020;370:m3026. doi: 10.1136/bmj.m3026. - DOI - PubMed
    1. Ayoubkhani D, et al. Post-covid syndrome in individuals admitted to hospital with covid-19: retrospective cohort study. BMJ. 2021;372:n693. doi: 10.1136/bmj.n693. - DOI - PMC - PubMed
    1. Dennis A, et al. Multiorgan impairment in low-risk individuals with post-COVID-19 syndrome: a prospective, community-based study. BMJ Open. 2021;11:e048391. doi: 10.1136/bmjopen-2020-046311. - DOI - PMC - PubMed

Publication types

MeSH terms