. 2021 Nov 12;12(1):6558.
doi: 10.1038/s41467-021-26879-4.

An integrative proteomics method identifies a regulator of translation during stem cell maintenance and differentiation

Affiliations

An integrative proteomics method identifies a regulator of translation during stem cell maintenance and differentiation

Pierre Sabatier et al. Nat Commun. .

Abstract

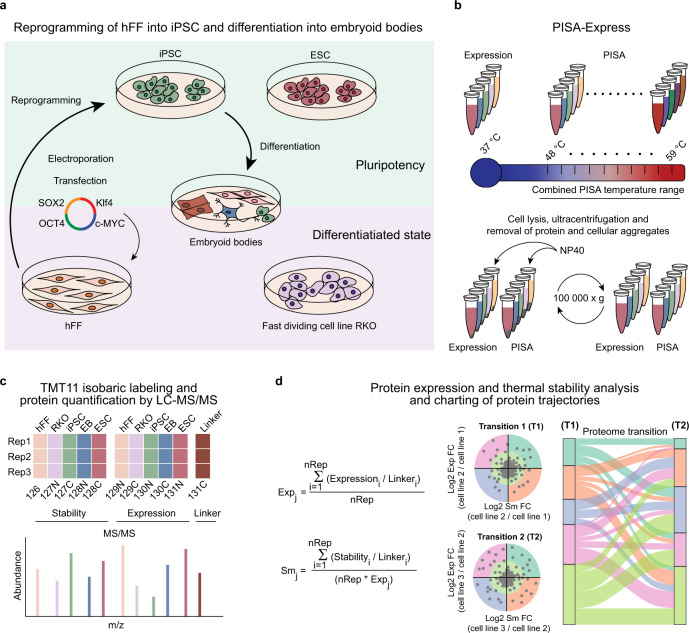
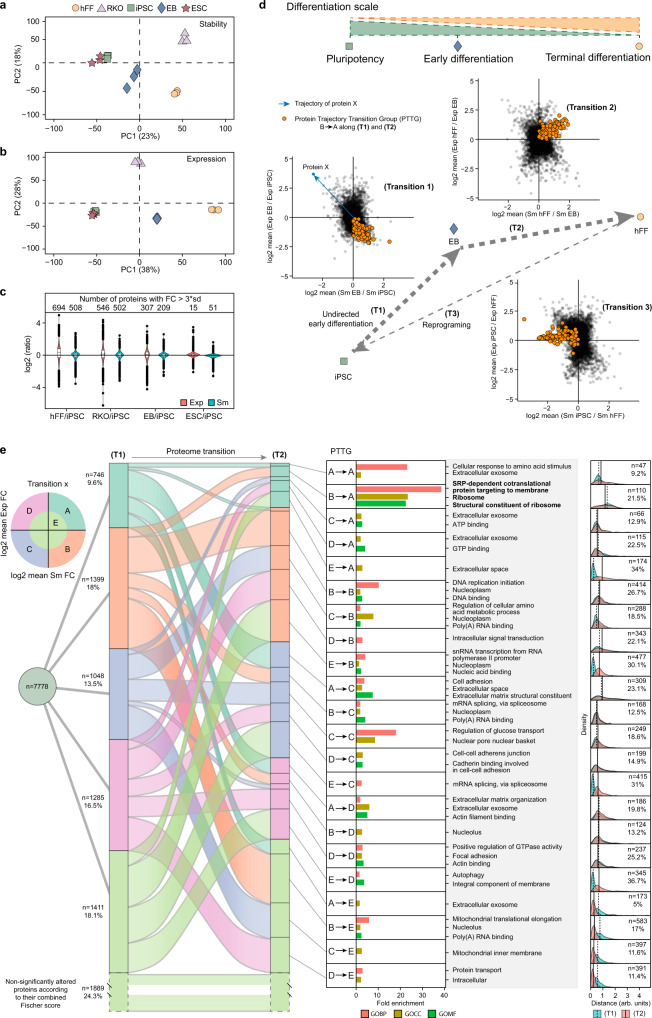
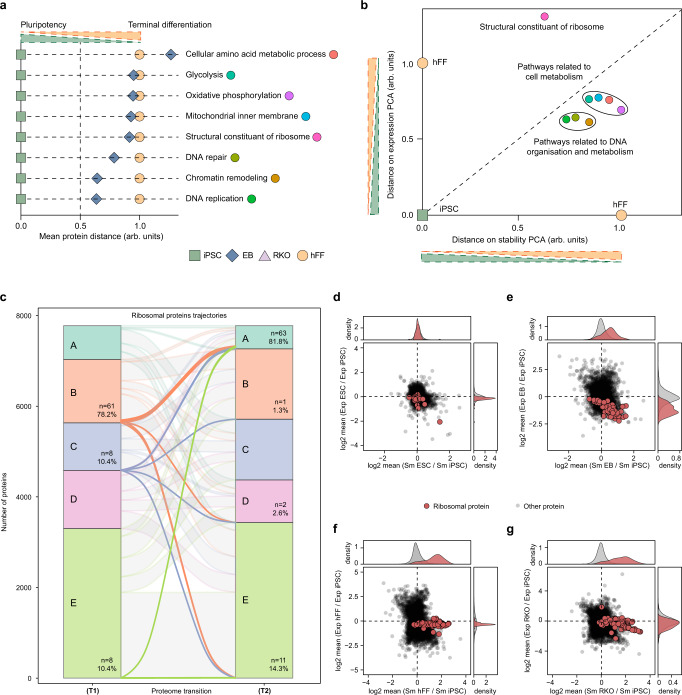
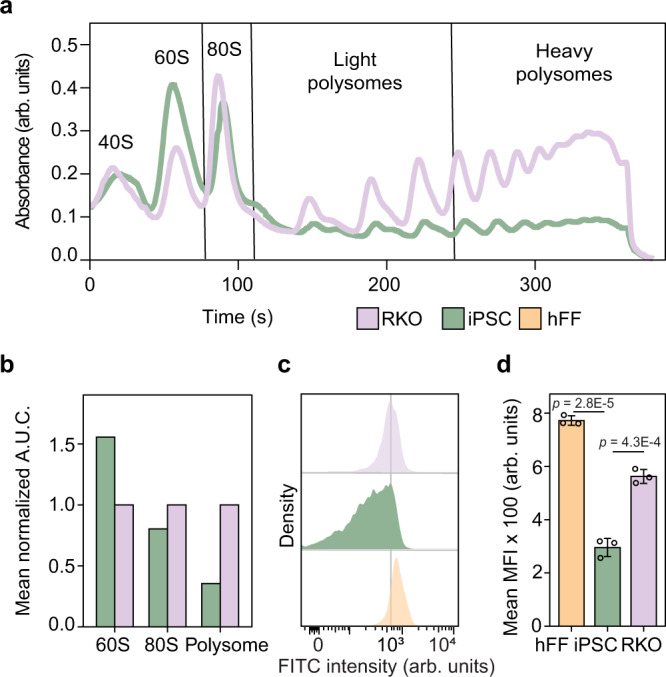
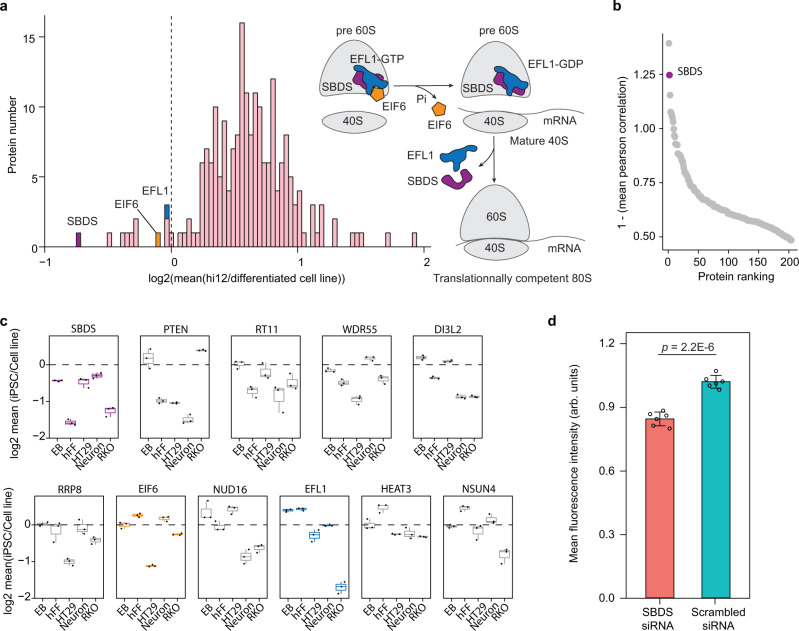
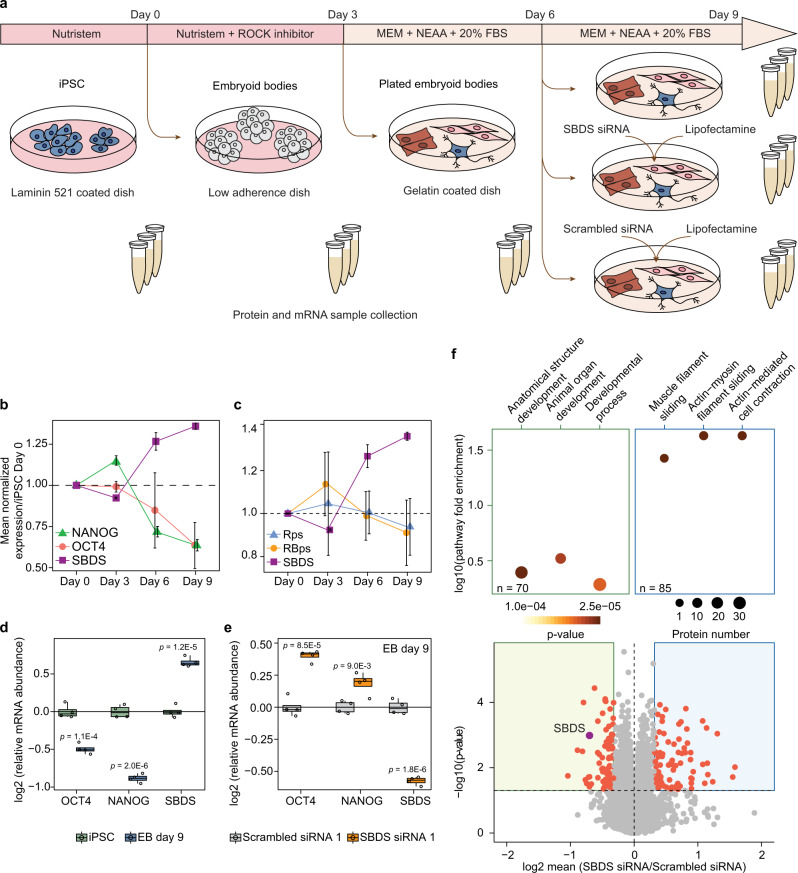
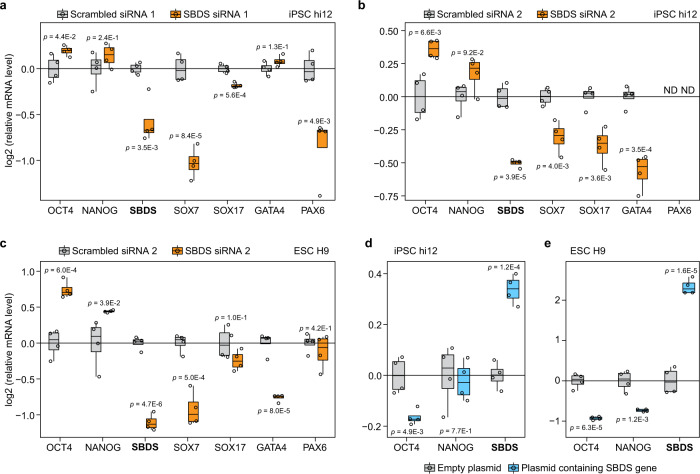
Detailed characterization of cell type transitions is essential for cell biology in general and particularly for the development of stem cell-based therapies in regenerative medicine. To systematically study such transitions, we introduce a method that simultaneously measures protein expression and thermal stability changes in cells and provide the web-based visualization tool ProteoTracker. We apply our method to study differences between human pluripotent stem cells and several cell types including their parental cell line and differentiated progeny. We detect alterations of protein properties in numerous cellular pathways and components including ribosome biogenesis and demonstrate that modulation of ribosome maturation through SBDS protein can be helpful for manipulating cell stemness in vitro. Using our integrative proteomics approach and the web-based tool, we uncover a molecular basis for the uncoupling of robust transcription from parsimonious translation in stem cells and propose a method for maintaining pluripotency in vitro.


Conflict of interest statement

The authors declare no competing interests.

Figures

Fig. 1
Fig. 1. Protein thermal stability and expression changes in cell-type transitions.
a Cells of different types in were grown simultaneously (n = 3 biologically independent samples per cell type). b Cells were collected and heated in a narrow temperature range, with one sample incubated at 37 °C for expression measurements, protein aggregates were eliminated by ultracentrifugation and the soluble proteins were digested. c 1/10 portions of each sample were integrated into a pooled sample and digests were labelled by TMT11 and multiplexed. d The same pooled sample was used in all multiplexed sets for normalization or reporter ion abundances PISA parameter (Sm) and expression fold change (Exp) were calculated, and protein trajectories during cell transitions were charted using a Sankey diagram.
Fig. 2
Fig. 2. Charting protein trajectories during cell-type transitions using combined protein stability and expression analysis.
a PCA plot of protein stability (Sm) in hi12 iPSC, H9 ESC, EB, hFF, and RKO cells. b PCA plot of protein expression (Exp) in each cell type. c Violin plots showing the distribution of Sm and Exp FC of each cell line against iPSC and number of proteins with a log2 fold change (FC) in stability and expression exceeding three standard deviations in each cell line compared to iPSC. Horizonal line in the boxplots represent the median, 25th and 75th percentiles and whiskers represent measurements to the 5th and 95th percentiles. d Protein trajectories during cell-type transitions were defined as positions in a 2D plot of log2 of FCs for Sm and Exp compared to the original type. Transition (T1) was from pluripotency (iPSC) to early differentiation (EB), and (T2) from EB to terminal differentiation (hFF). e Sankey diagram based on assigning to a significant sector (A–D) a protein trajectory in (T1) and (T2) when the combined p-value for changes in stability and expression was <0.05, and to an insignificant sector E otherwise. Each protein trajectory transition group (PTTG) of proteins undergoing transition from a sector X in (T1) to a sector Y in (T2) (25 PTTGs in total) was submitted to a Gene Ontology (GO) enrichment analysis with all quantified proteins as background. For each sector in PTTG, the density distribution of the distances on the 2D plot in (T1) and (T2) is plotted and the percentage of proteins transiting from any sector in T1 to sector Y is calculated, and their number is given. Source data are provided as a Source Data file.
Fig. 3
Fig. 3. ProteoTracker determines timing for molecular events and shows that ribosome is the most affected protein complex during differentiation of PSCs.
a Differentiation scale determined by the mean distances on T1 and T3 normalized by T3 for selected pathways in iPSC, EB, and hFF. b Differentiation scale determined by distances to iPSC on PCA of the mean Sm and Exp of proteins in each selected pathway in iPSC, hFF, and EB normalized by the distance between hFF and iPSC. c ProteoTracker analysis of ribosomal proteins trajectories in transitions (T1) and (T2). dg Two-dimensional plots of mean Sm and Exp FCs in H9 ESC, EB, hFF, and RKO against hi12 iPSC. Source data are provided as a Source Data file.
Fig. 4
Fig. 4. iPSCs have lower polysome content and protein synthesis rate than differentiated cells.
a Ribosome density profile on a 10–50% sucrose gradient of hi12 iPSC lysates against that of RKO cells. b Analysis of the area under the curve (A.U.C.) of several fractions of the ribosome profile (n = 2 biologically independent samples). c Measurement of OPPuro incorporation in hi12 iPSC, hFF, and RKO. The gating strategy is described in Supplementary Fig. 6k. d Analysis of mean fluorescence intensity (MFI) from OPPuro incorporation in hi12 cells, hFFs and RKO cells (n = 3 biologically independent samples for each cell line). P-values were calculated using a two-sided Student t-test. p < 0.05 were considered as significant. Error bars represent ±the standard deviation of the mean. Source data are provided as a Source Data file.
Fig. 5
Fig. 5. SBDS controls protein synthesis rate in iPSCs.
a Expression of proteins involved in ribosome biogenesis in hi12 iPSCs compared to that in parental hFFs, EBs, and neuronal cells differentiated from hi12 iPSCs, HT29, and RKO cells (n = 3 biologically independent samples). b Ranking of all ribosome biogenesis factors according to the reversed mean correlation of their expression against each other individual ribosome biogenesis factors’ expression in all the cell lines mentioned above. c Expression of the ten most downregulated ribosome biogenesis factors in each cell line compared to that in hi12 iPSC. Boxplots of SBDS, EIF6, and EFL1 proteins are colored in purple, orange, and blue, respectively, while other proteins are colored in gray (n = 3 biologically independent samples). Horizonal line in the boxplots represent the median, 25th and 75th percentiles and whiskers represent measurements to the 5th and 95th percentiles. d OPPuro incorporation measurement in SBDS siRNA and scrambled siRNA (control) treated hFFs 3 days after the treatment, data were normalized to the mean fluorescence intensity in the scrambled siRNA control (n = 6 biologically independent samples). Error bars represent ±the standard deviation of the mean. P-values were calculated using a two-sided Student t-test. p < 0.05 were considered as significant. Source data are provided as a Source Data file.
Fig. 6
Fig. 6. SBDS protein is involved in differentiation and pluripotency maintenance in PSCs.
a Schematic representation of PSCs differentiation into EBs and subsequent SBDS siRNA and scrambled siRNA treatments. b Protein expression of SBDS, OCT4, and NANOG in EBs at different days of their induction normalized to that in hi12 iPSCs at day 0. c Expression of SBDS protein, mean ribosomal proteins expression (Rps) and mean expression of proteins involved in ribosome biogenesis (RBps) encompassing 81 and 237 unique proteins, respectively, in EBs normalized to that in hi12 cells at day 0. Error bars represent ±the standard deviation of the mean. d Relative abundance of SBDS, OCT4, and NANOG mRNAs after nine days (D9) of EBs induction versus that in day 0 (D0) hi12 cells measured using qRT-PCR. e Relative abundance of SBDS, OCT4, and NANOG mRNAs in day 9 EBs after three days of SBDS siRNA and scrambled siRNA treatments. f Relative protein abundance in day 9 EBs after 3 days of SBDS siRNA treatment versus that in the day 9 EBs treated with scrambled siRNA (control); and top three most significantly up or downregulated pathways according to GO annotation (P < 0.05 and relative expression <0.8 or >1.25) (n = 3 biologically independent samples). P-values were calculated using Welsh’s t-test for proteomics experiment and using a two-sided Student t-test for qRT-PCR. p < 0.05 were considered as significant. Horizonal line in the boxplots represent the median, 25th and 75th percentiles and whiskers represent measurements to the 5th and 95th percentiles. n = 3 biologically independent samples for proteomics experiments and n = 4 biologically independent samples for qRT-PCR data. Source data are provided as a Source Data file.
Fig. 7
Fig. 7. SBDS knockdown promotes maintenance of pluripotency and knockin decreases expression of pluripotency markers in PSCs.
Relative mRNAs abundance of pluripotency (OCT4 and NANOG) and lineage specific markers (SOX7, SOX17, GATA4, and PAX6) after 3 days of scrambled siRNA 1 and SBDS siRNA 1 treatments (a) or scrambled siRNA and SBDS siRNA 2 treatments (b) in iPSCs hi12 and scrambled siRNA 2 and SBDS siRNA 2 treatments in ESCs H9 (c) grown on Geltrex™. Relative mRNAs abundance of pluripotency markers (OCT4 and NANOG) after knockin of SBDS protein in hi12 (d) and H9 (e). Horizonal line in the boxplots represent the median, 25th and 75th percentiles and whiskers represent measurements to the 5th and 95th percentiles. ND nondetected. P-values were calculated using a two-sided Student t-test. p < 0.05 were considered as significant. n = 4 biologically independent samples for all experiments. Source data are provided as a Source Data file.

References

    1. Panina Y, Karagiannis P, Kurtz A, Stacey GN, Fujibuchi W. Human Cell Atlas and cell-type authentication for regenerative medicine. Exp. Mol. Med. 2020;52:1443–1451. - PMC - PubMed
    1. Samsonraj RM, et al. Concise review: multifaceted characterization of human mesenchymal stem cells for use in regenerative medicine. Stem Cells Transl. Med. 2017;6:2173–2185. - PMC - PubMed
    1. Zhang J, et al. Functional characterization of human pluripotent stem cell-derived arterial endothelial cells. Proc. Natl Acad. Sci. USA. 2017;114:E6072–E6078. - PMC - PubMed
    1. McCarthy N, Kraiczy J, Shivdasani RA. Cellular and molecular architecture of the intestinal stem cell niche. Nat. Cell Biol. 2020;22:1033–1041. - PubMed
    1. Feng Y, et al. Global analysis of protein structural changes in complex proteomes. Nat. Biotechnol. 2014;32:1036–1044. - PubMed

Publication types