. 2021 Nov 12;12(1):6561.
doi: 10.1038/s41467-021-26811-w.

WRN helicase safeguards deprotected replication forks in BRCA2-mutated cancer cells

Affiliations

WRN helicase safeguards deprotected replication forks in BRCA2-mutated cancer cells

Arindam Datta et al. Nat Commun. .

Abstract

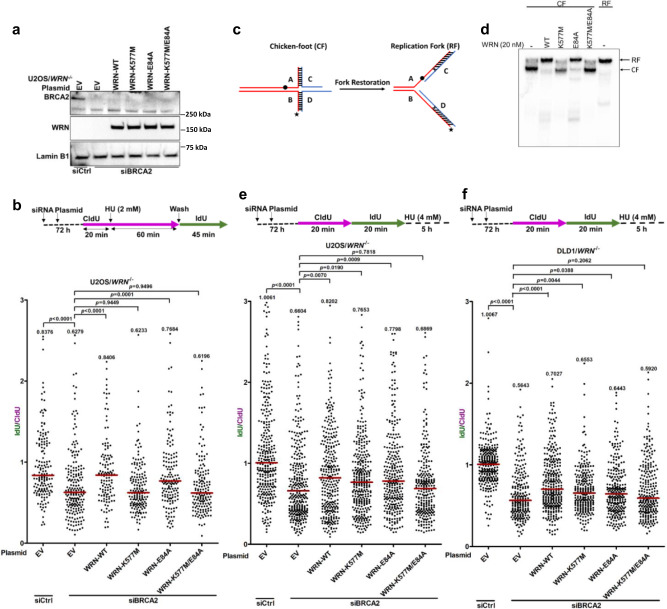
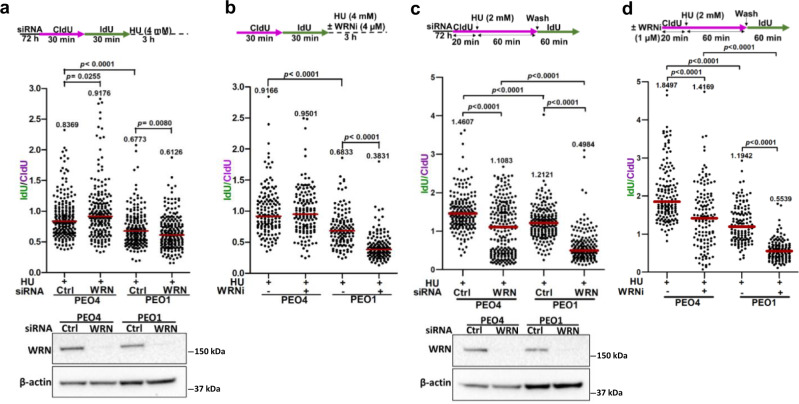
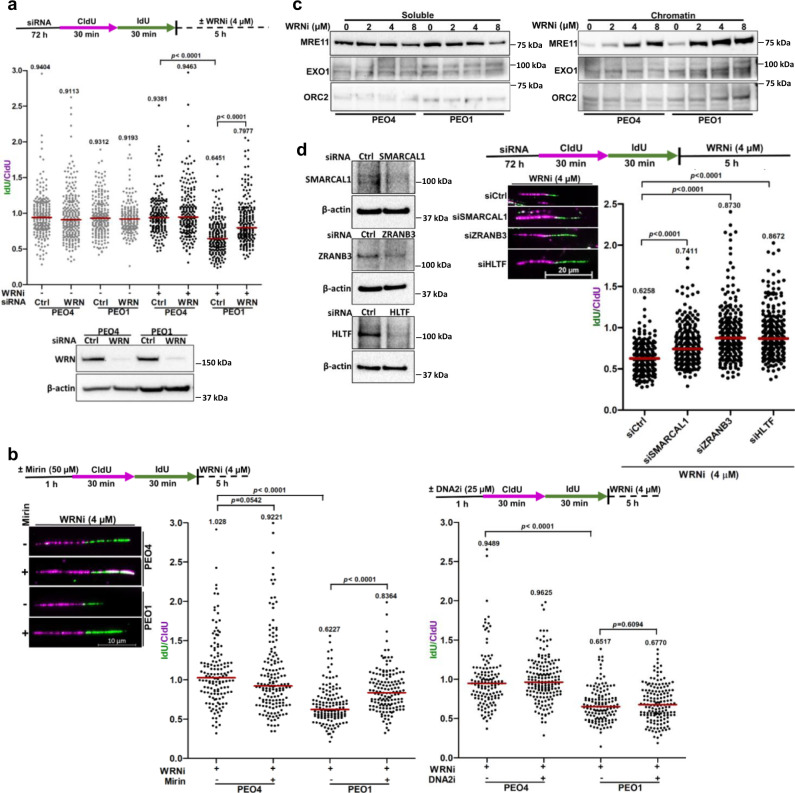
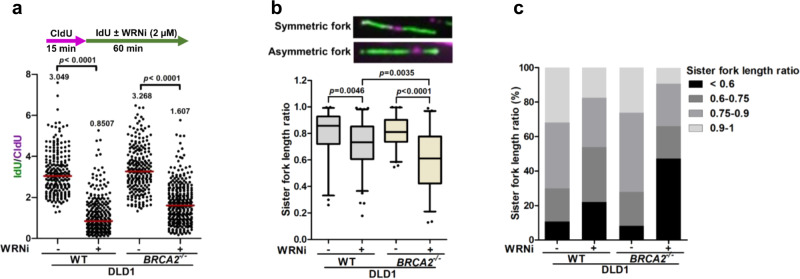
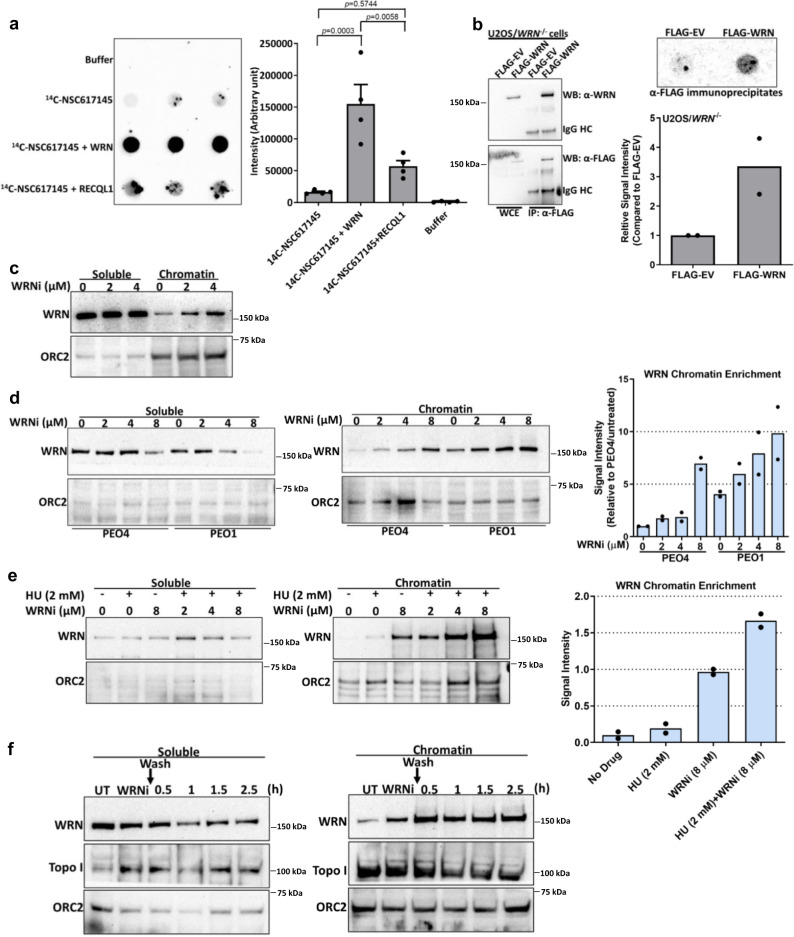
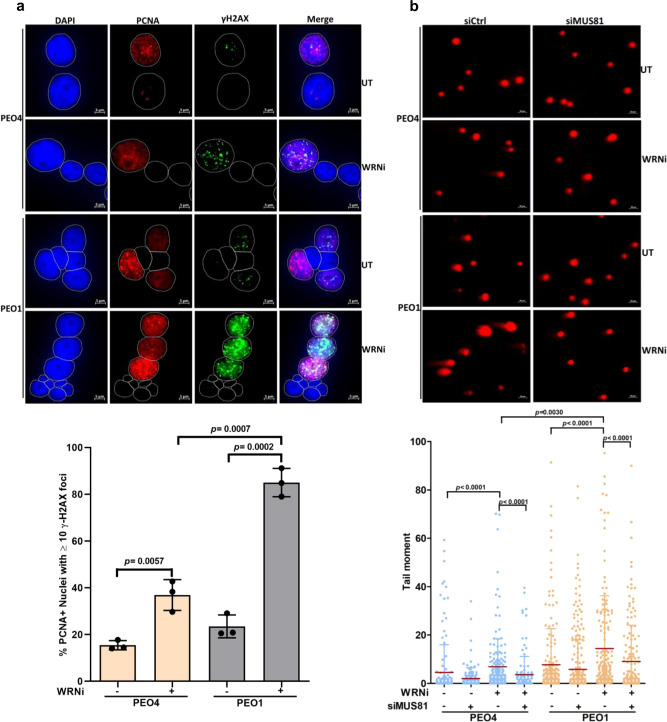
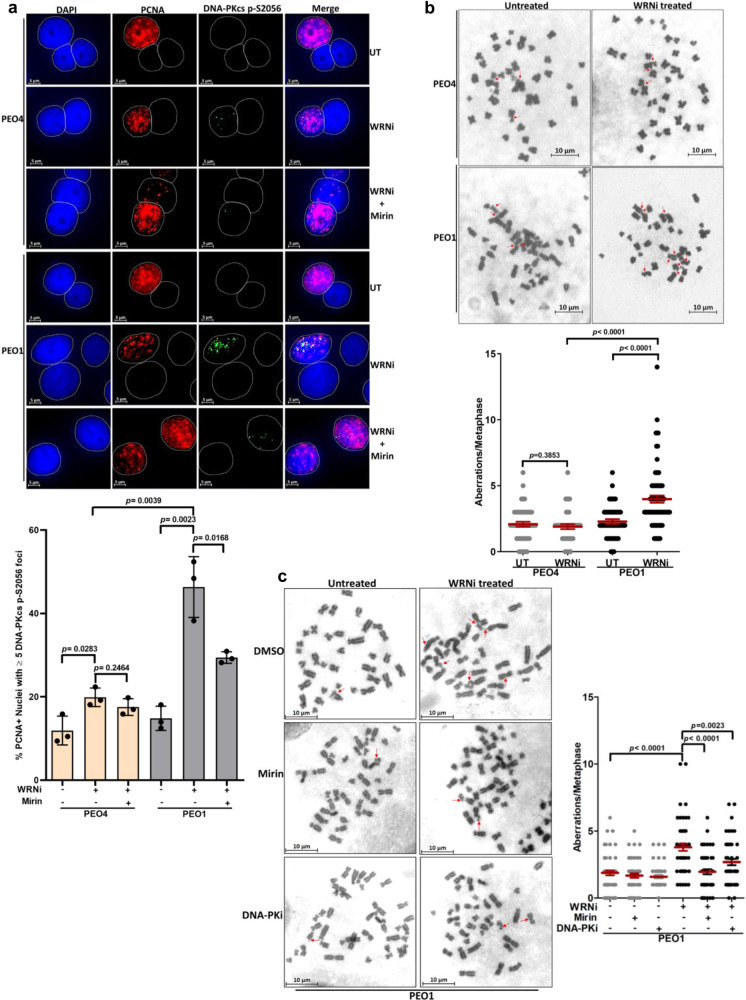
The tumor suppressor BRCA2 protects stalled forks from degradation to maintain genome stability. However, the molecular mechanism(s) whereby unprotected forks are stabilized remains to be fully characterized. Here, we demonstrate that WRN helicase ensures efficient restart and limits excessive degradation of stalled forks in BRCA2-deficient cancer cells. In vitro, WRN ATPase/helicase catalyzes fork restoration and curtails MRE11 nuclease activity on regressed forks. We show that WRN helicase inhibitor traps WRN on chromatin leading to rapid fork stalling and nucleolytic degradation of unprotected forks by MRE11, resulting in MUS81-dependent double-strand breaks, elevated non-homologous end-joining and chromosomal instability. WRN helicase inhibition reduces viability of BRCA2-deficient cells and potentiates cytotoxicity of a poly (ADP)ribose polymerase (PARP) inhibitor. Furthermore, BRCA2-deficient xenograft tumors in mice exhibited increased DNA damage and growth inhibition when treated with WRN helicase inhibitor. This work provides mechanistic insight into stalled fork stabilization by WRN helicase when BRCA2 is deficient.


Conflict of interest statement

The authors declare no competing interests.

Figures

Fig. 1
Fig. 1. WRN helicase rescues fork restart defects and restrains hyper-degradation of stalled forks in BRCA2-deficient cells.
a Immunoblots showing BRCA2 and WRN protein levels in BRCA2-depleted U2OS/WRN−/− cells transfected with the indicated plasmids. b Fork restart assay in BRCA2-depleted U2OS/WRN−/− cells complemented with WT or catalytic dead WRN. Scatter plot showing IdU/CldU ratios in individual experimental conditions. Representative of n = 2 independent experiments; p-values (p < 0.0001, p < 0.0001, p = 0.9449, p = 0.0001, p = 0.9496) were derived from n ≥ 125 DNA fibers using two-tailed Mann–Whitney test. c Schematic of the in vitro fork restoration assay showing “chicken-foot” (CF) and replication fork (RF) structures. Star indicates radiolabeled ([γ-32P] ATP) at 5´ DNA end. The black dot indicates the approximate position of an isocytosine base paired with a guanine on the opposite strand whereas the 2 X’s in the RF indicate mismatched bases. Both modifications serve to minimize spontaneous conversion of the CF to the RF structure. d WRN ATPase/helicase activity catalyzes replication fork restoration in vitro. Fork restoration assay with 2 nM CF DNA substrate was performed using 20 nM of WT or catalytic mutant WRN proteins (lanes 2-5). Reactions using CF (lane 1) and RF (lane 6) substrates without WRN were used as negative and positive controls, respectively. Experiment was repeated three (n = 3) times with similar results. e, Quantification of fork stability assay performed in cells as described in a. Representative of n = 3 independent experiments; p-values (p < 0.0001, p = 0.0070, p = 0.0190, p = 0.0009, p = 0.7818) were derived from n ≥ 250 DNA fibers using two-tailed Mann–Whitney test. f, Quantification of fork stability assay performed in BRCA2-depleted DLD1/WRN−/− cells upon complementation with WT or catalytic dead WRN. Representative of n = 2 independent experiments; p-values (p < 0.0001, p < 0.0001, p = 0.0044, p = 0.0388, p = 0.2062) were derived from n ≥ 230 DNA fibers using two-tailed Mann–Whitney test. In b, e, and f, horizontal red bars indicate median of IdU/CldU ratios; median IdU/CldU values are indicated; purple and green colors indicate CldU and IdU labeling, respectively; data points within the specified axis limits are shown. Lamin B1 was used as loading control in immunoblots. Western blots (a) were repeated independently at least two times with similar results. Source data are provided as a Source Data file.
Fig. 2
Fig. 2. WRN helicase inhibition causes increased fork degradation and replication restart defects in BRCA2-mutated cancer cells.
a (Upper panel) Schematic of the fork stability assay performed in PEO1 and PEO4 cells upon WRN knockdown. (Lower panel) Scatter dot plot showing quantification of IdU/CldU ratios in individual experimental conditions. Representative of n = 3 independent experiments; p-values (p = 0.0255, p < 0.0001, p = 0.0080) were derived from n ≥ 200 DNA fibers using two-tailed Mann–Whitney test. Knockdown of WRN was verified by immunoblotting. b (Upper panel) Schematic of the fork degradation experiment in PEO1 and PEO4 cells upon WRNi treatment. (Lower panel) Graphical quantification of the results obtained from the fork stability experiments as described above. Representative of n = 2 independent experiments; p-values (p < 0.0001, p < 0.0001) were derived from n ≥ 125 DNA fibers using two-tailed Mann–Whitney test. c (Upper panel) Scheme of the fork restart assay performed in PEO1 and PEO4 cells upon siRNA-mediated knockdown of WRN. (Lower panel) Scatter plot showing IdU/CldU ratios in individual experimental conditions. Representative of n = 2 independent experiments; p-values (p < 0.0001, p < 0.0001, p < 0.0001, p < 0.0001) were derived from n ≥ 195 DNA fibers using two-tailed Mann–Whitney test. Immunoblots showing relative knockdown levels of WRN as assessed 72 h post-transfection. d, (Upper panel) Schematic of the fork restart assay in HU-treated PEO1 and PEO4 cells upon WRN helicase inhibition. (Lower panel) Scatter plot showing IdU/CldU tract length ratios in individual experimental conditions. Representative of n = 2 independent experiments; p-values (p < 0.0001, p < 0.0001, p < 0.0001, p < 0.0001) were derived from n ≥ 125 DNA fibers using two-tailed Mann–Whitney test. Horizontal red bars in scatter plots indicate the median of IdU/CldU ratios; median IdU/CldU values are indicated; purple and green colors indicate CldU and IdU labeling, respectively; data points within the specified axis limits are shown. β-actin was used as a loading control in immunoblots in (a) and (c). Western blots a, c were repeated independently at least two times with similar results. Source data are provided as a Source Data file.
Fig. 3
Fig. 3. WRN helicase inhibition triggers SNF2 translocase-dependent nascent DNA degradation by MRE11 nuclease in BRCA2-mutated cancer cells.
a Fork stability assay in PEO1 and PEO4 cells exposed to WRNi NSC617145. Cells transfected with either control or WRN siRNA (80 nM) were sequentially labeled with CldU and IdU and subjected to WRNi (NSC617145) treatment (4 µM) for 5 h. For untreated control, cells were collected immediately after labeling. Scatter plot showing IdU/CldU tract length ratios in individual experimental conditions. Representative of n = 2 independent experiments; p-values (p < 0.0001, p < 0.0001) were derived from n ≥ 150 DNA fibers using two-tailed Mann–Whitney test. Immunoblots showing WRN knockdown. b Fork stability assay in NSC617145-treated PEO1 and PEO4 cells upon Mirin (left panel) or DNA2i (right panel) treatment. Representative fibers of the Mirin experiment are shown. Representative of n = 2 independent experiments; p-values (p = 0.0542, p < 0.0001, p < 0.0001, p < 0.0001, p = 0.6094) were derived from n ≥ 125 DNA fibers using two-tailed Mann–Whitney test. c Immunoblots showing dose-dependent chromatin enrichment of MRE11 upon WRNi treatment. Cells were treated with indicated doses of WRNi (NSC617145) for 1 h and subjected to subcellular fractionation. EXO1 level is shown. ORC2 was used as a positive marker and loading control for chromatin fractions. d Fork stability assay in PEO1 cells depleted of SMARCAL1, ZRANB3, or HLTF upon NSC617145 treatment. (Left panel) Immunoblots showing knockdown. Representative DNA fibers are shown. (Right panel) Quantification of IdU/CldU ratios in individual experimental conditions. Representative of n = 2 independent experiments; p-values (p < 0.0001, p < 0.0001, p < 0.0001) were derived from n ≥ 250 DNA fibers using two-tailed Mann–Whitney test. In a, b, and d horizontal red bars indicate the median of IdU/CldU ratios; median IdU/CldU values are indicated; purple and green colors indicate CldU and IdU labeling, respectively. β-actin was used as a loading control in immunoblots in (a) and (d). Western blots a, c, d were repeated independently at least two times with similar results. Source data are provided as a Source Data file.
Fig. 4
Fig. 4. WRN helicase inhibitor causes replication fork stalling.
a (Upper panel) Schematic of the fork progression assay in WT and BRCA2−/− DLD1 cells upon WRNi treatment. (Lower panel) Scatter dot plot showing IdU/CldU ratios in individual genotypes treated or untreated with the WRNi. Representative of n = 3 independent experiments; p-values (p < 0.0001, p < 0.0001) were derived from n ≥ 200 DNA fibers using two-tailed Mann–Whitney test. b (Upper panel) Representative DNA fibers depicting symmetric and asymmetric bi-directional replication forks. Length of the two sister forks (IdU) emanating from a single bidirectional origin (CldU) was measured from individual bidirectional (green-purple-green) fork structures scored from the experiment as described in a. (Lower panel) Boxplot (5–95th percentile) of sister fork (SF) ratios (short to long IdU tract length ratio) in WT and BRCA2−/− DLD1 cells treated or untreated with WRNi. Bounds of the box represent 25th–75th percentile, middle horizontal lines show the median, whiskers indicate 5th–95th percentiles. Representative of n = 3 independent experiments; p-values (p = 0.0046, p = 0.0035, p < 0.0001) were derived from n ≥ 40 bidirectional forks using two-tailed Mann–Whitney test. c Bar graph showing percent distribution of sister fork length ratios. In a, horizontal red bars indicate the median of IdU/CldU ratios; median IdU/CldU values are indicated; purple and green colors indicate CldU and IdU labeling, respectively. Source data are provided as a Source Data File.
Fig. 5
Fig. 5. NSC617145 directly binds WRN and causes WRN trapping on DNA.
a Dot blots showing in vitro binding of radiolabeled 14C-NSC617145 (10 µM) to recombinant WRN or RECQL1 proteins (300 nM). Quantitation of the data obtained from the binding experiments. Data represent mean ± SEM of four repeats. One-way ANOVA with Bonferroni’s multiple comparison test: p = 0.0003, p = 0.0058, p = 0.5744. b 14C-NSC617145 binds to WRN proteins in U2OS cells. Immunoblots showing WRN protein levels in whole-cell extract and α-FLAG immunoprecipitates prepared from U2OS/WRN−/− cells transfected with either empty FLAG vector or FLAG-WRN expression plasmids. IgG heavy chains (HC) are shown. α-FLAG immunoprecipitates prepared from 14C-NSC617145 (10 μM) treated cells were subjected to dot blot assay. The bar graph represents 14C-NSC617145 signal intensity. Data represent the mean of two independent experiments. c Immunoblots showing WRN chromatin enrichment in PEO1 cells treated with indicated doses of NSC617145 for 3 h. ORC2 was used as a positive marker and loading control for chromatin fractions. The experiment was repeated three times with similar outcomes. d Relative chromatin enrichment of WRN in PEO4 and PEO1 cells upon WRNi treatment for 1 h. Bar graph showing WRN levels in chromatin-bound fractions prepared from PEO4 and PEO1 cells. WRN signal intensity was normalized to ORC2 and represented as relative fold change over PEO4 untreated cells (set as one). Data represent the mean of two independent experiments. e Immunoblots showing enhanced chromatin enrichment of WRN upon NSC617145 exposure in presence of HU. PEO1 cells were treated with indicated doses of NSC617145 with or without HU (2 mM) for 2 h and subjected to sub-cellular fractionation. Bar graph represents quantification of WRN chromatin enrichment. Data represent the mean of two independent experiments. f Persistent trapping of WRN on chromatin by WRNi. PEO1 cells were treated with NSC617145 (6 μM) for 2 h before removal of the drug by ice-cold PBS wash. Cells were incubated further in a pre-warmed cell culture medium for the indicated times. Soluble and chromatin fractions were probed with the indicated antibodies. The experiment was repeated independently two times with similar results. Source data are provided as a Source Data file.
Fig. 6
Fig. 6. WRNi triggers MUS81-dependent double-strand break formation in BRCA2-mutated cancer cells.
a Immunofluorescence staining of γH2AX following treatment of PEO4 and PEO1 cells with WRNi (5 µM) for 6 h. Cells were co-stained with PCNA to identify replicating cells. Nuclei were stained with DAPI. DAPI, PCNA, and γH2AX are shown in blue, red, and green, respectively. Scale bars are shown. Bar graph represents quantification of % PCNA-positive cells with ≥10 γH2AX foci under untreated (UT) and WRNi-treated conditions. Data represent mean ± SD of three independent experiments; two-tailed unpaired t-test; p values are indicated. b Analysis of DSB formation using neutral Comet assay. Control or MUS81-depleted PEO4 and PEO1 cells were subjected to neutral comet assay following treatment with WRNi (5 µM) for 6 h. Representative images of comets obtained from individual experimental conditions are shown. Scale bars are shown. Scatter dot plot showing tail moment in individual samples. Data represent mean ± SD of n ≥ 120 comets analyzed under each condition over n = 2 independent experiments. Mean tail moments (horizontal red bars) ± SD are shown. ≥120 comets were analyzed for each condition using the OpenComet plugin in ImageJ. Two-tailed Mann–Whitney test; p values (p < 0.0001, p < 0.0001, p = 0.0030, p < 0.0001, p < 0.0001) are indicated. Source data are provided as a Source Data file.
Fig. 7
Fig. 7. Elevated nonhomologous end-joining and genomic instability in BRCA2-mutated cancer cells exposed to WRNi.
a Representative immunofluorescence staining of DNA-PKcs p-S2056 foci in PEO4 and PEO1 cells following treatment with WRNi (5 µM) for 16 h. Cells were optionally treated with Mirin (25 µM). Cells were co-stained with PCNA to mark replicating cells. Bar graph represents quantification of % PCNA positive cells with ≥5 DNA-PKcs p-S2056 foci in individual experimental conditions. Data represent mean ± SD of three independent experiments; two-tailed unpaired t-test; p values are indicated. b Representative images of metaphase chromosome spread prepared from PEO1 and PEO4 cells treated or non-treated with WRNi (2 µM) for 48 h. Scatter plot showing relative chromosomal aberrations scored from the cells as described above. Data represent mean ± SEM of n ≥ 40 metaphase spreads analyzed under each condition over n = 3 independent experiments; Two-tailed Mann–Whitney test; p values (p = 0.3853, p < 0.0001, p < 0.0001) are indicated. c Analysis of chromosomal aberrations in BRCA2-mutated PEO1 cells following treatment with WRNi (5 µM) for 16 h. Cells were optionally treated with Mirin (25 µM) or DNA-PK inhibitor (DNA-PKi) NU7441 (10 µM). Quantification of chromosomal aberration analysis is shown. Data represent mean ± SEM of n ≥ 50 metaphase spreads analyzed under each condition over n = 3 independent experiments; Two-tailed Mann–Whitney test; p values (p < 0.0001, p < 0.000, p = 0.0023) are indicated. Structural aberrations including chromatid breaks/gaps, chromosome end-to-end fusions, dicentric and radial chromosomes are indicated by red arrows in b and c. Scale bars are shown in all representative images. In a, DAPI, PCNA, and DNA-PKcs p-S2056 foci are shown in blue, red, and green, respectively. Source data are provided as a Source Data file.
Fig. 8
Fig. 8. WRNi kills BRCA2-deficient cancer cells and retards BRCA2−/− xenograft tumor growth in mice.
a Colony survival of WT and BRCA2−/− DLD1 cells exposed to WRNi (left panel) or olaparib (right panel). WT and BRCA2−/− DLD1 cells were plated on a six-well plate at 1,500/well and exposed to the indicated doses of WRNi or olaparib 4 h after cell seeding. b Line graphs showing relative colony survival of PEO1 and PEO4 cells exposed to increasing doses of WRNi (left panel) or olaparib (right panel). PEO1 and PEO4 cells were plated on a six-well plate at 1,000 cells/well and treated with the indicated doses of WRNi or olaparib 4 h after cell seeding. In a and b, cells were grown in presence of WRNi or olaparib for 12 days before colony staining. Data represent mean ± SD of three independent experiments. c Line graph showing a relative growth rate of BRCA2−/− (upper panel) and WT (lower panel) xenograft tumors in athymic nude mice treated with either drug vehicle or NSC61745. After the tumors reached the palpable size, mice were injected intraperitoneally with either drug vehicle or NSC617145 (25 mg/kg body weight) every alternate day for a total of 14 days. Mean tumor volume ± SD (n = 6) at each time point is shown. Tumor growth inhibition (TGI) is indicated. p-values were determined using two-tailed unpaired Welch’s t-test. d and e Immunohistochemical (IHC) staining for γH2AX (d) and 53BP1 (e) expression in tissue sections obtained from vehicle or NSC617145 treated wild type and BRCA2−/− xenograft tumors. Representative images (×40 magnification) of DAB-stained tissue sections are shown. Scale bar represents 50 µM. Box-whisker plots showing the median integrated density of DAB staining analyzed from n = 5 tumor tissue samples under each condition. Bounds of the box represent 25th–75th percentile, middle horizontal lines show the median, whiskers indicate maximum and minimum values of the dataset; p values were calculated using two-tailed unpaired t-test. Middle horizontal lines of the boxes represent the median. Source data are provided as a Source Data file.
Fig. 9
Fig. 9. WRNi potentiates olaparib cytotoxicity in BRCA2-mutated cancer cells.
a Relative survival (%) of colonies in PEO1 (upper panel) and PEO4 (lower panel) cells treated with either graded concentrations of olaparib only or in combination with 0.25 µM NSC617145. Cells were plated on a six-well plate at 1,000 cells/well and exposed to 0.25 µM WRNi and indicated doses of olaparib 4 h after cell seeding. Cells were allowed to form colonies in presence of the drugs for 12 days. Data represent mean ± SD of three (n = 3) independent experiments. b Coefficient of drug interaction (CDI) for indicated concentrations of olaparib and 0.25 µM NSC617145 as described in a. Dashed lines in the graph represent thresholds for synergism (blue) and significant synergism (red). Data represent mean ± SD of three (n = 3) independent experiments. c Excess over Bliss (EOB) scores obtained from olaparib-NSC617145 Bliss synergy analysis are shown with a color heat map. Survival (%) data from three independent experiments were used to calculate CDI and EOB in b and c, respectively. d and e Schematic model of defective replication restart and fork hyper-degradation induced by WRN loss (d) or targeted WRN helicase inhibition (e) in BRCA2-deficient cancer cells. d Model depicting the involvement of WRN in stabilizing replication forks under the condition of BRCA2 deficiency. BRCA2 deficiency renders reversed forks deprotected and vulnerable to MRE11 nuclease-mediated degradation. Following replication fork stalling, WRN helicase-mediated restoration of reversed forks to active replication forks limits MRE11-mediated uncontrolled nascent strand degradation and ensures fork restart, albeit with reduced efficiency. WRN loss results in increased availability of reversed fork substrates for MRE11-mediated degradation leading to enhanced nascent DNA degradation and severely compromised replication restart under BRCA2-deficient conditions. The yellow light of the traffic signal icon depicts replication stress. e Pharmacological inhibition of WRN helicase causes increased fork stalling induced by chromatin sequestration of WRN, followed by SNF2 translocase-mediated fork reversal and increased chromatin enrichment of MRE11 nuclease. In the absence of BRCA2, forks stalled by static WRN–DNA complexes are subjected to MRE11-mediated extensive degradation resulting in fork collapse, genomic instability, and cell death. Source data are provided as a Source Data file.

References

    1. King MC, Marks JH, Mandell JB. Breast and ovarian cancer risks due to inherited mutations in BRCA1 and BRCA2. Science. 2003;302:643–646. - PubMed
    1. Ashworth A. A synthetic lethal therapeutic approach: poly(ADP) ribose polymerase inhibitors for the treatment of cancers deficient in DNA double-strand break repair. J. Clin. Oncol. 2008;26:3785–3790. - PubMed
    1. Ray Chaudhuri A, et al. Replication fork stability confers chemoresistance in BRCA-deficient cells. Nature. 2016;535:382–387. - PMC - PubMed
    1. Schlacher K, et al. Double-strand break repair-independent role for BRCA2 in blocking stalled replication fork degradation by MRE11. Cell. 2011;145:529–542. - PMC - PubMed
    1. Byrum AK, Vindigni A, Mosammaparast N. Defining and Modulating ‘BRCAness’. Trends Cell Biol. 2019;29:740–751. - PubMed

Publication types

MeSH terms