. 2021 Nov 12;12(1):6549.
doi: 10.1038/s41467-021-26819-2.

Local DNA shape is a general principle of transcription factor binding specificity in Arabidopsis thaliana

Affiliations

Local DNA shape is a general principle of transcription factor binding specificity in Arabidopsis thaliana

Janik Sielemann et al. Nat Commun. .

Abstract

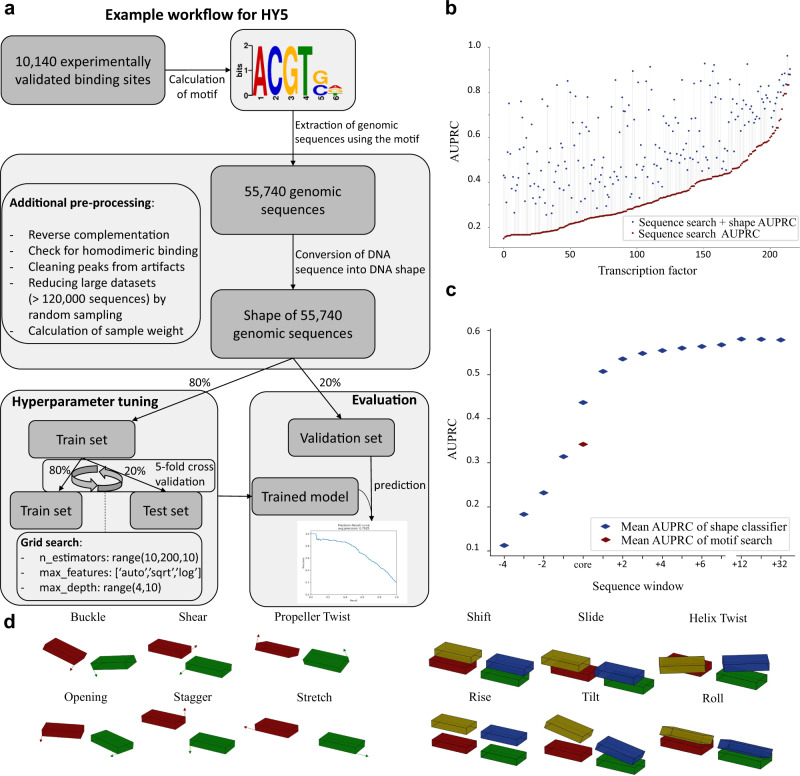
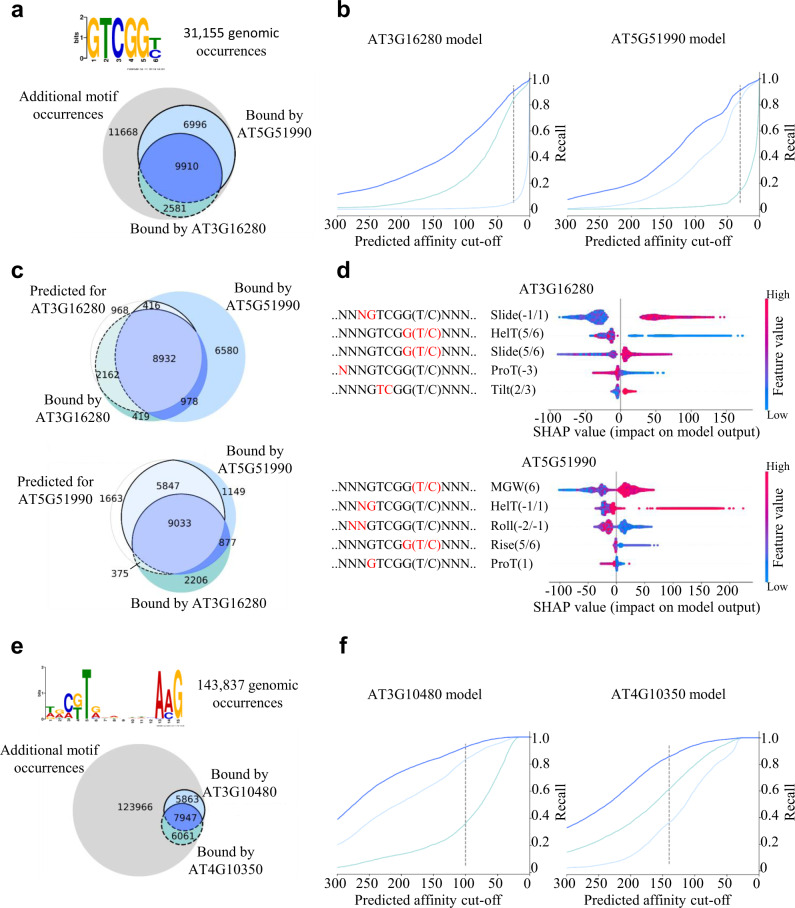
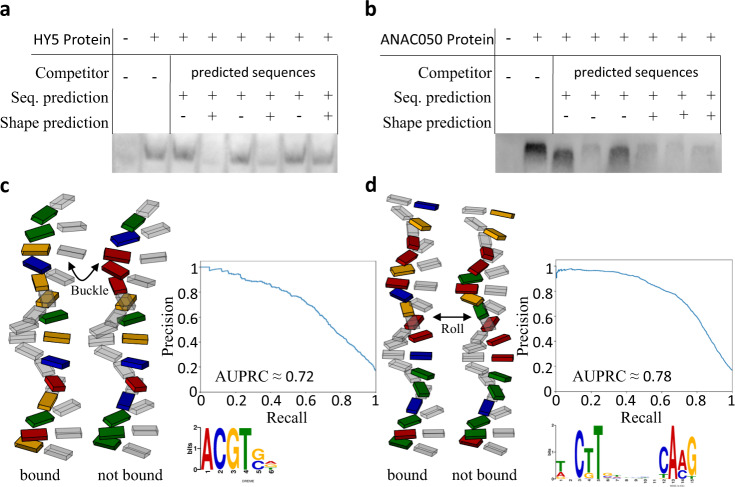
Understanding gene expression will require understanding where regulatory factors bind genomic DNA. The frequently used sequence-based motifs of protein-DNA binding are not predictive, since a genome contains many more binding sites than are actually bound and transcription factors of the same family share similar DNA-binding motifs. Traditionally, these motifs only depict sequence but neglect DNA shape. Since shape may contribute non-linearly and combinational to binding, machine learning approaches ought to be able to better predict transcription factor binding. Here we show that a random forest machine learning approach, which incorporates the 3D-shape of DNA, enhances binding prediction for all 216 tested Arabidopsis thaliana transcription factors and improves the resolution of differential binding by transcription factor family members which share the same binding motif. We observed that DNA shape features were individually weighted for each transcription factor, even if they shared the same binding sequence.


Conflict of interest statement

The authors declare no competing interests.

Figures

Fig. 1
Fig. 1. Overview of workflow and performance of shape-based binding site identification.
a Example workflow illustrating the computational steps from publicly available data to trained models capable of predicting protein–DNA binding affinity. b Performance of the random forest classifier using the border width (number of upstream and downstream bases) with the highest area under the precision recall curve (AUPRC) for each TF. c AUPRC for differing sequence widths. The width was increased upstream and downstream of the core motif sequence, respectively. d The different DNA shape features which were considered to analyse TF specificity. A query table was used for shape calculation.
Fig. 2
Fig. 2. Differentiation of binding specificity of intra-familiar proteins with the same binding motif.
a, e Occurrence of the GTCGG(T/C) and C(G/T)TNNNNNNNAAG binding motifs in the A. thaliana genome sequence and the experimentally validated binding sequences of the AP2/EREBP TFs AT5G51990 and AT3G16280 and NAC TFs ANAC050 (AT3G10480) and BRN2 (AT4G10350). b, f Performance of the random forest regressor trained on the genomic 3D shape. Each line represents the ratio of correctly predicted binding sites regarding all validated binding sites for different affinity prediction cut-offs. The dark blue line corresponds to binding sequences which are bound by both TFs and the light blue lines correspond to the uniquely bound binding sequences. c The Venn diagrams show the sequence distributions according to the cut-off represented by the dashed line, respectively. Fields with light colours show the overlap of predicted and validated binding sequences. Dark coloured fields show the quantity of sequences, which were not predicted as bound by the model regarding the shown cut-off. d Influence of different local shape features on the prediction of the regressor model. The most influential features are at the top. Each row represents one shape feature at a single position within the sequence.
Fig. 3
Fig. 3. Experimental validation of shape-based prediction for HY5 and ANAC050 binding sequences.
a, b Competition EMSA for sequences containing the sequence motif for each respective TF with high and low binding affinity predictions based on their 3D structure. c, d Illustration of the 3D structure of the corresponding sequences. The DNA backbone is not shown, as it is not yet possible to reliably calculate the spatial arrangement of the backbone. Additionally, the precision-recall curve of the RF models for the respective TFs are shown. Precision and recall are based on the ampDAP in vitro verified binding sequences.

References

    1. Riechmann JL, et al. Arabidopsis transcription factors: genome-wide comparative analysis among eukaryotes. Science. 2000;290:2105–2110. doi: 10.1126/science.290.5499.2105. - DOI - PubMed
    1. Bowman JL, et al. Insights into land plant evolution garnered from the Marchantia polymorpha genome. Cell. 2017;171:287–304.e15. doi: 10.1016/j.cell.2017.09.030. - DOI - PubMed
    1. Bailey-Serres J, Parker JE, Ainsworth EA, Oldroyd GED, Schroeder JI. Genetic strategies for improving crop yields. Nature. 2019;575:109–118. doi: 10.1038/s41586-019-1679-0. - DOI - PMC - PubMed
    1. O’Malley RC, et al. Cistrome and epicistrome features shape the regulatory DNA landscape. Cell. 2016;165:1280–1292. doi: 10.1016/j.cell.2016.04.038. - DOI - PMC - PubMed
    1. Fornes, O. et al. JASPAR 2020: update of the open-access database of transcription factor binding profiles. Nucleic Acids Res.48, D87–D92 (2020). - PMC - PubMed

Publication types