. 2022 Jan;41(4):476-488.
doi: 10.1038/s41388-021-02080-1. Epub 2021 Nov 12.

CHK1 inhibition exacerbates replication stress induced by IGF blockade

Affiliations

CHK1 inhibition exacerbates replication stress induced by IGF blockade

Xiaoning Wu et al. Oncogene. 2022 Jan.

Abstract

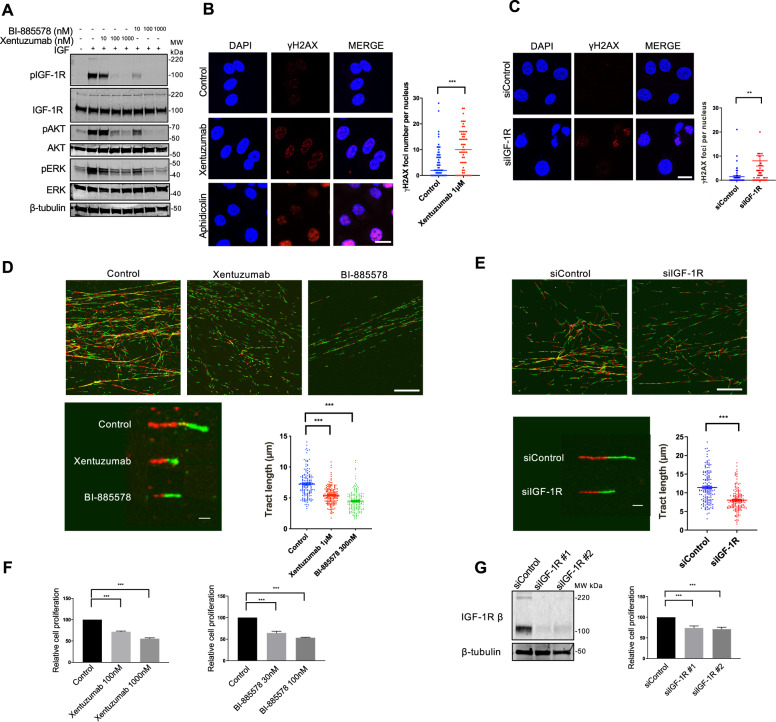
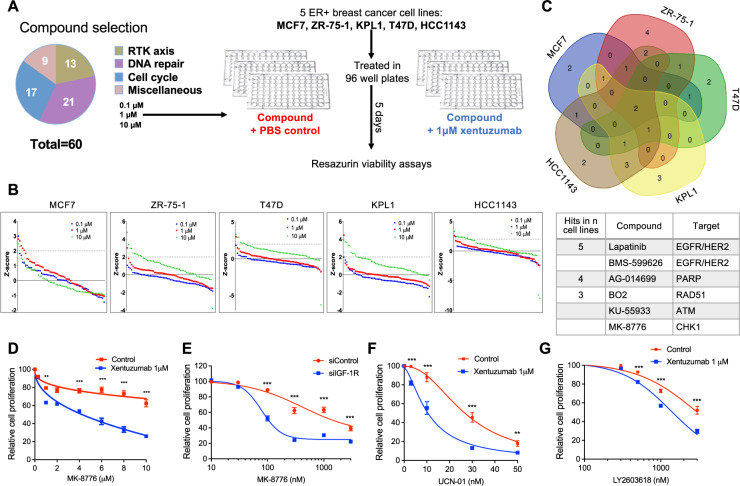
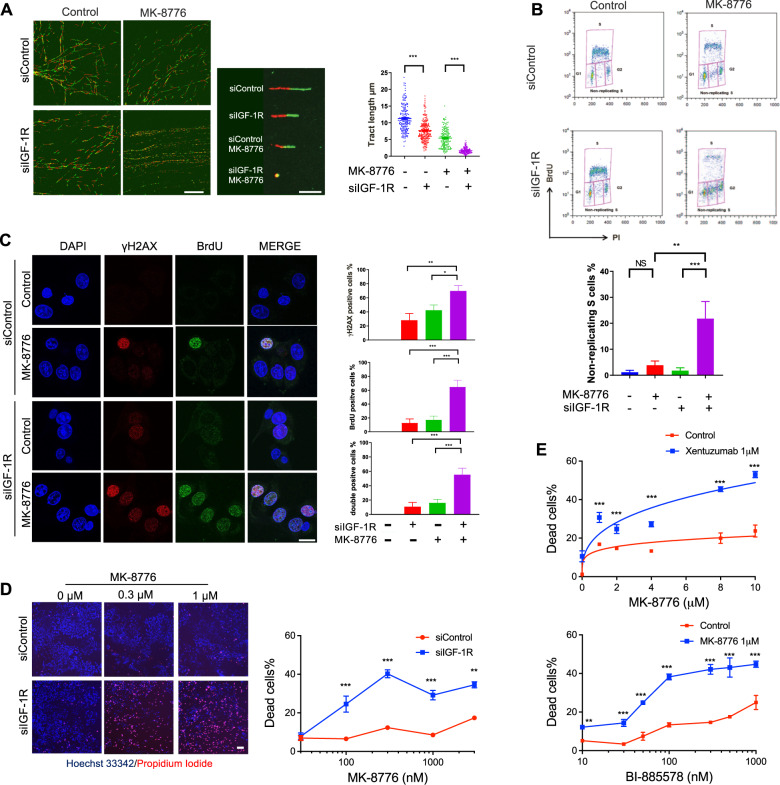
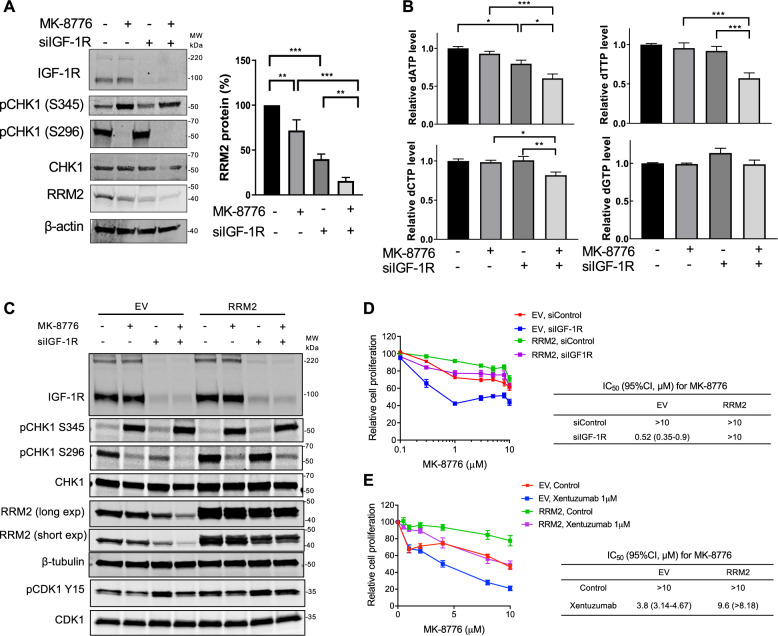
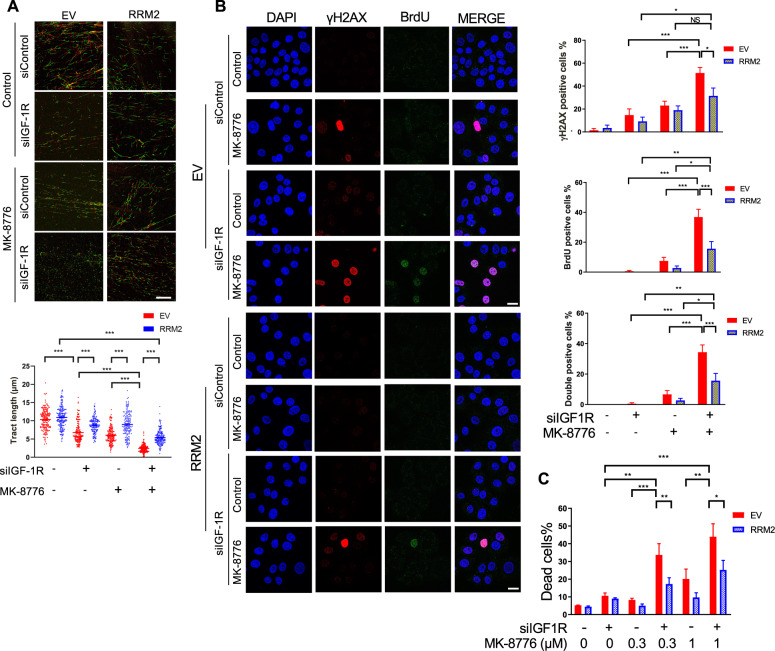
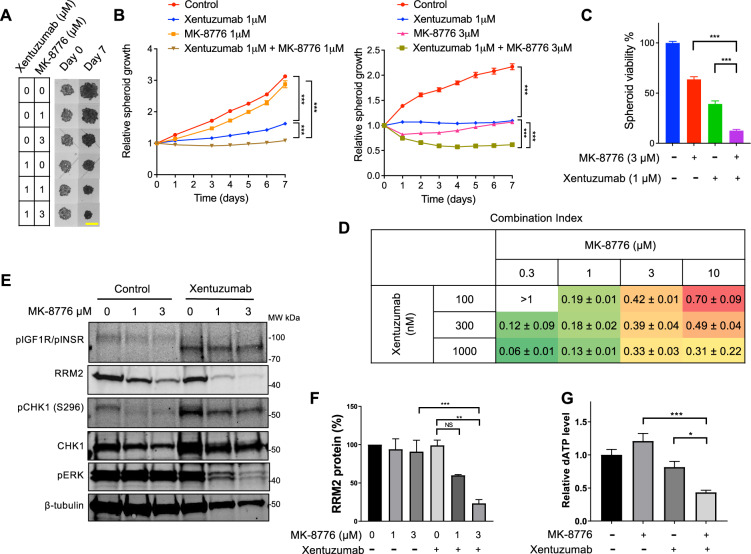
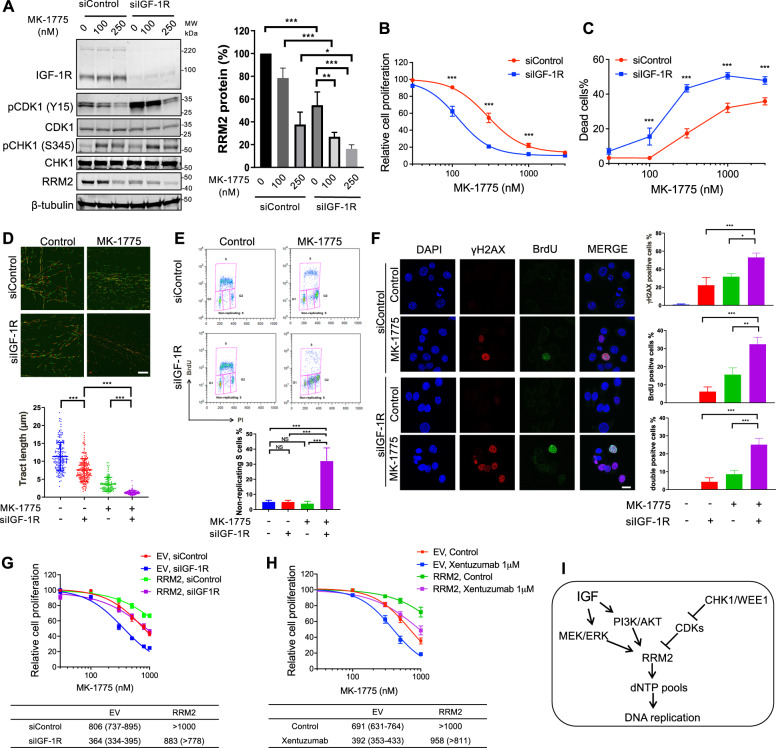
We recently reported that genetic or pharmacological inhibition of insulin-like growth factor receptor (IGF-1R) slows DNA replication and induces replication stress by downregulating the regulatory subunit RRM2 of ribonucleotide reductase, perturbing deoxynucleotide triphosphate (dNTP) supply. Aiming to exploit this effect in therapy we performed a compound screen in five breast cancer cell lines with IGF neutralising antibody xentuzumab. Inhibitor of checkpoint kinase CHK1 was identified as a top screen hit. Co-inhibition of IGF and CHK1 caused synergistic suppression of cell viability, cell survival and tumour growth in 2D cell culture, 3D spheroid cultures and in vivo. Investigating the mechanism of synthetic lethality, we reveal that CHK1 inhibition in IGF-1R depleted or inhibited cells further downregulated RRM2, reduced dNTP supply and profoundly delayed replication fork progression. These effects resulted in significant accumulation of unreplicated single-stranded DNA and increased cell death, indicative of replication catastrophe. Similar phenotypes were induced by IGF:WEE1 co-inhibition, also via exacerbation of RRM2 downregulation. Exogenous RRM2 expression rescued hallmarks of replication stress induced by co-inhibiting IGF with CHK1 or WEE1, identifying RRM2 as a critical target of the functional IGF:CHK1 and IGF:WEE1 interactions. These data identify novel therapeutic vulnerabilities and may inform future trials of IGF inhibitory drugs.


Conflict of interest statement

VMM is a consultancy board member for Boehringer Ingelheim, TB is an employee and UWC an ex-employee of Boehringer Ingelheim. The other authors declare no competing interests.

Figures

Fig. 1
Fig. 1. IGF blockade induces tolerable replication stress.
A Western blot analysis of MCF7 cells exposed to xentuzumab or BI-885578 for 4 days, serum starved for 24 h in the presence of the same inhibitors and stimulated with 50 nM IGF-1 for 15 min. B Representative image of γH2AX immunostaining in MCF7 cells treated with 1 µM xentuzumab or 0.3 µM aphidicolin for 72 h. Scale bar: 20 μm. Graph to right: quantification of γH2AX (>50 cells). Data represent mean ± SEM, pooled from three independent experiments. C Representative image of γH2AX immunostaining in MCF7 cells transfected with siControl or siIGF-1R for 48 h. Scale bar: 20 μm. Graph to right: quantification of γH2AX (>50 cells per condition). D Representative images of DNA fibre tracts (CIdU, red; IdU, green) in MCF7 treated with xentuzumab (1 μM) or BI-885578 (300 nM) for 24 h. Scale bar: 20 μm. Graph to right: quantification of fibre tract length (>150 tracts) analysed using ImageJ software. E Representative images of DNA fibres in MCF7 cells transfected with siControl or siIGF-1R for 48 h. Scale bar: 20 μm. Quantification of fibre tract length (>150 tracts) shown on the right. F Cell viability tested 5 days after drug treatment (CellTiter Blue assay) expressed as % viability of solvent-treated controls. G Western blot analysis of MCF7 cells transfected with siControl or siIGF-1R and lysed after 24 h (left). Transfected cells were collected 24 h later and reseeded for cell viability assay (5 days after 24 h transfection). Results were expressed as % viability of siControl-transfected cells (right). *P < 0.05; **P < 0.01; ***P < 0.001.
Fig. 2
Fig. 2. Compound screen identifies drug combination of CHK1 inhibitor and IGF inhibitor.
A Compound library contained 59 small molecule drugs and controls (DMSO solvent for compounds, PBS for xentuzumab). MCF7, ZR-75-1, KPL1, T47D, HCC1143 were seeded in 96-well plates, treated with DMSO or library compounds at 0.1 µM, 1 µM, 10 µM with PBS or 1 µM xentuzumab and cell viability was determined after 5 days. B Cell viability data were used to calculate Z-scores as described in Supplementary Methods. Z-scores were ranked for all compounds for each cell line. Dotted line: Z-score = 2, threshold for hit identification. C Venn diagram showing overlap of hit compounds in five cell lines. Below: screen hits in at least three cell lines. D MCF7 cells were exposed to xentuzumab and MK-8776 for 5 days. E MCF7 cells were transfected with siControl or siIGF-1R for 24 h, and then exposed to solvent (control) or MK-8776 for 5 days. F, G MCF7 cells were exposed for 5 days to xentuzumab with UCN-01 (F) or LY2603618 (G) prior to cell viability assay. Data in (DG) were expressed as % viability of solvent-treated control or siControl cells and represent mean ± SEM, pooled from n = 3 independent experiments. Two-way ANOVA of data in (DG) indicated that both xentuzumab and IGF-1R depletion induced significant difference (P < 0.001) in the response to CHK1 inhibition; graphs show post-hoc analysis of significance at each drug concentration.
Fig. 3
Fig. 3. CHK1 inhibition induces replication catastrophe in IGF-1R depleted cells.
A Representative images of DNA fibre tracts in MCF7 cells transfected with siControl or siIGF-1R for 24 h and then exposed to solvent or 300 nM MK-8776 for 24 h. Scale bar: 20 μm. Graph: quantification of fibre tract length (>150 tracts). B Flow cytometry analysis of cell cycle distribution of MCF7 cells after siRNA transfection for 24 h and then exposure to solvent or 300 nM MK-8776 for 24 h. Quantification of non-replicating S-phase cells is represented as mean ± SD, pooled from three independent experiments. These data were gated to exclude cells with >4 N DNA content; ungated data are shown in Supplementary Fig. S3E. C Representative images of BrdU and γH2AX immunofluorescence in MCF7 cells transfected with siControl or siIGF-1R for 24 h and then exposed to solvent or 300 nM MK-8776 for 24 h. Cells were cultured with 10 µM BrdU for 36 h before fixation and analysed in non-denaturing conditions to detect ssDNA. Scale bar: 20 µm. Graphs to right: upper, γH2AX-positive cells (>10 foci + pan-nuclear staining); centre, BrdU positive cells (>5 foci + pan-nuclear staining); lower, double-positive cells; ≥10 images were quantified. D Representative images of PI/Hoechst 33342 staining in MCF7 cells transfected with siControl or siIGF-1R for 24 h and then exposed to solvent or MK-8776 for 5 days. Scale bar: 200 μm. Graph below: dead cells % expressed as % PI-positive cells/Hoechst positive cells. Data represent mean ± SEM, pooled from three independent experiments. E MCF7 cells were exposed to xentuzumab (upper) or BI-885578 (lower) in combination with solvent or MK-8776 for 5 days. Dead cells expressed as mean ± SEM % PI-positive cells/Hoechst positive cells. For (D, E) there was a significant difference between each of the dose–response curves (P < 0.001) by 2-way ANOVA.
Fig. 4
Fig. 4. CHK1 inhibition reduces RRM2 protein levels and decreases dNTP pools in IGF-1R depleted cells.
A Western blot analysis of MCF7 cells transfected with siControl or siIGF-1R for 24 h, and exposed to solvent or 300 nM MK-8776 for 24 h. Graph: RRM2 protein levels were quantified by ImageJ, corrected for β-tubulin loading and expressed as percent RRM2 protein content of solvent-treated controls. Data represent mean ± SEM from three independent experiments. B dNTPs extracted from cells in (A) were assayed, results were normalised to solvent controls (left bar) and represent mean ± SEM, pooled from three independent experiments. C Empty vector (EV) control cells and RRM2-overexpressing cells were transfected with siControl or siIGF-1R for 24 h and then exposed to solvent or 300 nM MK-8776 for 24 h, followed by protein extraction and western blot analysis. D EV controls and RRM2-overexpressing cells were siRNA transfected as (C) and then exposed to solvent or MK-8776 for 5 days, followed by cell viability assay. Results were expressed as % viability of solvent-treated control. IC50 values and 95% confidence intervals (CI) were calculated from dose–response curves. By 2-way ANOVA there were significant differences in response to MK-8776 in siControl vs. siIGF-1R transfected EV cells, siControl vs. siIGF-1R transfected RRM2-overexpressing cells and siControl EV cells vs. siControl RRM2 transfectants (P < 0.001 for each comparison) but no significant difference in siControl EV cells vs. siIGF-1R transfected RRM2-overexpressing cells. E EV control cells and RRM2-overexpressing cells were exposed to solvent or MK-8776 in the presence or absence of 1 µM xentuzumab for 5 days followed by assay of cell viability, expressed as % of solvent-treated controls, showing IC50 values and 95% CI. Two-way ANOVA showed significant differences in response to MK-8776 in solvent controls vs. xentuzumab-treated EV cells, controls vs. xentuzumab-treated RRM2-overexpressing cells and control-treated EV vs. RRM2-overexpressing cells (P < 0.001 for each comparison) and no significant difference in the response of control-treated EV cells vs. xentuzumab-treated RRM2-overexpressing cells.
Fig. 5
Fig. 5. RRM2 overexpression rescues replication catastrophe induced by CHK1 inhibition and IGF-1R depletion.
A Representative images of DNA fibre tracts in EV controls and RRM2-overexpressing cells transfected with siControl or siIGF-1R for 24 h and exposed to solvent or 1 µM MK-8776 for 24 h. Scale bar: 20 µm. Graph below: quantification of fibre tract length (>150 tracts). B Representative images of BrdU and γH2AX immunostaining in EV control cells and RRM2-overexpressing cells siRNA transfected and treated as (A), with addition of 10 µM BrdU for 36 h before fixation and analysis in non-denaturing conditions. Scale bar: 20 μm. Graphs to right: quantification of γH2AX-positive, BrdU positive and double-positive cells as in Fig. 3C; data represent mean ± SEM, pooled from 3 independent experiments. C EV controls and RRM2-overexpressing cells were transfected with siControl or siIGF-1R for 24 h and then exposed to solvent control or MK-8776 for 5 days, followed by PI/Hoechst 33342 staining to quantify dead cells, expressed as % PI-positive/Hoechst positive cells. Data represent mean ± SEM, pooled from three independent experiments each with three technical replicates.
Fig. 6
Fig. 6. IGF-inhibited cells are sensitive to CHK1 inhibition in 3D spheroid models.
A Representative images of SK-CO-1 spheroids exposed to xentuzumab alone or with MK-8776 for 7 days. Scale bar 2 mm. B Spheroid growth curves shown as fraction of Day 0 (pre-treatment) value. Two-way ANOVA showed a significant overall treatment effect and significantly reduced growth rates between xentuzumab or 1 or 3 µM MK-8776 alone and in combination (P < 0.001 for each comparison). C After 7 days, on completion of treatments and measurements in A-B, CellTiter Glo 3D viability assays were performed, and results expressed as mean ± SEM % solvent-treated controls pooled from n = 3 independent experiments. D CellTiter Glo 3D viability data were imported into CalcuSyn Software for CI value calculation. Data represent mean ± SD, pooled from three independent experiments. E Western blot analysis of SK-CO-1 spheroids (six spheroids per condition) exposed to solvent or MK-8776 in the presence or absence of 1 µM xentuzumab for 7 days. F RRM2 protein levels were quantified and adjusted for β-tubulin loading. Graph shows mean ± SEM RRM2 protein from three independent experiments, expressed as % of solvent-treated controls. G SK-CO-1 spheroids were treated with 1 µM xentuzumab and/or 3 µM MK-8776. Spheroid extracts were assayed for dATP and the results were normalised to solvent controls (left bar). Data represent mean ± SEM, pooled from three independent experiments.
Fig. 7
Fig. 7. WEE1 inhibition induces replication catastrophe in IGF-1R depleted cells.
A Western blot of MCF7 cells transfected with siControl or siIGF-1R for 24 h and exposed to solvent or MK-1775 for 24 h. Graph: RRM2 protein levels were quantified by ImageJ, corrected for β-tubulin and shown as mean ± SEM % of solvent-treated controls from 3 independent western blots. B, C MCF7 cells were transfected with siControl or siIGF-1R for 24 h and treated with solvent or MK-1775 for 5 days, followed by cell viability assay (B) or cell death assay (C), with significant differences (P < 0.001) in response to MK-1775 in both assays by 2-way ANOVA. D Representative images of DNA fibre tracts in MCF7 cells transfected with siControl or siIGF-1R for 24 h and exposed to solvent or 300 nM MK-1775 for 24 h. Scale bar: 20 μm. Graph below: quantification of fibre tract length (mean ± SEM of >150 tracts). E Analysis of MCF7 cell cycle distribution after transfection with siControl or siIGF-1R for 24 h and exposed to solvent or 300 nM MK-1775 for 24 h. Graph below shows quantification of non-replicating S-phase cells, mean ± SD, pooled from three independent experiments. F Representative images of native BrdU and γH2AX immunostaining in MCF7 cells transfected and treated as (E), and cultured with 10 µM BrdU for 36 h pre-fixation. Scale bar: 20 µm. Graphs to right: quantification of γH2AX positive, BrdU positive and double-positive cells as Fig. 3C; data represent mean ± SEM, pooled from three independent experiments. G EV controls and RRM2-overexpressing cells were transfected with siControl or siIGF-1R for 24 h, exposed to solvent or MK-1775 for 5 days, and cell viability was assayed. Data represent mean ± SEM, pooled from n = 3 independent experiments; below: IC50 values and 95% CI calculated from drug response curves. Two-way ANOVA showed similar differences in response to MK-1775 as in response to MK-8776 (Fig. 4D, E), with significant differences in siControl vs. siIGF-1R transfected EV cells, siControl vs. siIGF-1R transfected RRM2-overexpressing cells and siControl EV cells vs. siControl RRM2 transfectants (P < 0.001 for each comparison) but not in siControl EV cells vs. siIGF-1R transfected RRM2-overexpressing cells. H EV controls and RRM2-overexpressing cells were exposed to solvent or MK-1775 in the presence or absence of 1 µM xentuzumab for 5 days, followed by cell viability assay. Data represent mean ± SEM, pooled from n = 3 independent experiments with below, GI50 values and 95% CI. There were significant differences in response to MK-1775 in solvent controls vs. xentuzumab-treated EV cells, controls vs. xentuzumab-treated RRM2-overexpressing cells and control-treated EV vs. RRM2-overexpressing cells (P < 0.001 in each case) but not in control-treated EV cells vs. xentuzumab-treated RRM2-overexpressing cells. I RRM2 is regulated by IGFs and cell cycle checkpoint kinases CHK1 and WEE1, explaining profound RRM2 downregulation and replication catastrophe upon IGF:CHK1 or IGF:WEE1 co-inhibition.

References

    1. Chitnis MM, Yuen JS, Protheroe AS, Pollak M, Macaulay VM. The type 1 insulin-like growth factor receptor pathway. Clin Cancer Res. 2008;14:6364–70. - PubMed
    1. Borowiec AS, Hague F, Gouilleux-Gruart V, Lassoued K, Ouadid-Ahidouch H. Regulation of IGF-1-dependent cyclin D1 and E expression by hEag1 channels in MCF-7 cells: the critical role of hEag1 channels in G1 phase progression. Biochim Biophys Acta. 2011;1813:723–30. - PubMed
    1. Hamelers IH, van Schaik RF, Sipkema J, Sussenbach JS, Steenbergh PH. Insulin-like growth factor I triggers nuclear accumulation of cyclin D1 in MCF-7S breast cancer cells. J Biol Chem. 2002;277:47645–52. - PubMed
    1. Rochester MA, Riedemann J, Hellawell GO, Brewster SF, Macaulay VM. Silencing of the IGF1R gene enhances sensitivity to DNA-damaging agents in both PTEN wild-type and mutant human prostate cancer. Cancer Gene Ther. 2005;12:90–100. - PubMed
    1. Turney BW, Kerr M, Chitnis MM, Lodhia K, Wang Y, Riedemann J, et al. Depletion of the type 1 IGF receptor delays repair of radiation-induced DNA double strand breaks. Radiother Oncol. 2012;103:402–9. - PubMed

Publication types

MeSH terms