

Early-life body mass index and risks of breast, endometrial, and ovarian cancers: a dose-response meta-analysis of prospective studies
- PMID: 34773099
- PMCID: PMC8854408
- DOI: 10.1038/s41416-021-01625-1
Early-life body mass index and risks of breast, endometrial, and ovarian cancers: a dose-response meta-analysis of prospective studies
Abstract
Background: The evidence for the associations between early-life adiposity and female cancer risks is mixed. Little is known about the exact shape of the relationships and whether the associations are independent of adult adiposity.
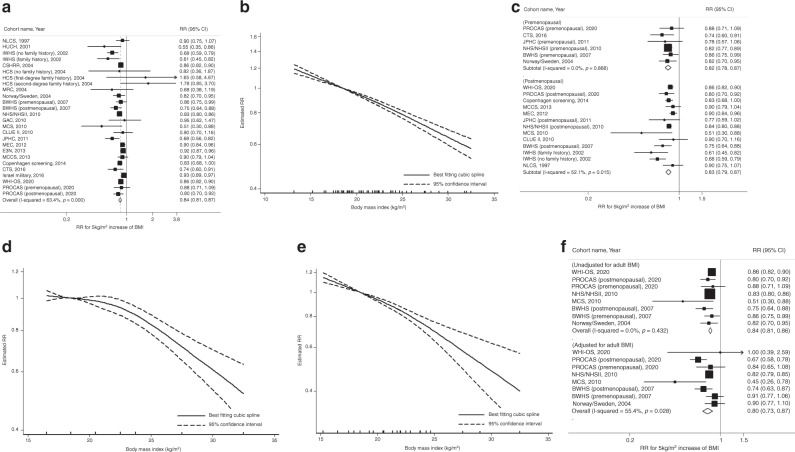
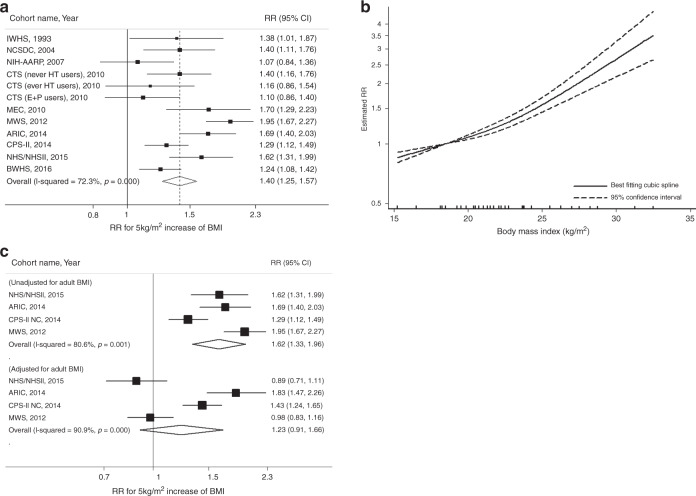
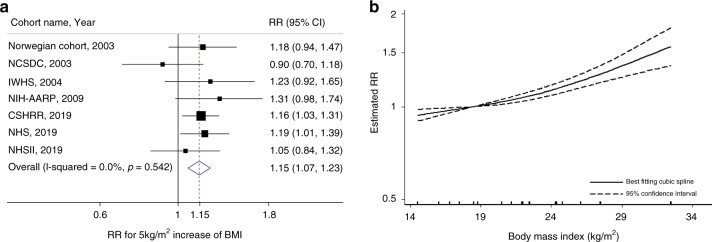
Methods: We conducted dose-response meta-analyses of prospective studies to summarise the relationships of early-life body mass index (BMI) with breast, endometrial, and ovarian cancer risks. Pubmed and Embase were searched through June 2020 to identify relevant studies. Using random-effects models, the summary relative risks (RRs) and 95% confidence intervals (CIs) were estimated per 5-kg/m2 increase in BMI at ages ≤ 25 years. A nonlinear dose-response meta-analysis was conducted using restricted cubic spline analysis.
Results: After screening 33,948 publications, 37 prospective studies were included in this analysis. The summary RRs associated with every 5-kg/m2 increase in early-life BMI were 0.84 (95% CI = 0.81-0.87) for breast, 1.40 (95% CI = 1.25-1.57) for endometrial, and 1.15 (95% CI = 1.07-1.23) for ovarian cancers. For breast cancer, the association remained statistically significant after adjustment for adult BMI (RR = 0.80, 95% CI = 0.73-0.87). For premenopausal breast, endometrial, and ovarian cancers, the dose-response curves suggested evidence of nonlinearity.
Conclusions: With early-life adiposity, our data support an inverse association with breast cancer and positive associations with ovarian and endometrial cancer risks.
© 2021. The Author(s), under exclusive licence to Springer Nature Limited.
Conflict of interest statement
The authors declare no competing interests.
Figures
Similar articles
-
Adult weight gain and adiposity-related cancers: a dose-response meta-analysis of prospective observational studies.J Natl Cancer Inst. 2015 Mar 10;107(2):djv088. doi: 10.1093/jnci/djv088. Print 2015 Feb. J Natl Cancer Inst. 2015. PMID: 25757865 Review.
-
Adult weight gain and adiposity-related cancers: a dose-response meta-analysis of prospective observational studies.J Natl Cancer Inst. 2015 Jan 24;107(3):dju428. doi: 10.1093/jnci/dju428. Print 2015 Mar. J Natl Cancer Inst. 2015. PMID: 25618901
-
Risk prediction for breast, endometrial, and ovarian cancer in white women aged 50 y or older: derivation and validation from population-based cohort studies.PLoS Med. 2013;10(7):e1001492. doi: 10.1371/journal.pmed.1001492. Epub 2013 Jul 30. PLoS Med. 2013. PMID: 23935463 Free PMC article.
-
Influence of physical activity at a young age and lifetime physical activity on the risks of 3 obesity-related cancers: systematic review and meta-analysis of observational studies.Nutr Rev. 2020 Jan 1;78(1):1-18. doi: 10.1093/nutrit/nuz024. Nutr Rev. 2020. PMID: 31393566
-
Cumulative exposure to premenopausal obesity and risk of postmenopausal cancer: A population-based study in Icelandic women.Int J Cancer. 2020 Aug 1;147(3):793-802. doi: 10.1002/ijc.32805. Epub 2019 Dec 24. Int J Cancer. 2020. PMID: 31755107
Cited by
-
The Role of Cow's Milk Consumption in Breast Cancer Initiation and Progression.Curr Nutr Rep. 2023 Mar;12(1):122-140. doi: 10.1007/s13668-023-00457-0. Epub 2023 Feb 2. Curr Nutr Rep. 2023. PMID: 36729355 Free PMC article. Review.
-
Aerobic, muscle-strengthening, and flexibility physical activity and risks of all-cause and cause-specific mortality: a population-based prospective cohort of Korean adults.BMC Public Health. 2023 Jun 14;23(1):1148. doi: 10.1186/s12889-023-15969-1. BMC Public Health. 2023. PMID: 37316812 Free PMC article.
-
The timing of adiposity and changes in the life course on the risk of cancer.Cancer Metastasis Rev. 2022 Sep;41(3):471-489. doi: 10.1007/s10555-022-10054-2. Epub 2022 Jul 30. Cancer Metastasis Rev. 2022. PMID: 35908000 Review.
-
Reassessing the causal role of obesity in breast cancer susceptibility: a comprehensive multivariable Mendelian randomization investigating the distribution and timing of exposure.Int J Epidemiol. 2023 Feb 8;52(1):58-70. doi: 10.1093/ije/dyac143. Int J Epidemiol. 2023. PMID: 35848946 Free PMC article.
-
Glucose metabolic reprogramming and its therapeutic potential in obesity-associated endometrial cancer.J Transl Med. 2023 Feb 7;21(1):94. doi: 10.1186/s12967-022-03851-4. J Transl Med. 2023. PMID: 36750868 Free PMC article. Review.
References
-
- Bray F, Ferlay J, Soerjomataram I, Siegel RL, Torre LA, Jemal A. Global cancer statistics 2018: GLOBOCAN estimates of incidence and mortality worldwide for 36 cancers in 185 countries. CA Cancer J Clin. 2018;68:394–424. - PubMed
-
- Peeters PHM, Verbeek ALM, Krol A, Matthyssen MMM, Dewaard F. Age at menarche and breast-cancer risk in nulliparous women. Breast Cancer Res Treat. 1995;33:55–61. - PubMed
-
- Hsieh CC, Trichopoulos D, Katsouyanni K, Yuasa S. Age at menarche, age at menopause, height and obesity as risk-factors for breast-cancer - associations and interactions in an international case-control study. Int J Cancer. 1990;46:796–800. - PubMed
-
- McPherson CP, Sellers TA, Potter JD, Bostick RM, Folsom AR. Reproductive factors and risk of endometrial cancer—the Iowa women’s health study. Am J Epidemiol. 1996;143:1195–202. - PubMed
-
- Fujita M, Tase T, Kakugawa Y, Hoshi S, Nishino Y, Nagase S, et al. Smoking, earlier menarche and low parity as independent risk factors for gynecologic cancers in japanese: a case-control study. Tohoku J Exp Med. 2008;216:297–307. - PubMed
Publication types
MeSH terms
LinkOut - more resources
Full Text Sources
Medical
