. 2021 Dec;78(24):8261-8281.
doi: 10.1007/s00018-021-04013-3. Epub 2021 Nov 13.

DHX9 contributes to the malignant phenotypes of colorectal cancer via activating NF-κB signaling pathway

Affiliations

DHX9 contributes to the malignant phenotypes of colorectal cancer via activating NF-κB signaling pathway

Shenglan Liu et al. Cell Mol Life Sci. 2021 Dec.

Abstract

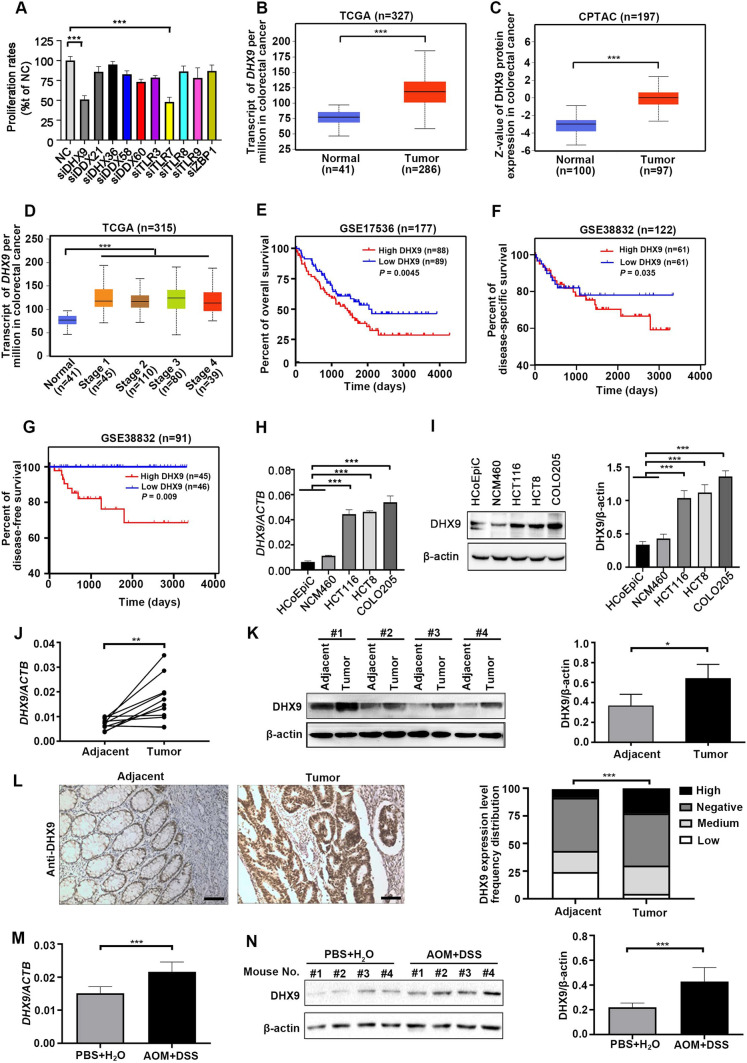
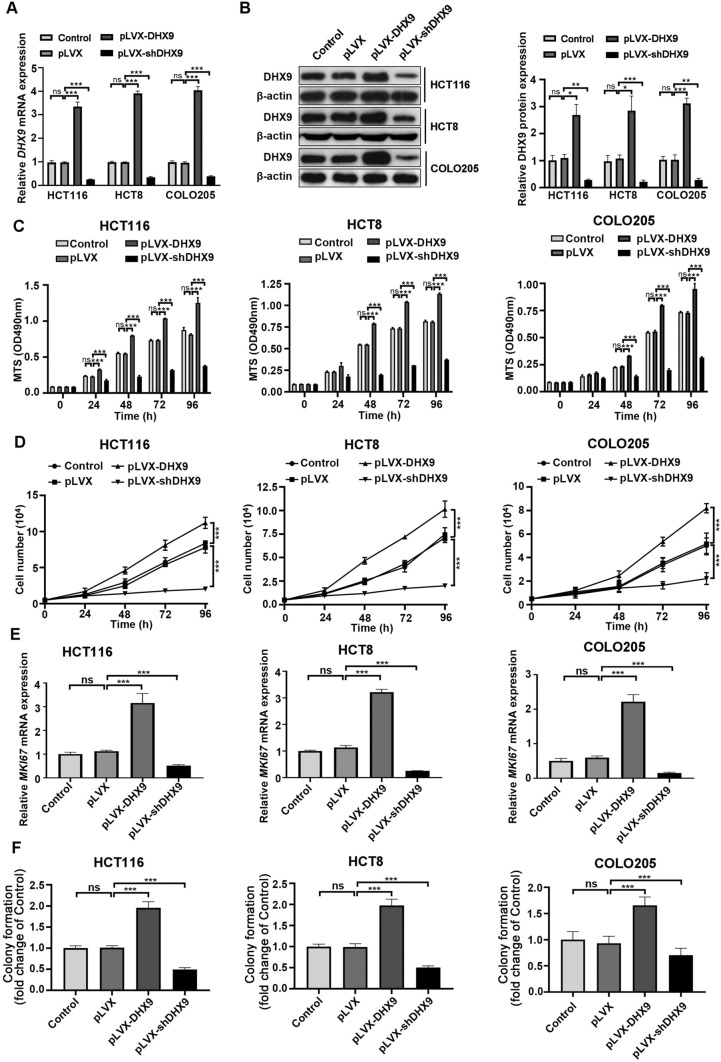
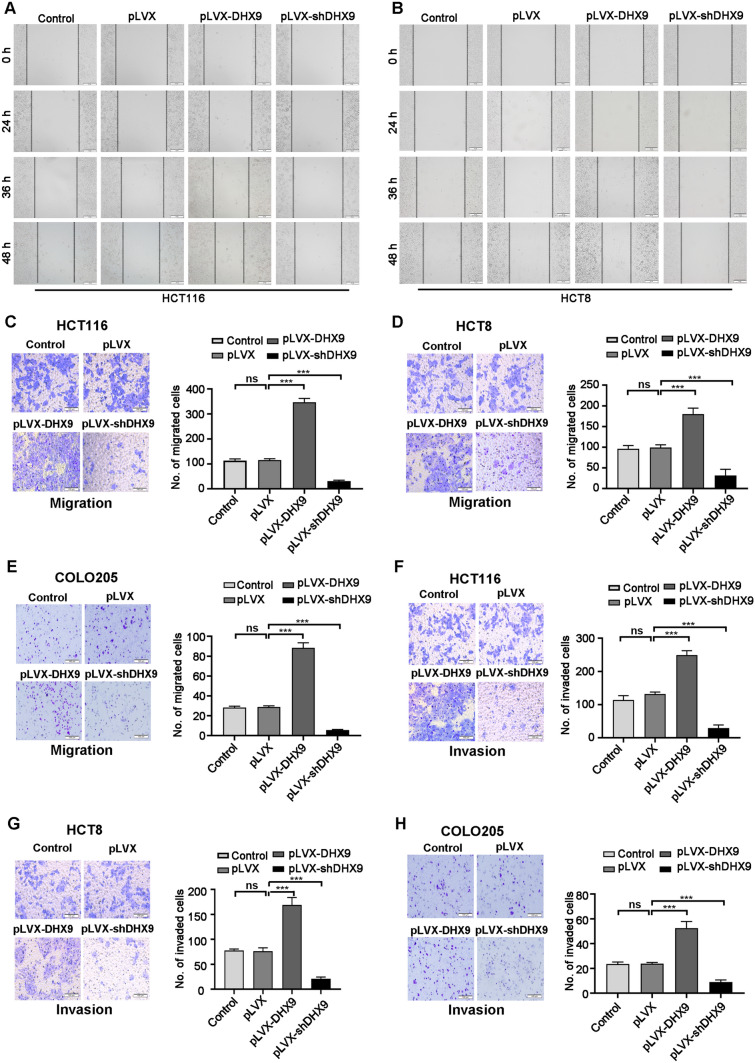
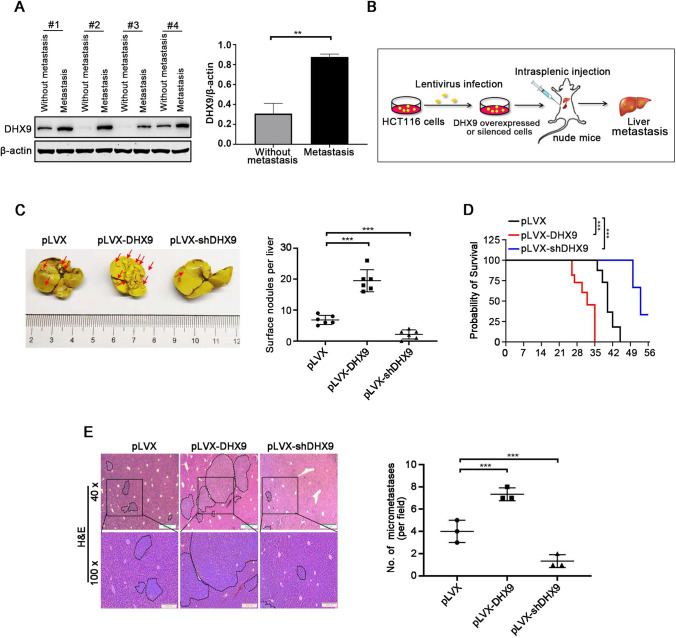
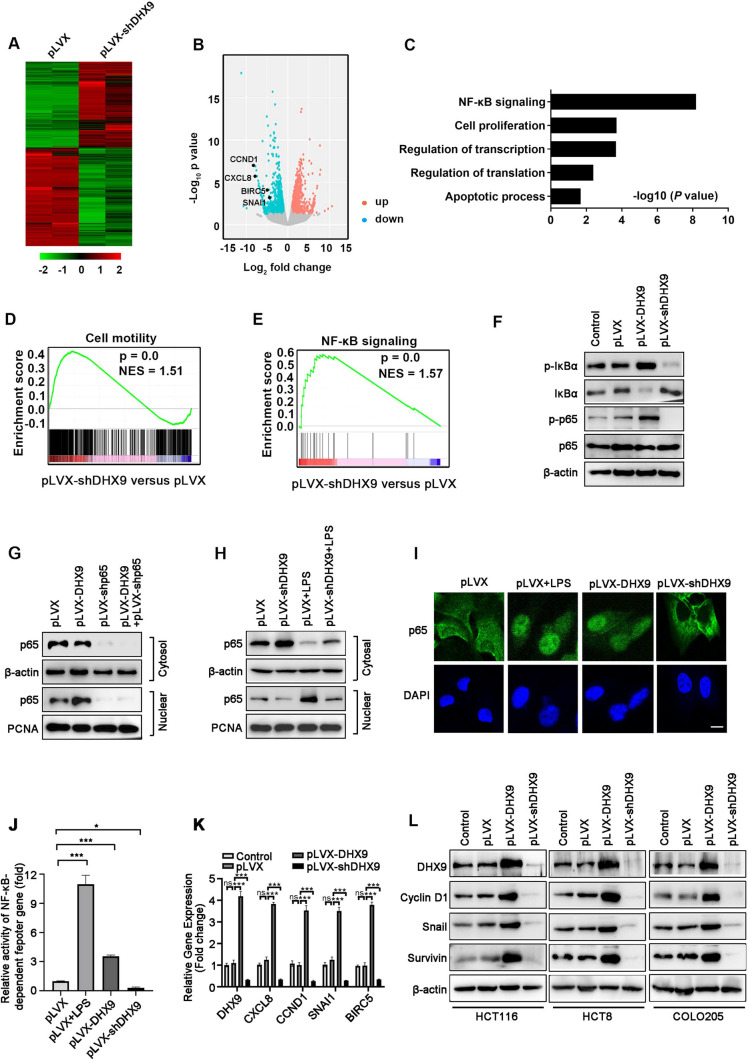
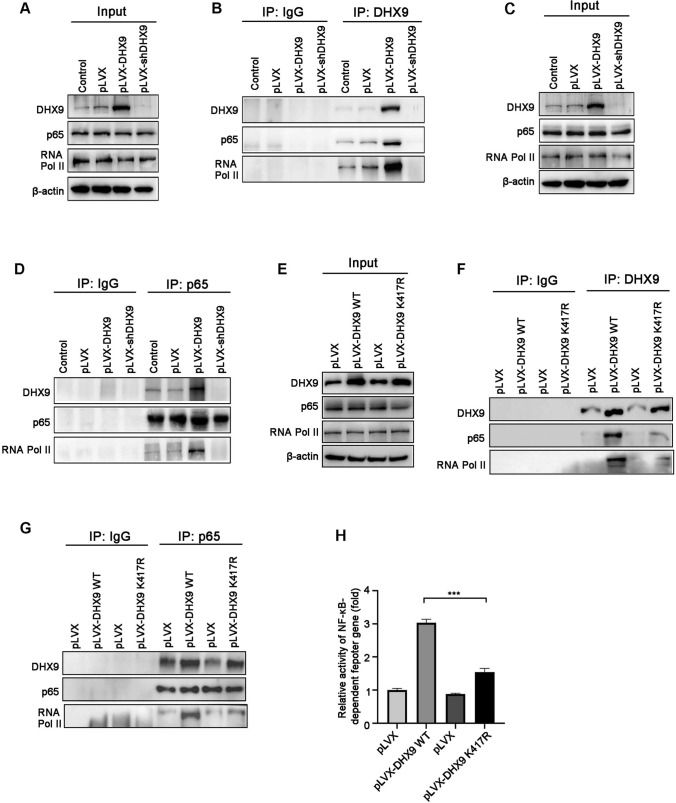
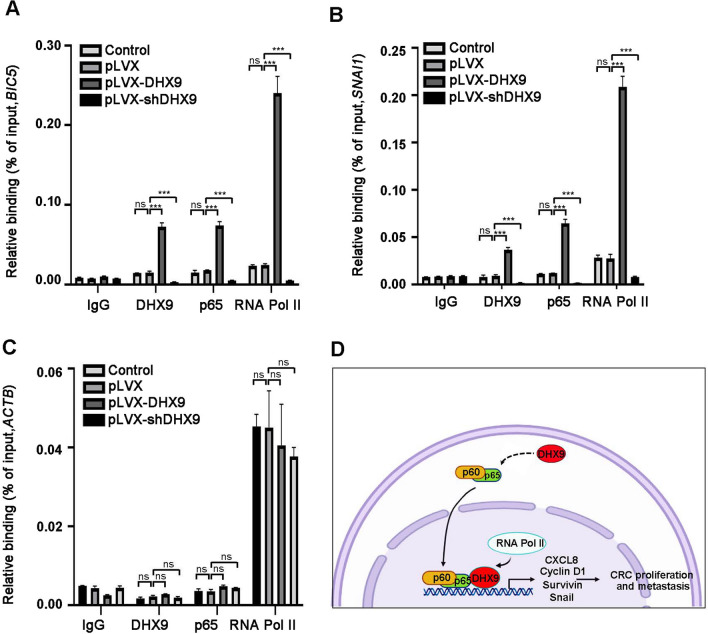
Colorectal cancer (CRC) is the leading cause of cancer-related mortality worldwide, which makes it urgent to identify novel therapeutic targets for CRC treatment. In this study, DHX9 was filtered out as the prominent proliferation promoters of CRC by siRNA screening. Moreover, DHX9 was overexpressed in CRC cell lines, clinical CRC tissues and colitis-associated colorectal cancer (CAC) mouse model. The upregulation of DHX9 was positively correlated with poor prognosis in patients with CRC. Through gain- and loss-of function experiments, we found that DHX9 promoted CRC cell proliferation, colony formation, apoptosis resistance, migration and invasion in vitro. Furthermore, a xenograft mouse model and a hepatic metastasis mouse model were utilized to confirm that forced overexpression of DHX9 enhanced CRC outgrowth and metastasis in vivo, while DHX9 ablation produced the opposite effect. Mechanistically, from one aspect, DHX9 enhances p65 phosphorylation, promotes p65 nuclear translocation to facilitate NF-κB-mediated transcriptional activity. From another aspect, DHX9 interacts with p65 and RNA polymerase II (RNA Pol II) to enhance the downstream targets of NF-κB (e.g., Survivin, Snail) expression to potentiate the malignant phenotypes of CRC. Together, our results suggest that DHX9 may be a potential therapeutic target for prevention and treatment of CRC patients.

Keywords: Colorectal cancer; DHX9; Metastasis; NF-κB signaling; Outgrowth.


Conflict of interest statement

All authors have no conflict of interest in this paper.

Figures

Fig. 1
Fig. 1
siRNA screening identifies DHX9 as an oncogenic molecule in colorectal cancer. A Forty-eight hours after HCT116 cells were transfected with a negative control (NC) siRNA or siRNA against nucleic acid sensing pattern recognition receptors (PRRs), EdU proliferation assay was conducted with high-throughput siRNA screening. ***P < 0.001; Student’s t test. (B-C) The mRNA (B) and protein (C) levels of DHX9 in colorectal cancer (CRC) tissues and normal adjacent tissues in TCGA and CPTAC database, respectively (obtained through UALCAN; http://ualcan.path.uab.edu/index.html). ***P < 0.001; Student’s t test. (D) DHX9 mRNA expression in different CRC stages and normal tissues from the TCGA Dataset. ***P < 0.001; Student’s t test. E Relationship of DHX9 expression with overall survival in patients with CRC in the cohort of GSE17536 database, log-rank test. F The disease-specific survival of patients with low and high DHX9 expression obtained from GSE38832 database, log-rank test. G Association of DHX9 expression with disease free survival of CRC patients in GSE38832 dataset, log-rank test. H The mRNA levels of DHX9 in human normal colonic epithelial cells (HCoEpiC and NCM460) and CRC cells (HCT116, HCT8, and COLO205) were detected by RT-qPCR analysis. ***P < 0.001; one-way ANOVA, post hoc comparisons, Tukey’s test. (I) The protein levels of DHX9 in normal colonic epithelial cells and CRC cells were examined by Western blotting analysis and quantitative data of DHX9 protein levels were shown. ***P < 0.001; one-way ANOVA, post hoc comparisons, Tukey’s test. J The mRNA levels of DHX9 in paired human clinical CRC tissues and corresponding adjacent colorectal tissues (n = 11). **P < 0.01; Student’s t test. K Left, the representative ECL images of DHX9 detected by Western blotting analysis in paired human clinical CRC tissues and corresponding adjacent colorectal tissues. Right, the summary data correspond to Left (n = 3). *P < 0.05; Student’s t test. L Left, representative IHC micrographs of DHX9 staining in paraffin embedded clinical CRC tissues and adjacent normal tissues. Scale bar, 100 μm. Right, rank sum test analysis of IHC results of DHX9 in CRC tissue and adjacent normal tissues (n = 220). ***P < 0.001. M The difference of DHX9 mRNA levels in colorectal tissues of AOM/DSS-treated mice and PBS-treated mice (n = 7). ***P < 0.001; Student’s t test. N Left, the representative ECL images of DHX9 in AOM/DSS-treated mice and PBS-treated mice. Right, the summary data in AOM/DSS-treated group and PBS control group correspond to Left (n = 3). ***P < 0.001; Student’s t test. Data were represented as mean ± SEM from three independent replicate experiments in A, H, I, J, K, M and N
Fig. 2
Fig. 2
DHX9 promotes the proliferation of colorectal cancer cells in vitro. A CRC cells with untreated (Control), lentiviral vector-transfected (pLVX), stably expressing DHX9-encoding constructs (pLVX-DHX9) or shRNAs against DHX9 (pLVX-shDHX9) were subjected to DHX9 expression analysis by RT-qPCR assay. ns, not significant; ***P < 0.001. B Western blotting assay to analyze DHX9 transfection efficiency in CRC cells. Left, the representative ECL images detected by Western blotting analysis. Right, the summary data in CRC cells correspond to Left (n = 3). ns, not significant; *P < 0.05; **, P < 0.01; ***, P < 0.001. C OD490nm values of CRC cells with untreated, vector-transfected, stably expressing DHX9-encoding constructs or shRNAs against DHX9 for indicated time. ns, not significant; ***P < 0.001. D DHX9-overexpressed and -silenced CRC cells were subjected to trypan blue exclusion assay. ***P < 0.001. E The mRNA levels of MKI67 encoding Ki67 in CRC cells with untreated, vector-transfected, stably expressing DHX9-encoding constructs or shRNAs against DHX9 were detected by RT-qPCR analysis. F Anchorage-independent colony growth of CRC cells with untreated, vector-transfected, stably expressing DHX9-encoding constructs or shRNAs against DHX9 were determined. ns, not significant; ***P < 0.001. All data in bar graphs were shown as mean ± SEM from three independent experiments and assessed by one-way ANOVA, post hoc intergroup comparisons, Tukey’s test
Fig. 3
Fig. 3
DHX9 depletion induces apoptosis and inhibits outgrowth of xenografted colorectal cancer cells in nude mice. A Annexin V/PI apoptotic assay was performed in CRC cells with untreated, vector-transfected, stably expressing DHX9-encoding constructs or shRNAs against DHX9. Representative flow cytometry dot plots for HCT116, HCT8, and COLO205 cells and corresponding quantitative analysis from three independent experiments were shown. ns, not significant; *P < 0. 05; *P < 0. 01; ***P < 0.001. B The activity of Caspase-3/8/9 were measured in DHX9-overexpressed or -depleted CRC cells and quantitative data were obtained from three independent experiments. ns, not significant;*** P < 0.001. C Xenograft model of tumor growth was used to evaluate the tumorigenesis ability of stable DHX9-overexpressed or -depleted HCT116 cells (n = 6 each group). Tumor growth curve over time was plotted in the nude mice. ***P < 0.001. D Representative images of tumors dissected from mice were presented (n = 7 each group). (E) Weights of tumors in each group were shown (n = 7). F H&E staining and IHC analysis of Ki67 and active caspase-3 in tumor sections from each group were shown. Scale bar, 100 μm. G Quantitative analysis of Ki67 positive cells in tumor sections from each group. n = 3 mice per condition. *P < 0.05; ***P < 0.001. All data in bar graphs were shown as mean ± SEM and analyzed by one-way ANOVA, post hoc intergroup comparisons, Tukey’s test
Fig. 4
Fig. 4
DHX9 increases the capability of migration and invasion in colorectal cancer cells. A-B Representative photographs of the wound healing scratch assay from stable DHX9-overexpression or -silenced HCT116 (A) and HCT8 (B) cells (The culture properties of COLO205 cells are mixed, adherent and suspension, which were difficult for wound healing scratch assay). Scale bar, 100 μm. C-E CRC cells with untreated, vector-transfected, stably expressing DHX9-encoding constructs or shRNAs against DHX9 were subjected to transwell chamber assays. Representative images for HCT116, HCT8, and COLO205 cells and quantitative analysis from three random microscopic fields were shown in C, D, E, respectively. Scale bar, 100 μm. ns, not significant; ***P < 0.001. F–H Control, vector-transfected, stably expressing DHX9-encoding constructs or shRNAs against DHX9 CRC cells were underwent matrigel invasion chamber assays. Representative images for HCT116, HCT8, and COLO205 cells and quantitative analysis from three random microscopic fields were shown in F, G, H, respectively. Scale bar, 100 μm. ns, not significant; ***P < 0.001. Data in all bar graphs were represented as mean ± SEM and were assessed by one-way ANOVA, post hoc intergroup comparisons, Tukey’s test
Fig. 5
Fig. 5
DHX9 facilitates liver metastasis of colorectal cancer cells. A Western blotting analysis of DHX9 in primary CRC tumors from non-metastatic and liver metastatic patients and quantitative data of DHX9 protein levels were shown Data were represented as mean ± SEM (n = 3). **P < 0.01; Student’s t test. B Graphic illustration for liver metastasis mouse model of CRC. C Representative images of metastatic liver in vector (pLVX), pLVX-DHX9 and pLVX-shDHX9 group were shown (left) and surface nodules were counted (right). Arrows indicated metastatic foci on liver surface. n = 6 mice per condition. Data were represented as mean ± SEM. ***P < 0.001, one-way ANOVA with post hoc intergroup comparison by Tukey's test. D Survival curves analyzed with Kaplan–Meier in the indicated groups of mice were shown (n = 6). Log-rank test, ***P < 0.001. E H&E staining of liver sections, dot plots indicated metastatic nodules. Left, representative images of metastatic nodules in H&E-stained liver section were shown. Scale bar, 500 µm (40 ×), 200 µm (100 ×). Right, quantification of liver metastatic nodules in microscopic fields of 40 × was shown. n = 3 mice per condition. Data were represented as mean ± SEM. ***P < 0.001, one-way ANOVA with post hoc intergroup comparison by Tukey's test
Fig. 6
Fig. 6
DHX9 mediates the activation of NF-κB signal pathway in colorectal cancer cells. A Heatmap showed the alteration of gene expression (≥ twofold) obtained from RNA-Seq of vector-transfected and DHX9-silenced HCT116 cells. B Scatter plot displayed fold changes of gene expression (≥ twofold) in DHX9-silenced HCT116 cells compared with vector-transfected cells. C GO analysis of down-regulated genes (≥ twofold) in DHX9-silenced HCT116 cells compared with vector-transfected cells. D-E GSEA revealed that gene sets of cell motility D and NF-κB signaling E were enriched in DHX9-depleted HCT116 cells. F Proteins levels of IKBα, p65 and phosphorylated IKBα and p65 were evaluated by Western blotting in DHX9-overexpressed or -depleted HCT116 cells. G-H Cytosolic and nuclear fractionations were evaluated by Western blotting in DHX9-overexpressed HCT116 cells with or without p65 knockdown G or in DHX9-silenced HCT116 cells with or without LPS (1 μg/ml) pretreatment for 15 min H. I DHX9-overexpressed or -depleted HCT116 cells were subjected to immunofluorescence analysis of p65 localization (green). Vector-transfected (pLVX) HCT116 cells pretreated with LPS (1 μg/ml) for 15 min were served as a positive control. DAPI (blue) was applied to stain the nuclear. Scale bar, 20 μm. J HCT116 cells with stably expressing pLVX, pLVX-DHX9 or shRNAs against DHX9 were co-transfected with 0.5 μg NF-κB-TATA-Luc reporter plasmid and 10 ng Renilla luciferase reporter. 36 h after transfection, pLVX-HCT116 cells were treated with LPS (200 ng/mL) for 8 h. The luciferase activity of cells was measured. The values of firefly luciferase activity were normalized to Renilla luciferase activity. Fold activation were represented as mean ± SEM of three independent transfections. ***P < 0.001, one-way ANOVA with post hoc intergroup comparison by Tukey's test. K RT-qPCR experiment analyzed NF-κB-target genes including CXCL8, encoding IL-8; CCND1, encoding Cyclin D1; BIRC5, encoding Survivin; SNAI1, encoding Snail, in DHX9-overexpressed or -depleted HCT116 cells. Data were from three independent experiments and represented as mean ± SEM. ns, not significant; ***P < 0.001, one-way ANOVA with post hoc intergroup comparison by Tukey's test. L Western blotting analysis verified the protein levels of candidate NF-κB-target genes in DHX9-overexpressed or -depleted cells
Fig. 7
Fig. 7
DHX9 interacts with p65 and RNA Pol II to active NF-κB-mediated transcription in colorectal cancer cells. A-B Lysates of DHX9-overexpressed or -depleted HCT116 cells were subjected to immunoprecipitation with the anti-DHX9 or anti-IgG antibody, and then incubated with the indicated antibodies using Western blotting. C–D Lysates of DHX9-overexpressed or -depleted HCT116 cells were subjected to immunoprecipitation with the anti-p65 or anti-IgG antibody and subjected to Western blotting. E–G Stable HCT116 cells expressing WT DHX9 and K417R DHX9 were harvested and lysates were used to immunoprecipitation with the anti-DHX9 or anti-p65 or anti-IgG antibody, and then subjected to Western blotting. K417R indicates a negative mutant of DHX9, in which Lys 417 is substituted to Arg that abolishes the ATP-dependent helicase activity. H Stable HCT116 cells expressing WT DHX9 or K417R DHX9 were co-transfected with NF-κB-TATA-Luc reporter plasmid and Renilla luciferase reporter. The luciferase activity of cells was measured after 48-h transfection. The values of firefly luciferase activity were normalized to Renilla luciferase activity. Fold activation were represented as mean ± SEM of three independent transfections. ***P < 0.001, one-way ANOVA with post hoc intergroup comparison by Tukey's test
Fig. 8
Fig. 8
DHX9 is required for p65 and RNA Pol II recruitment to the promoters of NF-κB-dependent genes. A–C ChIP-qPCR analysis for DHX9, p65 or RNA Pol II occupancy at the promoter of BIRC5 A, SNAI1 B or ACTB C in HCT116 cells stably expressed DHX9 cDNA or shDDR1 constructs. All data in bar graphs were shown as mean ± SEM from three independent experiments and analyzed by one-way ANOVA, post hoc intergroup comparisons, Tukey’s test. D A proposed working model of DHX9 in orchestrating the malignant phenotypes of CRC. On one hand, DHX9 enhances p65 phosphorylation, promotes p65 nuclear translocation to facilitate NF-κB-mediated transcriptional activity. On the other hand, DHX9 interacts with p65 and RNA Pol II and is necessary to recruit p65 and RNA Pol II to the NF-κB-dependent promoters to activate downstream gene transcription, including CXCL8, CCND1, BIRC5 and SNAI1. Enhanced CXCL8, Cyclin D1 and Survivin expression contributes to lower apoptosis and promote proliferation in CRC cells; the strengthened expression of Snail increases the capability of migration and invasion, and ultimately facilities liver colonization and metastasis in CRC

References

    1. Dekker E, Tanis PJ, Vleugels JLA, Kasi PM, Wallace MB. Colorectal cancer. The Lancet. 2019;394:1467–1480. doi: 10.1016/S0140-6736(19)32319-0. - DOI - PubMed
    1. F. Bray, J. Ferlay, I. Soerjomataram, R.L. Siegel, L.A. Torre, A. Jemal, Global cancer statistics 2018: GLOBOCAN estimates of incidence and mortality worldwide for 36 cancers in 185 countries, CA: a cancer journal for clinicians, 68 (2018) 394–424. - PubMed
    1. He L, Chen Y, Wu Y, Xu Y, Zhang Z, Liu Z. Nucleic acid sensing pattern recognition receptors in the development of colorectal cancer and colitis. Cell Mol Life Sci. 2017;74:2395–2411. doi: 10.1007/s00018-017-2477-1. - DOI - PMC - PubMed
    1. He L, Liu Y, Lai W, Tian H, Chen L, Xie L, Liu Z. DNA sensors, crucial receptors to resist pathogens, are deregulated in colorectal cancer and associated with initiation and progression of the disease, Journal of. Cancer. 2020;11:893–905. doi: 10.7150/jca.34188. - DOI - PMC - PubMed
    1. He L, Xiao X, Yang X, Zhang Z, Wu L, Liu Z. STING signaling in tumorigenesis and cancer therapy: a friend or foe? Cancer Lett. 2017;402:203–212. doi: 10.1016/j.canlet.2017.05.026. - DOI - PubMed

MeSH terms