. 2021 Dec:48:102178.
doi: 10.1016/j.redox.2021.102178. Epub 2021 Nov 3.

In vivo dynamics of acidosis and oxidative stress in the acute phase of an ischemic stroke in a rodent model

Affiliations

In vivo dynamics of acidosis and oxidative stress in the acute phase of an ischemic stroke in a rodent model

Ilya V Kelmanson et al. Redox Biol. 2021 Dec.

Abstract

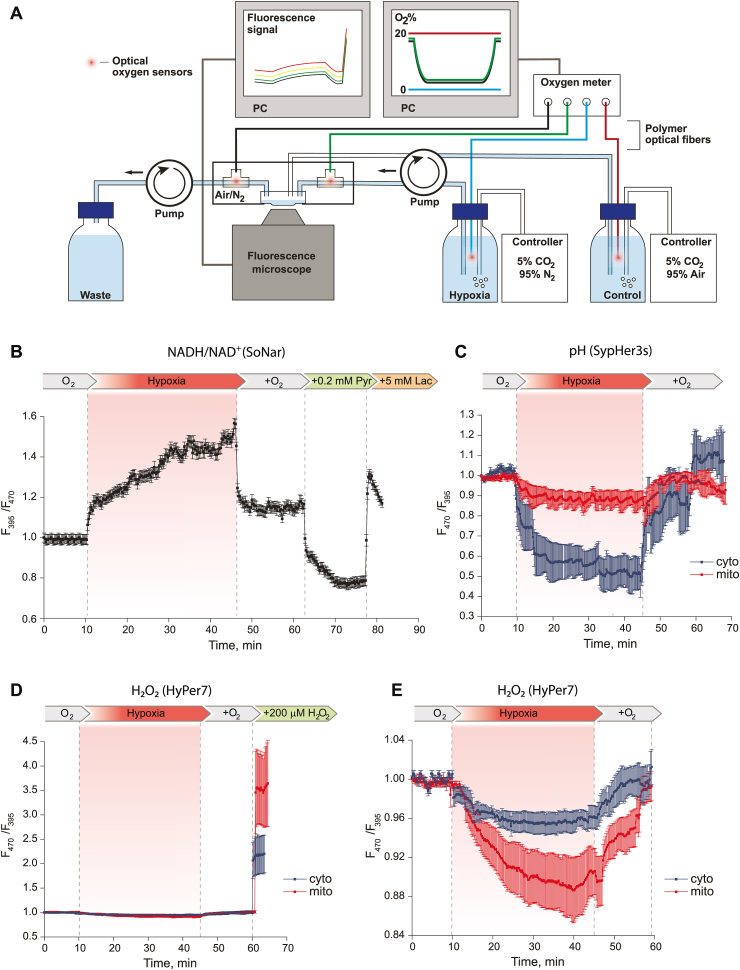
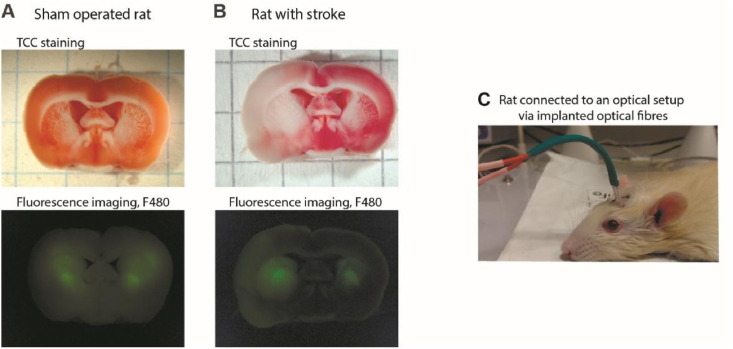
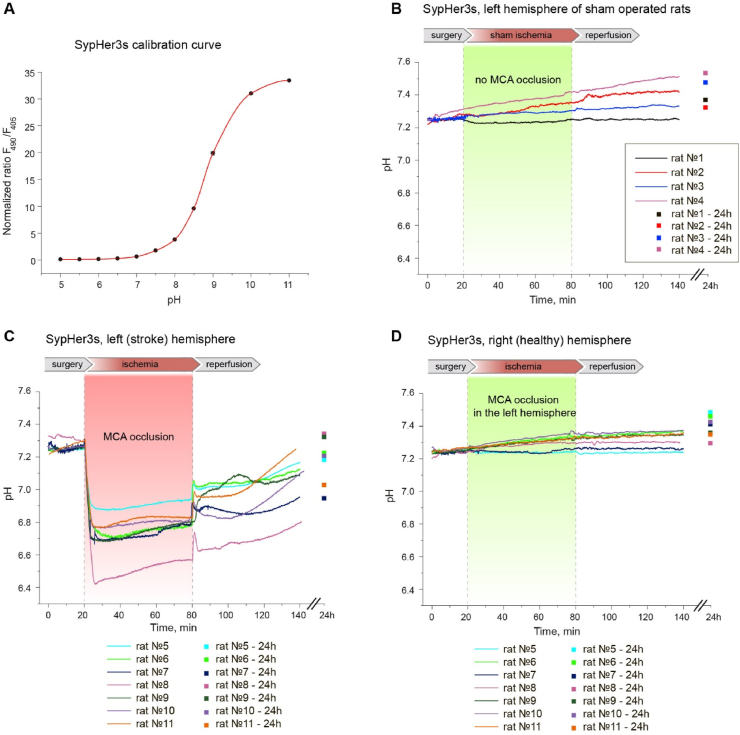
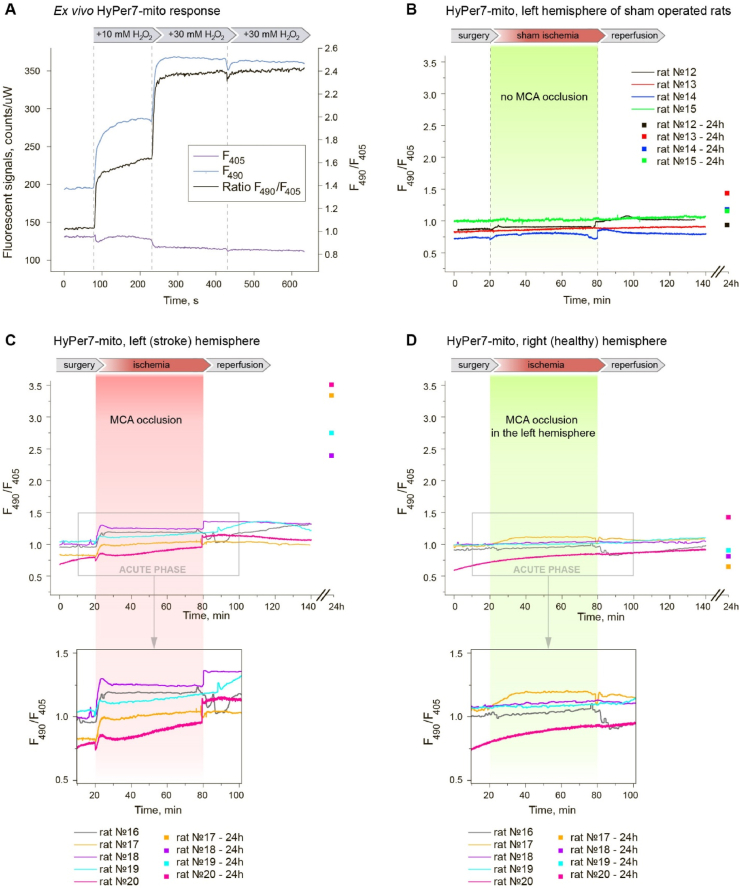
Ischemic cerebral stroke is one of the leading causes of death and disability in humans. However, molecular processes underlying the development of this pathology remain poorly understood. There are major gaps in our understanding of metabolic changes that occur in the brain tissue during the early stages of ischemia and reperfusion. In particular, it is generally accepted that both ischemia (I) and reperfusion (R) generate reactive oxygen species (ROS) that cause oxidative stress which is one of the main drivers of the pathology, although ROS generation during I/R was never demonstrated in vivo due to the lack of suitable methods. In the present study, we record for the first time the dynamics of intracellular pH and H2O2 during I/R in cultured neurons and during experimental stroke in rats using the latest generation of genetically encoded biosensors SypHer3s and HyPer7. We detect a buildup of powerful acidosis in the brain tissue that overlaps with the ischemic core from the first seconds of pathogenesis. At the same time, no significant H2O2 generation was found in the acute phase of ischemia/reperfusion. HyPer7 oxidation in the brain was detected only 24 h later. Comparison of in vivo experiments with studies on cultured neurons under I/R demonstrates that the dynamics of metabolic processes in these models significantly differ, suggesting that a cell culture is a poor predictor of metabolic events in vivo.

Keywords: Genetically encoded fluorescent biosensors; Hydrogen peroxide; Hypoxia/reoxygenation; In vivo optical brain interrogation; Ischemia/reperfusion; Ischemic stroke.


Figures

Fig. 1
Fig. 1
Two-channel fiber-optic photometry for ratiometric pH and H2O2 sensing. (A) Optical setup: dielectric mirrors (M); dichroic mirrors (DM); multifunction I/O Device (I/O card); scientific-grade camera (CCD); bandpass filter (BF); shortpass filter (SP); microscope objective lens (10x); long multimode fibers (MM Fibers). A diagram of time-resolved wavelength-division fluorescence readout is shown in the inset. (B) Excitation light spectra of two LED sources (purple, 405 nm and cyan, 490 nm) and biosensors emission (green). (C) Excitation and emission spectra of SypHer3s at different pH. (For interpretation of the references to colour in this figure legend, the reader is referred to the Web version of this article.)
Fig. 2
Fig. 2
Real-time detection of the NAD+/NADH ratio, pH and H2O2 concentration with genetically encoded fluorescent biosensors in the cytosol and mitochondrial matrix of cultured mouse primary hippocampal neurons during 35 min of hypoxia and subsequent reoxygenation. (A) Hypoxia/reoxygenation model setup. Under control and reoxygenation conditions, the control solution with normal oxygen concentration (pO2 ∼ 150 mmHg, maintained by gas controller and recorded by oxygen meter) was fed into the cell dish trough inlet tube without sensor, removed through outlet tube; perfusion chamber was supplied with air. Under hypoxic conditions, the deoxygenated solution with pO2 < 5 mmHg of oxygen (maintained by gas controller and recorded by oxygen meter) was fed into the cell dish trough inlet tube with sensor, removed through outlet tube; perfusion chamber was supplied with nitrogen. Oxygen level in tanks and tubes, fluorescent signal from microscope were recorded in real-time mode. (B) The NAD+/NADH ratio dynamics during hypoxia/reoxygenation in neurons. Normalized signal of SoNar (ratio F395/F470) was averaged from 21 neurons in 2 experiments. A higher ratiometric signal of SoNar corresponds to a higher NADH/NAD+ ratio. (C) pH dynamics during hypoxia/reoxygenation in neurons. Normalized signal of SypHer3s (ratio F470/F395) was averaged from 184 neurons with mito-localization and 94 neurons with cyto-localization in 8 and 6 experiments, respectively. A higher ratiometric signal of SypHer3s corresponds to a more alkaline pH. (D) Dynamics of H2O2 concentration during hypoxia/reoxygenation in neurons against the background of exogenous H2O2 addition to determine the maximum response of HyPer7 biosensor in this system. Normalized signal of HyPer7 (ratio F470/F395) was averaged from 68 neurons with mito-localization of the biosensor and 120 neurons with cyto-localization in 4 experiments. A higher ratiometric signal of HyPer7 corresponds to a higher H2O2 concentration. (E) Dynamics of H2O2 concentration during hypoxia/reoxygenation in neurons. Normalized signal of HyPer7 (ratio F470/F395) was averaged from 203 neurons with mito-localization of the biosensor and 216 neurons with cyto-localization in 13 and 7 experiments, respectively. In all graphs error bars indicate standard error of mean.
Fig. 3
Fig. 3
Fiber-optic detection of the fluorescence readout from biosensors expressed in rat brain tissues. Brain slices of (A) sham operated rat and (B) rat with stroke (24h) exposed to the MCAO model. TTC staining was used to confirm ischemic injury. The presence of a fluorescent label (in the presented example, HyPer7-mito) was confirmed using fluorescence microscopy. (C) Photo of an animal with optical fibers implanted in the brain and connected to the optical cable of the setup.
Fig. 4
Fig. 4
In vivo time-resolved studies of pH dynamics in rat brain tissues during the development of ischemic stroke (MCAO model). Viral particles AAV9 with SypHer3s gene were injected into caudata nuclei of both hemispheres. (A) Calibration curve of the dependence of SypHer3s signal on the pH value obtained on purified protein preparation in vitro. Curve plotted from at least 3 measurements on purified protein. Error bars indicate standard deviation. (B) Dynamics of SypHer3s in the left hemisphere of sham operated rats. The animals of this group underwent all surgical procedures, except that the filament deliberately did not reach the MCA and did not cause occlusion. (C,D) Signal registration of SypHer3s with the setup was carried out through implanted fibers simultaneously at two points of the brain, corresponding the stroke zone in the left hemisphere (C) and healthy tissue in the right hemisphere (D). Each graph (B–C) reflects the pH dynamics in an individual rat. The dynamics of the signal was recorded continuously during the surgical procedures, the acute phase of the development of ischemic stroke (1 h ischemia + 1 h reperfusion); in addition, the signal value was measured the next day (separate points on the graphs).
Fig. 5
Fig. 5
In vivo time-resolved studies of H2O2 dynamics in rat brain tissues during the development of ischemic stroke (MCAO model). Viral particles AAV9 with HyPer7-mito gene were injected into caudata nuclei of both hemispheres. (A)Ex vivo HyPer7-mito response to exogenous H2O2 additions. (B) Dynamics of HyPer7-mito in the left hemisphere of sham operated rats. The animals of this group underwent all surgical procedures, except that the filament deliberately did not reach the MCA and did not cause occlusion. (C,D) Signal registration of HyPer7-mito with the setup was carried out through implanted fibers simultaneously at two points of the brain, corresponding the stroke zone in the left hemisphere (C) and healthy tissue in the right hemisphere (D). Each graph (B–C) reflects the H2O2 dynamics in an individual rat. The dynamics of the signal was recorded continuously during the surgical procedures, the acute phase of the development of ischemic stroke (1 h ischemia + 1 h reperfusion); in addition, the signal value was measured the next day (separate points on the graphs).

References

    1. Mergenthaler P., Lindauer U., Dienel G.A., Meisel A. Sugar for the brain: the role of glucose in physiological and pathological brain function. Trends Neurosci. 2013;36:587–597. doi: 10.1016/j.tins.2013.07.001. - DOI - PMC - PubMed
    1. Kuriakose D., Xiao Z. Pathophysiology and treatment of stroke: present status and future perspectives. Int. J. Mol. Sci. 2020;21 doi: 10.3390/ijms21207609. - DOI - PMC - PubMed
    1. Johnson W., Onuma O., Owolabi M., Sachdev S. Stroke: a global response is needed. Bull. World Health Organ. 2016;94 doi: 10.2471/BLT.16.181636. 634-634A. - DOI - PMC - PubMed
    1. Benveniste H. Glutamate, microdialysis, and cerebral ischemia: lost in translation? Anesthesiology. 2009;110:422–425. doi: 10.1097/ALN.0b013e318194b620. - DOI - PubMed
    1. Lai T.W., Zhang S., Wang Y.T. Excitotoxicity and stroke: identifying novel targets for neuroprotection. Prog. Neurobiol. 2014;115:157–188. doi: 10.1016/j.pneurobio.2013.11.006. - DOI - PubMed