. 2021 Nov 13;21(1):1222.
doi: 10.1186/s12885-021-08974-3.

Tumor-immune profiling of CT-26 and Colon 26 syngeneic mouse models reveals mechanism of anti-PD-1 response

Affiliations

Tumor-immune profiling of CT-26 and Colon 26 syngeneic mouse models reveals mechanism of anti-PD-1 response

Yosuke Sato et al. BMC Cancer. .

Abstract

Background: Immune checkpoint blockade (ICB) therapies have changed the paradigm of cancer therapies. However, anti-tumor response of the ICB is insufficient for many patients and limited to specific tumor types. Despite many preclinical and clinical studies to understand the mechanism of anti-tumor efficacy of ICB, the mechanism is not completely understood. Harnessing preclinical tumor models is one way to understand the mechanism of treatment response.

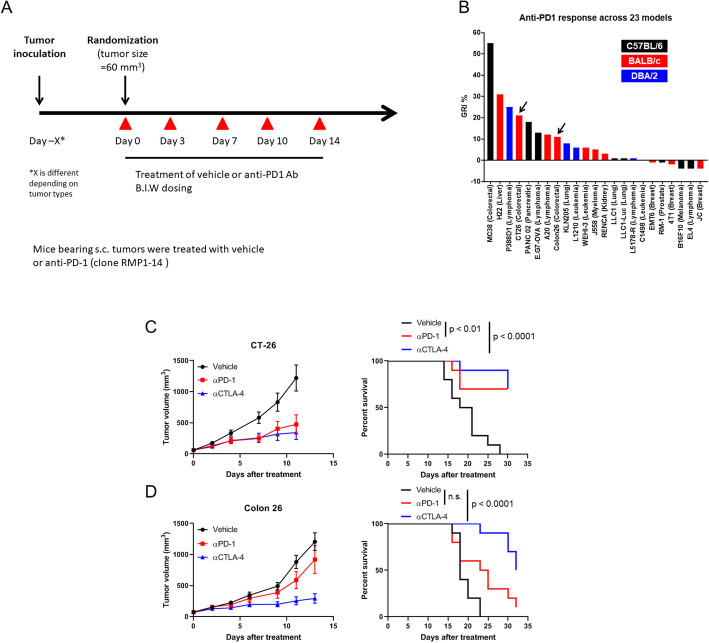
Methods: In order to delineate the mechanisms of anti-tumor activity of ICB in preclinical syngeneic tumor models, we selected two syngeneic murine colorectal cancer models based on in vivo screening for sensitivity with anti-PD-1 therapy. We performed tumor-immune profiling of the two models to identify the potential mechanism for anti-PD-1 response.

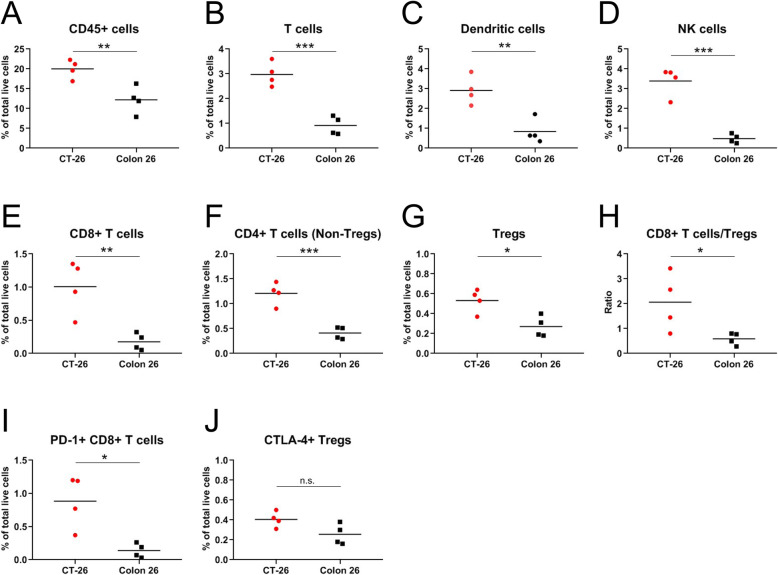
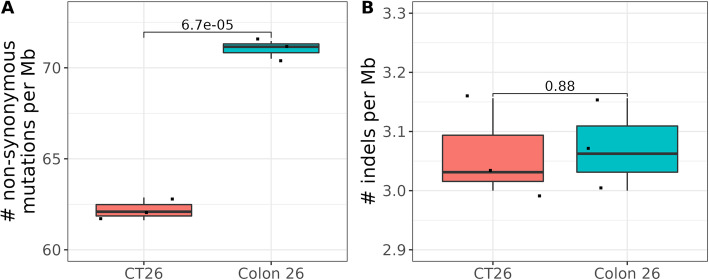
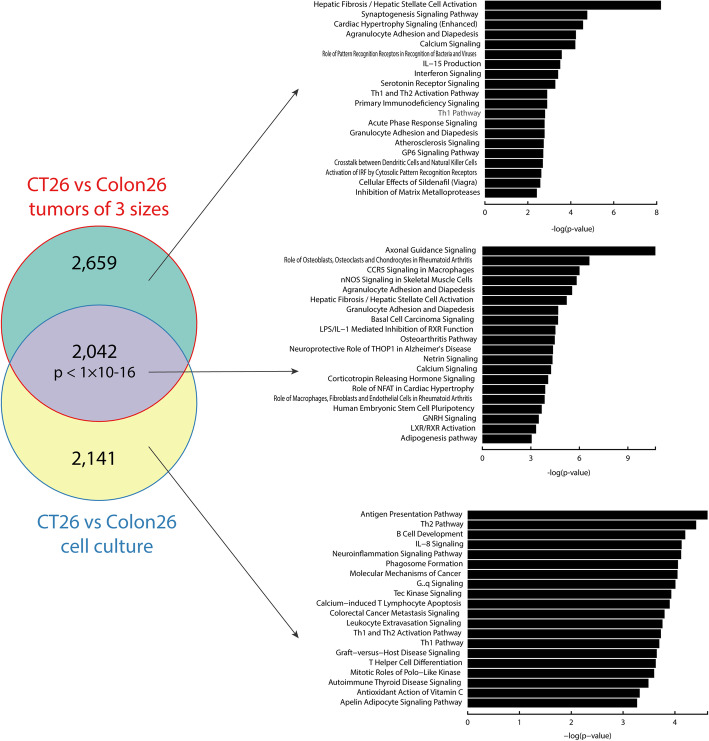
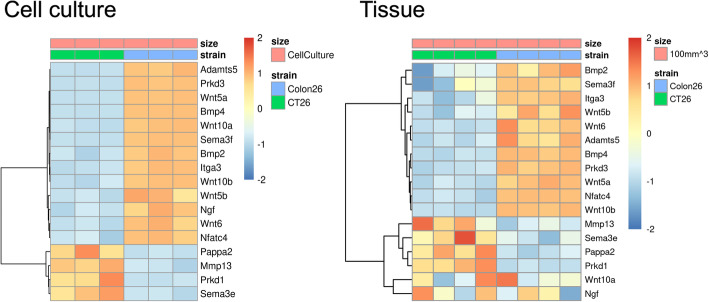
Results: We performed in vivo screening for anti-PD-1 therapy across 23 syngeneic tumor models and found that CT-26 and Colon 26, which are murine colorectal carcinoma derived from BALB/c mice, showed different sensitivity to anti-PD-1. CT-26 tumor mice were more sensitive to the anti-PD-1 antibody than Colon 26, while both models show similarly sensitivity to anti-CTLA4 antibody. Immune-profiling showed that CT-26 tumor tissue was infiltrated with more immune cells than Colon 26. Genomic/transcriptomic analyses highlighted thatWnt pathway was one of the potential differences between CT-26 and Colon 26, showing Wnt activity was higher in Colon 26 than CT-26. .

Conclusions: CT-26 and Colon 26 syngeneic tumor models showed different sensitivity to anti-PD-1 therapy, although both tumor cells are murine colorectal carcinoma cell lines from BALB/c strain. By characterizing the mouse cells lines and tumor-immune context in the tumor tissues with comprehensive analysis approaches, we found that CT-26 showed "hot tumor" profile with more infiltrated immune cells than Colon 26. Further pathway analyses enable us to propose a hypothesis that Wnt pathway could be one of the major factors to differentiate CT-26 from Colon 26 model and link to anti-PD-1 response. Our approach to focus on preclinical tumor models with similar genetic background but different sensitivity to anti-PD-1 therapy would contribute to illustrating the potential mechanism of anti-PD-1 response and to generating a novel concept to synergize current anti-PD-1 therapies for cancer patients.

Keywords: Anti-PD-1; Anti-tumor activity; CT-26; Colon 26; Immune checkpoint blockade; Syngeneic model; Wnt.


Conflict of interest statement

YS, MYL and MS are all employees of Millennium Pharmaceuticals, Inc. a wholly owned subsidiary of Takeda Pharmaceutical Company Limited, Cambridge, MA, USA. YF and HL were employees of Takeda when the work was being conducted.

Figures

Fig. 1
Fig. 1
CT-26 tumor mice are more sensitive to anti-PD-1 checkpoint blockade than Colon 26 tumor mice. (A) A scheme of in vivo studies for anti-PD-1 antibody across 23 syngeneic tumor models. (B) Growth rate inhibition (%) of anti-mouse PD-1 across 23 syngeneic tumor models of different background mouse strains. (C) Growth and survival of BALB/c mice bearing CT-26 tumors treated with vehicle (PBS), anti-mouse PD-1 and anti-mouse CTLA-4. When the mean tumor volume reached approximately 60 mm3, animals were randomized into treatment groups (n = 10/group) and dosing was initiated on Day 0 of the study. (D) Growth and survival of BALB/c mice bearing Colon 26 tumors treated with vehicle (PBS), anti-mouse PD-1 and anti-mouse CTLA-4. When the mean tumor volume reached approximately 60 mm3, animals were randomized into treatment groups (n = 10/group) and dosing was initiated on Day 0 of the study. (Left) Tumor size as measured by vernier calipers, and the data shown in all panels are the mean (n = 10/group) ± SEM. (Right) Survival curve comparing treatment groups. Mice were euthanized when tumors reached 2000 mm3. n.s., nonsignificant
Fig. 2
Fig. 2
CT-26 tumors are infiltrated with more anti-tumor immune cells than Colon 26 tumors. BALB/c mice were inoculated with 3 × 105 CT-26 or Colon 26 cells. When the tumor volume reached approximately 100 mm3, tumor tissues were harvested, dissociated into single cells and analyzed by flow cytometry. All data are represented as percent of total live cells, which include both tumor cells and immune cells. Quantification of (A) CD45+ cells, (B) T cells (CD45+ CD3+ CD11b-), (C) dendritic cells (CD45+ CD11b + CD11c + MHCII+), (D) NK cells (CD45+ CD3- CD11b- CD335+), (E) CD8+ T cells (CD45+ CD3+ CD11b- CD4- CD8+), (F) CD4+ T cells (Non-Tregs, CD45+ CD3+ CD11b- CD4+ CD8-Foxp3-), (G) Tregs (CD45+ CD3+ CD11b- CD4+ CD8- CD25+ Foxp3+), (H) ratio of CD8+ T cells to Tregs, (I) PD-1+ CD8+ T cells and (J) CTLA-4+ Tregs. Mean of each immune population are indicated as bars. Statistical significance (t-test) between groups: * 0.01 < p < 0.05, ** 0.001 < p < 0.01, *** p < 0.001. n.s., nonsignificant
Fig. 3
Fig. 3
Mutations detected in CT-26 and Colon 26 in cell line samples. A. Tumor mutational burden (numbers of non-synonymous mutations per Mb). B. Number of indelsper Mb
Fig. 4
Fig. 4
Canonical pathway analysis of differentially expressed genes between CT-26 vs. Colon 26 from tumor tissues of different sizes and cell lines. CT-26 and Colon 26 tumors were compared at 3 different sizes to derive 3 sets of DE genes and the union of the 3 sets contained 4701 DE genes. Comparing CT-26 and Colon 26 cell lines revealed 4183 DE genes. A significant number of DE genes (2042, p < 1 × 10− 6, hypergeometric test) are shared between the tumor-tumor and cell line-cell line comparisons
Fig. 5
Fig. 5
Wnt ligand and Wnt-regulated gene expression. Cell line comparison and comparison of tumors at 100 mm3

References

    1. Galon J, Bruni D. Approaches to treat immune hot, altered and cold tumours with combination immunotherapies. Nat Rev Drug Discov. 2019;18(3):197–218. doi: 10.1038/s41573-018-0007-y. - DOI - PubMed
    1. Wei SC, Duffy CR, Allison JP. Fundamental mechanisms of immune checkpoint blockade therapy. Cancer Discov. 2018;8(9):1069–1086. doi: 10.1158/2159-8290.CD-18-0367. - DOI - PubMed
    1. Havel JJ, Chowell D, Chan TA. The evolving landscape of biomarkers for checkpoint inhibitor immunotherapy. Nat Rev Cancer. 2019;19(3):133–150. doi: 10.1038/s41568-019-0116-x. - DOI - PMC - PubMed
    1. Park YJ, Kuen DS, Chung Y. Future prospects of immune checkpoint blockade in cancer: from response prediction to overcoming resistance. Exp Mol Med. 2018;50(8):1–13. doi: 10.1038/s12276-018-0130-1. - DOI - PMC - PubMed
    1. Yarchoan M, Hopkins A, Jaffee EM. Tumor mutational burden and response rate to PD-1 inhibition. N Engl J Med. 2017;377(25):2500–2501. doi: 10.1056/NEJMc1713444. - DOI - PMC - PubMed

Substances