. 2021 Nov:39:100455.
doi: 10.1016/j.sste.2021.100455. Epub 2021 Sep 13.

Robust trend estimation for COVID-19 in Brazil

Affiliations

Robust trend estimation for COVID-19 in Brazil

Fernanda Valente et al. Spat Spatiotemporal Epidemiol. 2021 Nov.

Abstract

Estimating patterns of occurrence of cases and deaths related to the COVID-19 pandemic is a complex problem. The incidence of cases presents a great spatial and temporal heterogeneity, and the mechanisms of accounting for occurrences adopted by health departments induce a process of measurement error that alters the dependence structure of the process. In this work we propose methods to estimate the trend in the cases of COVID-19, controlling for the presence of measurement error. This decomposition is presented in Bayesian time series and spatio-temporal models for counting processes with latent components, and compared to the empirical analysis based on moving averages. We applied time series decompositions for the total number of deaths in Brazil and for the states of São Paulo and Amazonas, and a spatio-temporal analysis for all occurrences of deaths at the state level in Brazil, using two alternative specifications with global and regional components.

Keywords: Epidemic model; Spatio-temporal count process; Time series decomposition.


Conflict of interest statement

The authors declare that they have no known competing financial interests or personal relationships that could have appeared to influence the work reported in this paper.

Figures

Fig. 1
Fig. 1
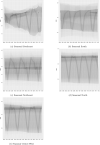
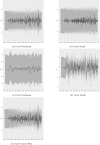
Simulated ACF and PACF functions of new daily deaths under the reporting contamination mechanism. Mean values from 10,000 replications of the SEIR model with measurement error.
Fig. 2
Fig. 2
Trend extraction using Moving Average and Hamilton Filters - COVID-19 related deaths for São Paulo State — 02/25/2020 to 12/06/2020.
Fig. 3
Fig. 3
Posterior mean and 95% credibility intervals of Trend, Seasonal and Cycle decomposition of deaths in Brazil — 02/25/2020 to 12/06/2020.
Fig. 4
Fig. 4
Number of reported deaths and the estimated growth rate of the Trend in Brazil — 02/25/2020 to 12/06/2020.
Fig. 5
Fig. 5
Posterior mean and 95% credibility intervals of Trend, Seasonal and Cycle decomposition of deaths in the state of São Paulo — 02/25/2020 to 12/06/2020.
Fig. 6
Fig. 6
Number of reported deaths and the estimated growth rate of the Trend in the state of São Paulo — 02/25/2020 to 12/06/2020.
Fig. 7
Fig. 7
osterior mean and 95% credibility intervals of Trend, Seasonal and Cycle decomposition of deaths in the state of Amazonas — 02/25/2020 to 12/06/2020.
Fig. 8
Fig. 8
Number of reported deaths and the estimated growth rate of the Trend in the state of Amazonas — 02/25/2020 to 12/06/2020.
Fig. 9
Fig. 9
Predicted values and observed deaths - Brazil, São Paulo and Amazonas — 02/25/2020 to 12/06/2020.
Fig. 10
Fig. 10
Predicted Values - Estimated trend and moving average filter for the log-transformed count data — 02/25/2020 to 12/06/2020.
Fig. 11
Fig. 11
Posterior mean and 95% credibility interval of Trend, Seasonal and Cycle decomposition - Spatio-Temporal model with common trends, seasonal and cycle components — 02/25/2020 to 12/06/2020. Note: Components estimated with the adjustment for the size of the population in each region (exposure).
Fig. 12
Fig. 12
Posterior mean and 95% credibility interval of Trend - Spatio-temporal model with region specific trends, seasonal and cycle components — 02/25/2020 to 12/06/2020. Note: Components estimated with the adjustment for the size of the population in each region (exposure).
Fig. 13
Fig. 13
Region-specific Trends in Deaths by day by Million inhabitants — 02/25/2020 to 12/06/2020.
Fig. 14
Fig. 14
Posterior mean and 95% credibility interval of Seasonal - Spatio-temporal model with region specific trends, seasonal and cycle components — 02/25/2020 to 12/06/2020. Note: Components estimated with the adjustment for the size of the population in each region (exposure).
Fig. 15
Fig. 15
Posterior mean and 95% credibility interval of Cycle - Spatio-temporal model with region specific trends, seasonal and cycle components — 02/25/2020 to 12/06/2020. Note: Components estimated with the adjustment for the size of the population in each region (exposure).
Fig. A.1
Fig. A.1
Posterior mean of Spatial Random Effects - Spatio-temporal model with region specific trends, seasonal and cycle components — 26/04/2020 and 26/04/2020.

References

    1. Alexandrov T., Bianconcini S., Dagum E.B., Maass P., McElroy T.S. A review of some modern approaches to the problem of trend extraction. Econometric Rev. 2012;31(6):593–624.
    1. Bakka H., Rue H., Fuglstad G.-A., Riebler A., Bolin D., Illian J., Krainski E., Simpson D., Lindgren F. Spatial modeling with R-INLA: A review. WIREs Comput. Stat. 2018;10(6)
    1. Besag J. Spatial interaction and the statistical analysis of lattice systems. J. R. Stat. Soc. Ser. B Stat. Methodol. 1974;36(2):192–236.
    1. Besag J., York J., Mollié A. Bayesian image restoration, with two applications in spatial statistics. Ann. Inst. Statist. Math. 1991;(43):1–59.
    1. Blangiardo M., Cameletti M. Wiley; 2015. Spatial and Spatio-Temporal Models with R-INLA.

Publication types