. 2021 Dec:213:108838.
doi: 10.1016/j.exer.2021.108838. Epub 2021 Nov 11.

Assessment of retinal oxygen metabolism, visual function, thickness and degeneration markers after variable ischemia/reperfusion in rats

Affiliations

Assessment of retinal oxygen metabolism, visual function, thickness and degeneration markers after variable ischemia/reperfusion in rats

Nathanael Matei et al. Exp Eye Res. 2021 Dec.

Abstract

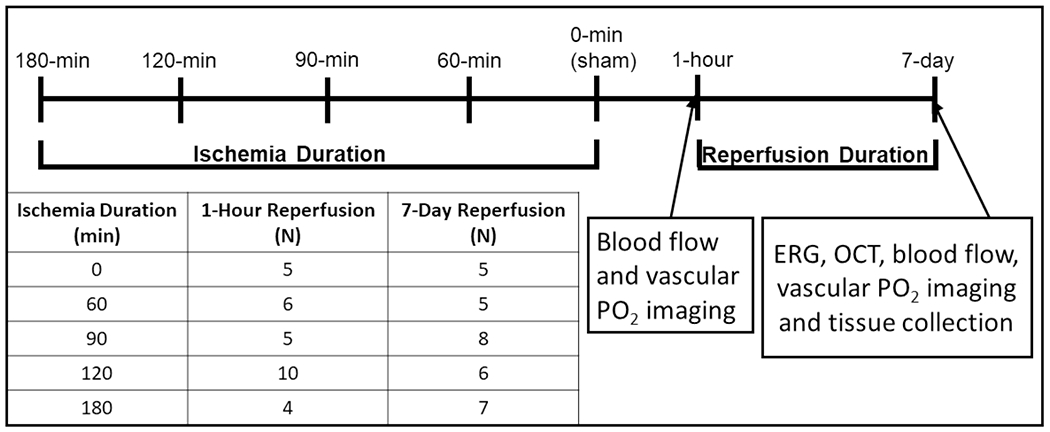
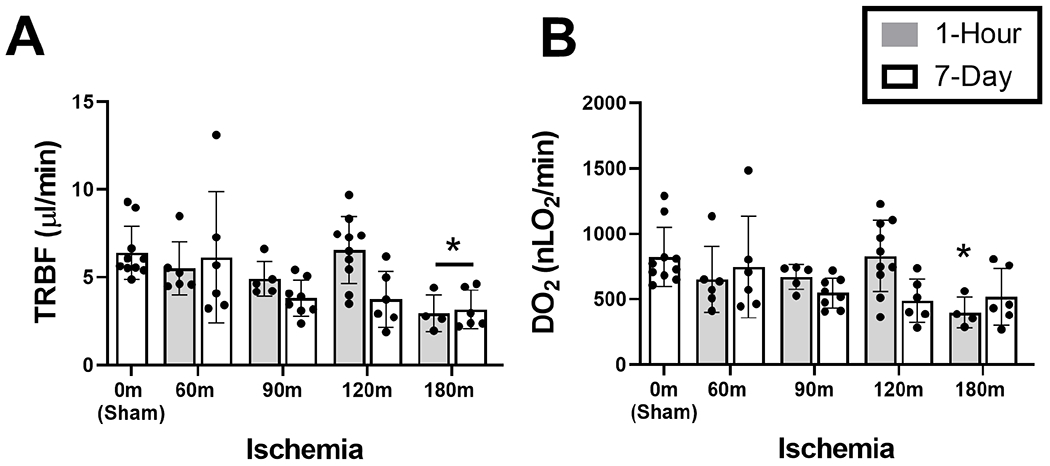
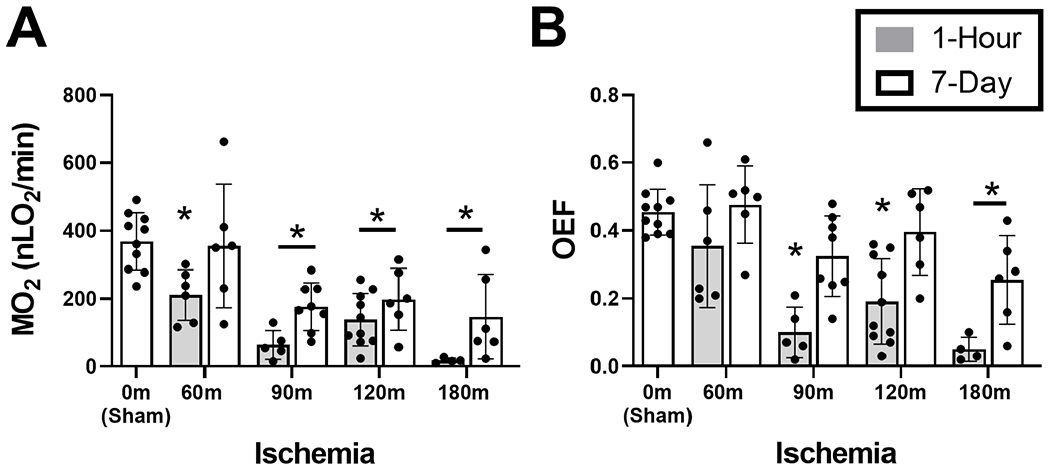
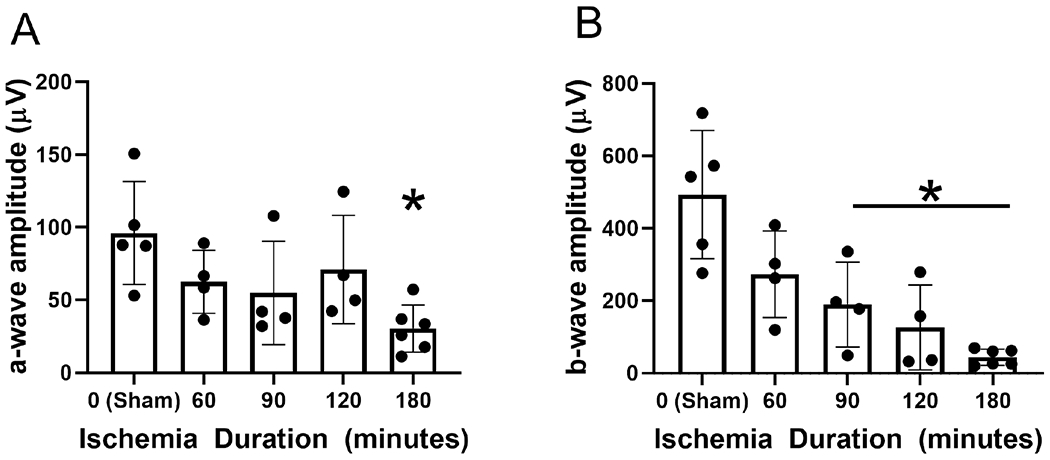
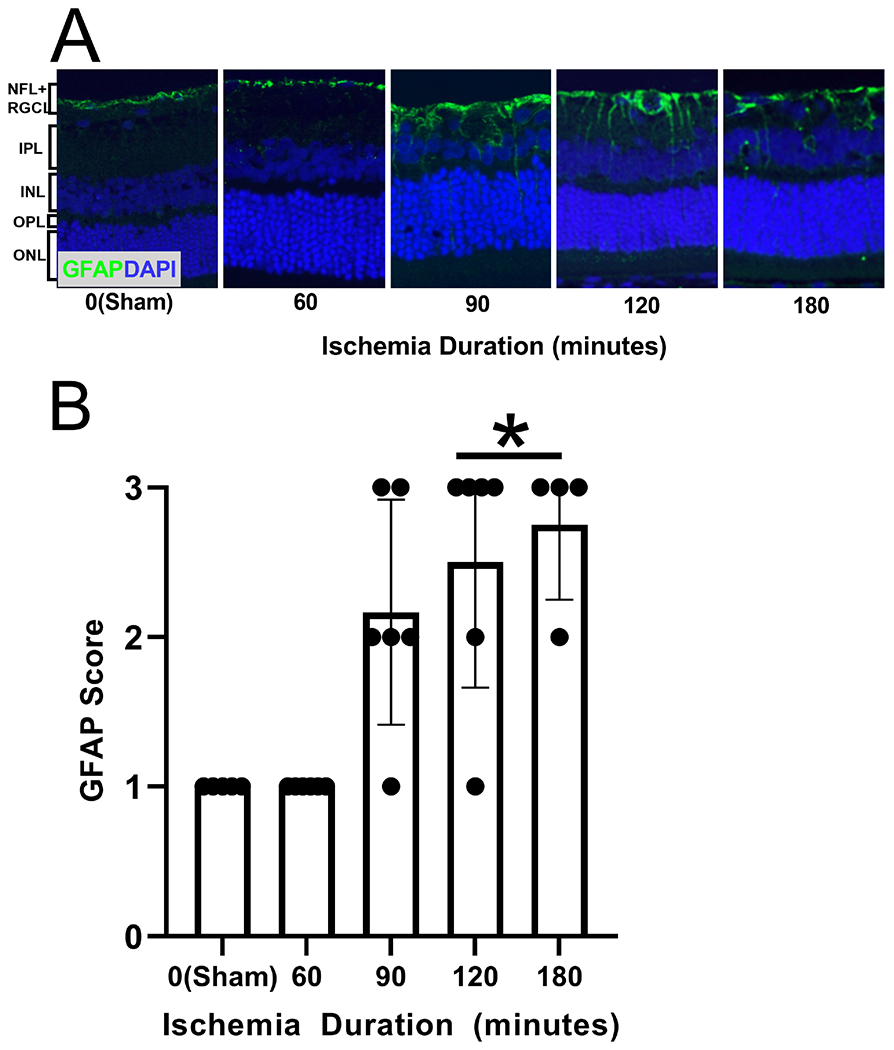
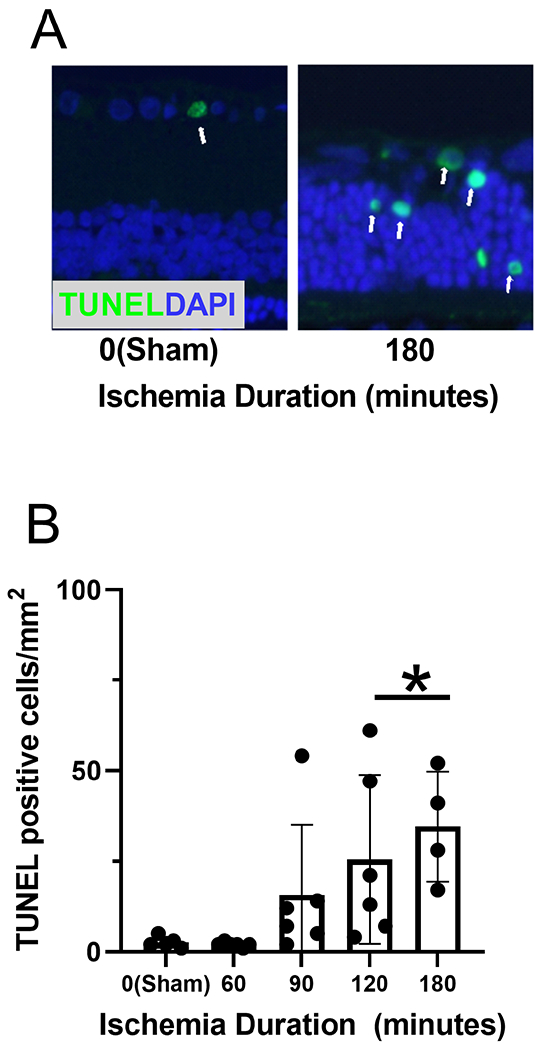
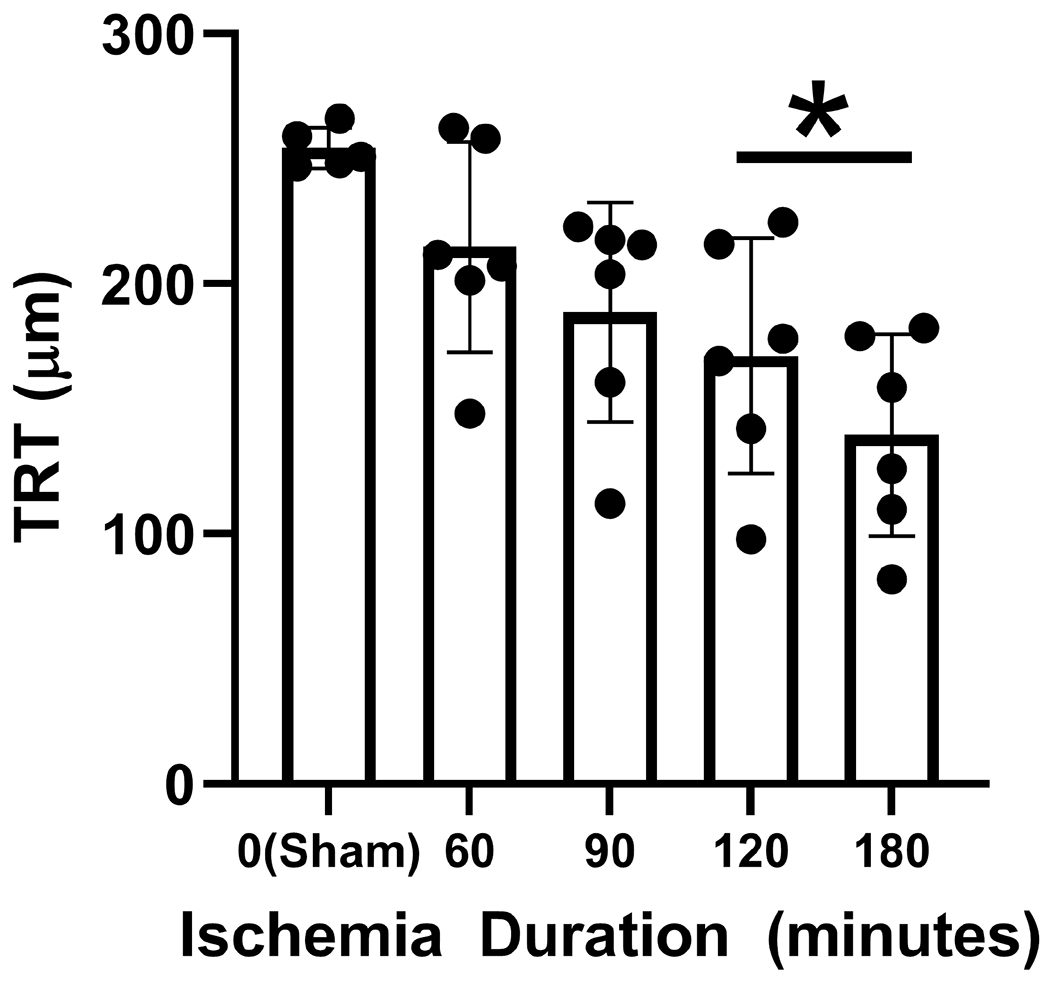
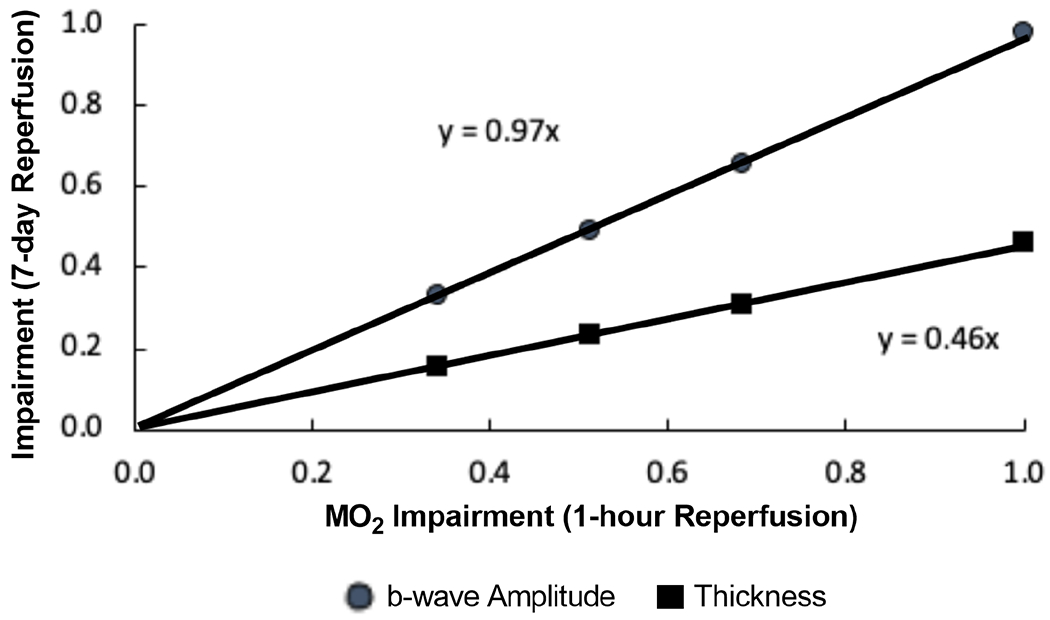
After total retinal ischemia induced experimentally by ophthalmic vessel occlusion followed by reperfusion, studies have reported alterations in retinal oxygen metabolism (MO2), delivery (DO2), and extraction fraction (OEF), as well as visual dysfunction and cell loss. In the current study, under variable durations of ischemia/reperfusion, changes in these oxygen metrics, visual function, retinal thickness, and degeneration markers (gliosis and apoptosis) were assessed and related. Additionally, the prognostic value of MO2 for predicting visual function and retinal thickness outcomes was reported. Sixty-one rats were divided into 5 groups of ischemia duration (0 [sham], 60, 90, 120, or 180 min) and 2 reperfusion durations (1 h, 7 days). Phosphorescence lifetime and blood flow imaging, electroretinography, and optical coherence tomography were performed. MO2 reduction was related to visual dysfunction, retinal thinning, increased gliosis and apoptosis after 7-days reperfusion. Impairment in MO2 after 1-h reperfusion predicted visual function and retinal thickness outcomes after 7-days reperfusion. Since MO2 can be measured in humans, findings from analogous studies may find value in the clinical setting.

Keywords: Ophthalmic vessel occlusion; Retinal ischemia; Retinal oxygen metabolism.


Conflict of interest statement

Disclosure

MS holds a patent for the oxygen imaging technology. The authors have no conflict of interest.

Figures

Figure 1.
Figure 1.. Study design and groups
Diagram of the sequence of various quantities assessed after ophthalmic vessel occlusion (OVO). Rats underwent unilateral OVO or sham surgery. Animals were divided into 5 ischemia duration groups (0 [sham], 60, 90, 120 and 180 minutes) and 2 reperfusion duration (1 hour, 7 days) groups. ERG: Electroretinography, OCT: spectral-domain optical coherence tomography, PO2: vascular oxygen tension.
Figure 2.
Figure 2.. Retinal blood flow and oxygen delivery following ophthalmic vessel occlusion
Measurements of retinal oxygen metrics stratified by ischemia duration of 0 (sham), 60, 90, 120 and 180 minutes, and reperfusion durations of 1 hour or 7 days. (A) Total retinal blood flow (TRBF) and (B) oxygen delivery (DO2). The data are presented as mean ± SD. Different of animals were evaluated in each group. * denotes significant difference compared to the sham group.
Figure 3.
Figure 3.. Retinal oxygen metabolism and extraction fraction following ophthalmic vessel occlusion
Measurements of retinal oxygen metrics stratified by ischemia duration of 0 (sham), 60, 90, 120 and 180 minutes, and reperfusion durations of 1 hour or 7 days. (A) Oxygen metabolism (MO2) and (B) Oxygen extraction fraction (OEF). The data are presented as mean ± SD. Different of animals were evaluated in each group. * denotes significant difference compared to the sham group.
Figure 4.
Figure 4.. Retinal electrophysiological function following ophthalmic vessel occlusion
Measurements of (A) a- and (B) b-wave amplitude after 7 days of reperfusion, stratified by duration of ischemia. The data are presented as mean ± SD. * denotes significant difference compared to the sham group.
Figure 5.
Figure 5.. Retinal gliosis following ophthalmic vessel occlusion
(A) Glial fibrillary acidic protein (GFAP) in representative retinal sections of 0-minute (sham), 60-minute, 90-minute, 120-minute, and 180-minute ischemia duration groups. Active gliosis is depicted as the green color, and cell nuclei are depicted as the blue color (DAPI). (B) GFAP score (gliosis scoring system ranging from 0-3) measured after 7 days of reperfusion, stratified by duration of ischemia. The data are presented as mean ± SD. NFL: nerve fiber layer, RGCL: retinal ganglion cell layer, IPL: inner plexiform layer, INL: inner nuclear layer, OPL: outer plexiform layer, ONL outer nuclear layer. * denotes significant difference compared to the sham group.
Figure 6.
Figure 6.. Retinal apoptotic cells following ophthalmic vessel occlusion
(A) TUNEL staining, depicted as the green color, colocalized with cell nuclei, presented as blue color (DAPI) in representative retinal sections. The white arrows indicate co-expression in the same cell. (B) The number of TUNEL-positive cells measured after 7 days of reperfusion, stratified by duration of ischemia. The data are presented as mean ± SD. * denotes significant difference compared to the sham group.
Figure 7.
Figure 7.. Retinal thickness following ophthalmic vessel occlusion
Total retina thickness (TRT) measured after 7 days of reperfusion, stratified by duration of ischemia. The data are presented as mean ± SD. * denotes significant difference compared to the sham group.
Figure 8.
Figure 8.. Relationships of MO2, b-wave amplitude and total retinal thickness impairment indices following ophthalmic vessel occlusion
Impairment indices of b-wave amplitude and total retinal thickness (TRT) after 7-days of reperfusion are plotted as a function of MO2 impairment index after 1-hour reperfusion.

Similar articles

Cited by

References

    1. Aanerud J, Borghammer P, Chakravarty MM, Vang K, Rodell AB, Jonsdottir KY, Moller A, Ashkanian M, Vafaee MS, Iversen P, Johannsen P, Gjedde A, 2012. Brain energy metabolism and blood flow differences in healthy aging. J Cereb Blood Flow Metab 32, 1177–1187. - PMC - PubMed
    1. Ames A 3rd, Li YY, Heher EC, Kimble CR, 1992. Energy metabolism of rabbit retina as related to function: high cost of Na+ transport. J Neurosci 12, 840–853. - PMC - PubMed
    1. An H, Ford AL, Chen Y, Zhu H, Ponisio R, Kumar G, Shanechi AM, Khoury N, Vo KD, Williams J, Derdeyn CP, Diringer MN, Panagos P, Powers WJ, Lee JM, Lin W, 2015. Defining the Ischemic Penumbra using Magnetic Resonance Oxygen Metabolic Index. Stroke 46, 982–988. - PMC - PubMed
    1. Behzadian MA, Wang XL, Windsor LJ, Ghaly N, Caldwell RB, 2001. TGF-beta increases retinal endothelial cell permeability by increasing MMP-9: possible role of glial cells in endothelial barrier function. Invest Ophthalmol Vis Sci 42, 853–859. - PubMed
    1. Bhisitkul RB, Robinson GS, Moulton RS, Claffey KP, Gragoudas ES, Miller JW, 2005. An antisense oligodeoxynucleotide against vascular endothelial growth factor in a nonhuman primate model of iris neovascularization. Arch Ophthalmol 123, 214–219. - PubMed

Publication types

MeSH terms