. 2021 Dec 21;120(24):5553-5563.
doi: 10.1016/j.bpj.2021.11.014. Epub 2021 Nov 11.

Differences in local anaesthetic and antiepileptic binding in the inactivated state of human sodium channel Nav1.4

Affiliations

Differences in local anaesthetic and antiepileptic binding in the inactivated state of human sodium channel Nav1.4

Amanda Buyan et al. Biophys J. .

Abstract

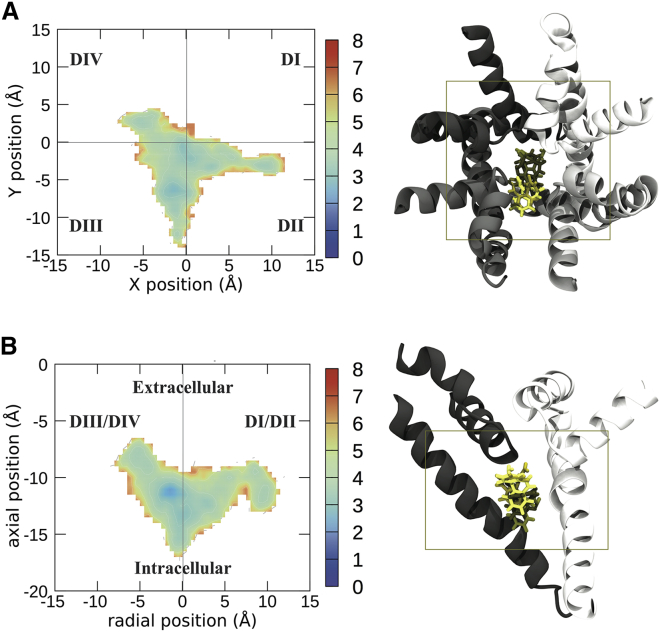
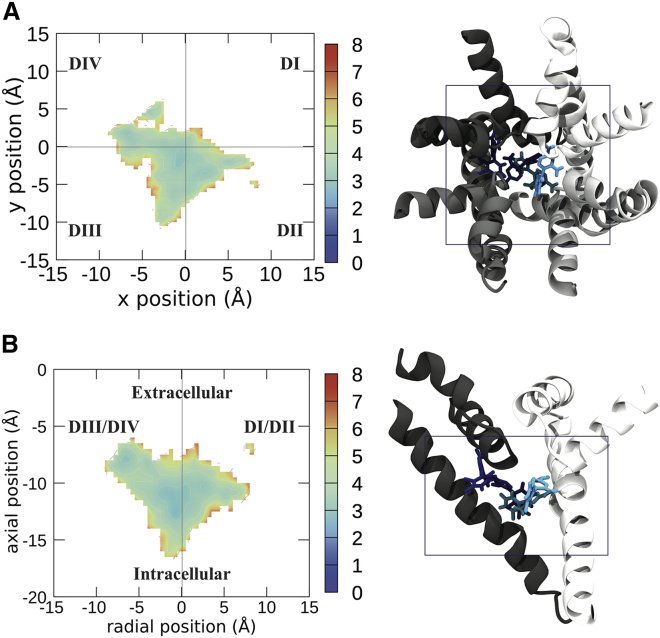
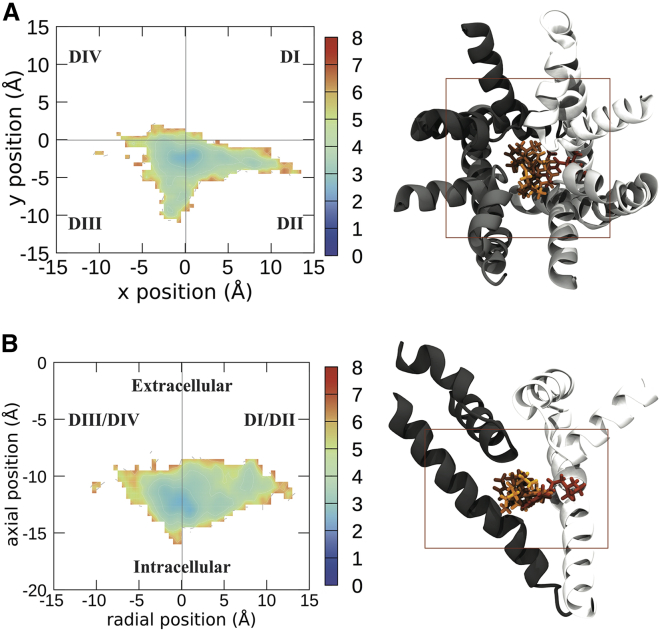
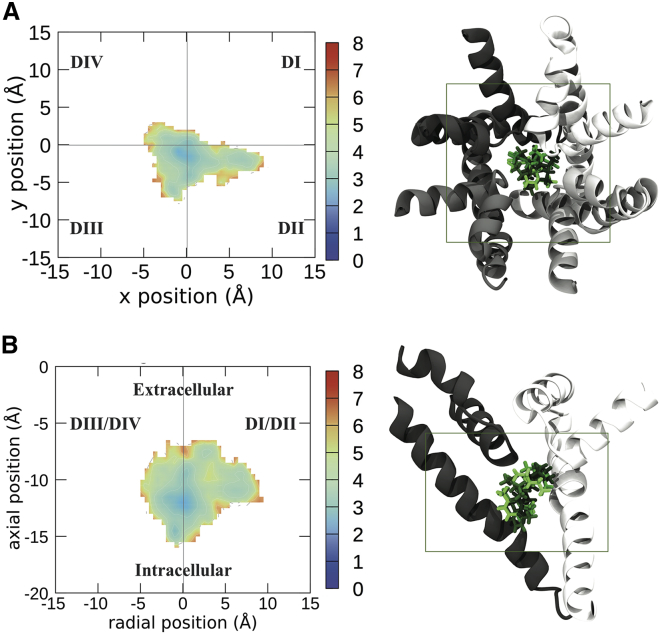
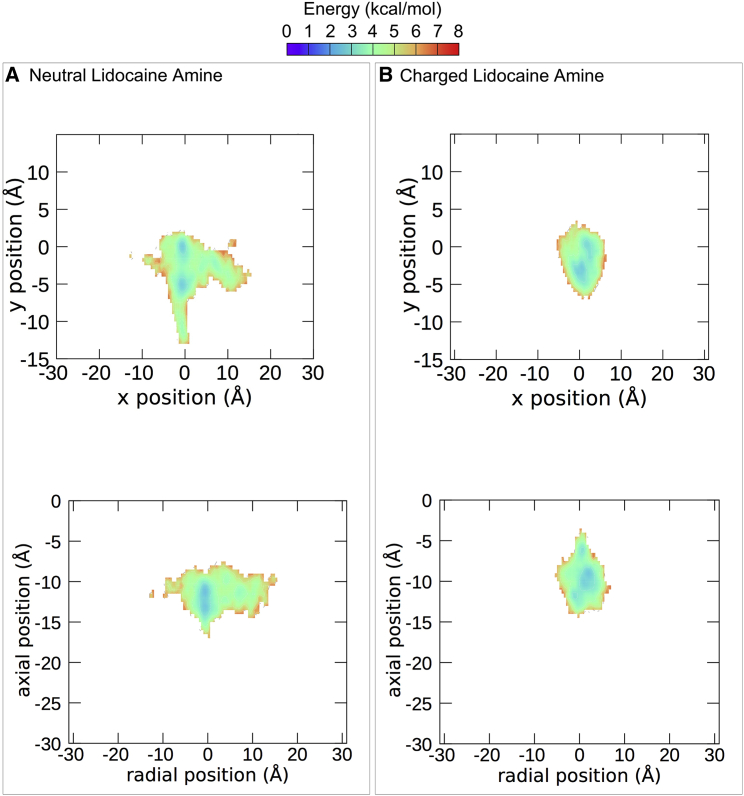
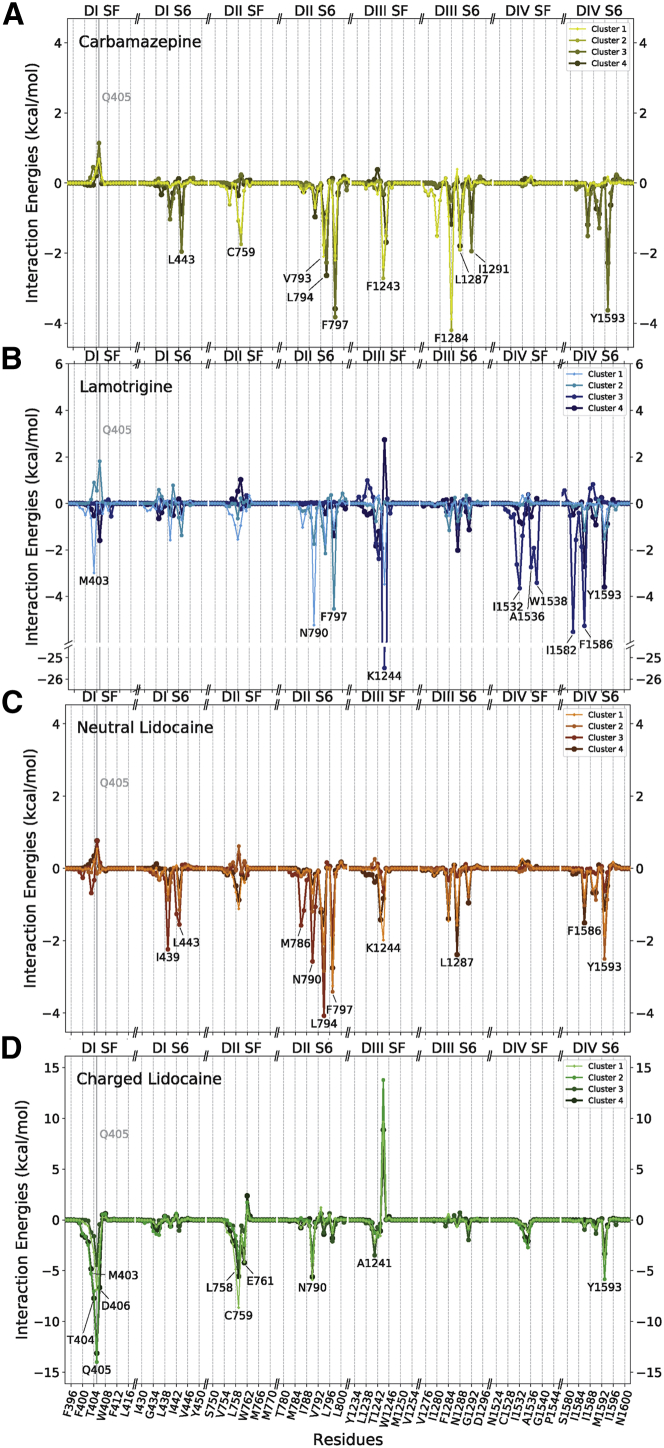
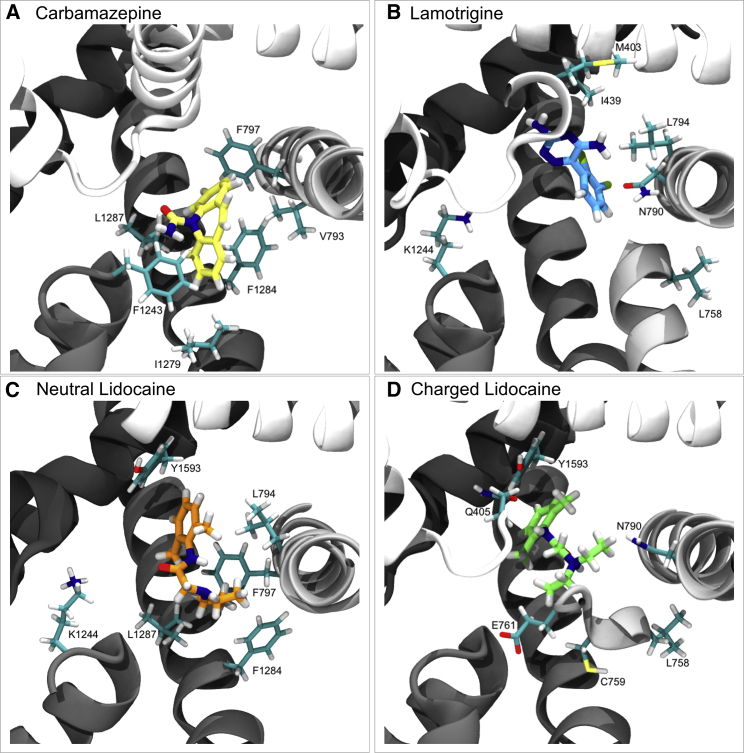
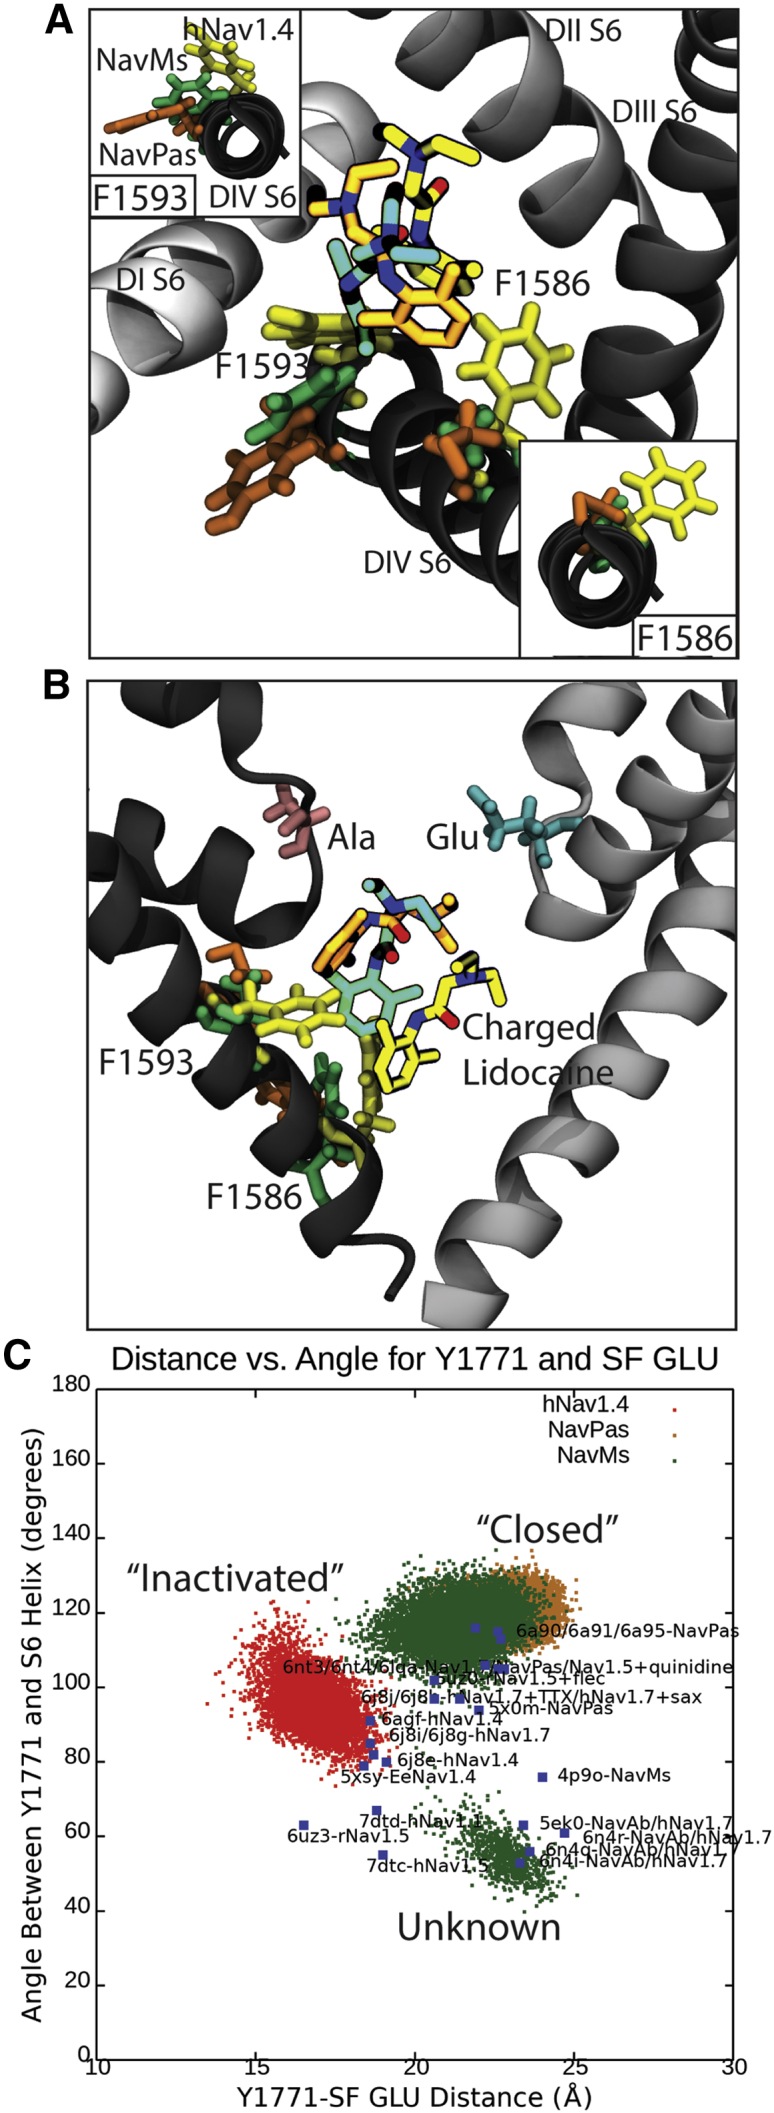
Voltage-gated sodium channels play a vital role in nerve and muscle cells, enabling them to encode and transmit electrical signals. Currently, there exist several classes of drugs that aim to inhibit these channels for therapeutic purposes, including local anesthetics, antiepileptics and antiarrhythmics. However, sodium-channel-inhibiting drugs lack subtype specificity; instead, they inhibit all sodium channels in the human body. Improving understanding of the mechanisms of binding of existing nonselective drugs is important in providing insight into how subtype-selective drugs could be developed. This study used molecular dynamics simulations to investigate the binding of the antiepileptics carbamazepine and lamotrigine and the local anesthetic lidocaine in neutral and charged states to the recently resolved human Nav1.4 channel. Replica exchange solute tempering was used to enable greater sampling of each compound within the pore. It was found that all four compounds show similarities in their binding sites within the pore. However, the positions of the carbamazepine and lamotrigine did not occlude the center of the pore but preferentially bound to homologous domain DII and DIII. The charged and neutral forms of lidocaine positioned themselves more centrally in the pore, with more common interactions with DIV. The best localized binding site was for charged lidocaine, whose aromatic moiety interacted with Y1593, whereas the amine projected toward the selectivity filter. Comparisons with our previous simulations and published structures highlight potential differences between tonic and use-dependent block related to conformational changes occurring in the pore.


Figures

Figure 1
Figure 1
Free energy landscapes of the center of mass of CBZ visualized from the top of the sodium channel (A) and the side (B). To the right of the energy landscapes in (A) and (B) are representative images of the top four clusters imaged from the same orientation, with the boundaries of the free energy plot noted by the box. Free energies are in units of kcal /mol. Each domain of the protein is shown in a different shade of gray, with DI represented in white and DII–DIV represented in progressively darker shades of gray. CBZ is shown in licorice, with the top binding pose in the lightest color and the other binding poses in darker colors in descending order of prevalence. To see this figure in color, go online.
Figure 2
Figure 2
Free energy landscapes of the center of mass of LMT visualized from the top of the sodium channel (A) and the side (B). To the right of the energy landscapes in (A) and (B) are representative images of the top four clusters imaged from the same orientation, with the boundaries of the free energy plot noted by the box. Free energies are in kilocalories per mole. Each domain of the protein is shown in a different shade of gray, with DI represented in white and DII–DIV represented in progressively darker shades of gray. LMT is shown in licorice, with the top cluster/binding pose in the lightest color and the other binding poses in darker colors in descending order of prevalence. To see this figure in color, go online.
Figure 3
Figure 3
Free energy landscapes of the center of mass of LDN visualized from the top of the sodium channel (A) and the side (B). To the right of the energy landscapes in (A) and (B) are representative images of the top four clusters imaged from the same orientation, with the boundaries of the free energy plot noted by the box. Free energies are in kilocalories per mole. Each domain of the protein is shown in a different shade of gray, with DI represented in white and DII–DIV represented in progressively darker shades of gray. LDN is shown in licorice, with the top cluster/binding pose in the lightest color and the other binding poses in darker colors in descending order of prevalence. To see this figure in color, go online.
Figure 4
Figure 4
Free energy landscapes of the center of mass of LDC visualized from the top of the sodium channel (A) and the side (B). To the right of the energy landscapes in (A) and (B) are representative images of the top four clusters imaged from the same orientation, with the boundaries of the free energy plot noted by the box. Free energies are in kilocalories per mole. Each domain of the protein is shown in a different shade of gray, with DI represented in white and DII–DIV represented in progressively darker shades of gray. LDC is shown in licorice, with the top cluster/binding pose in the lightest color and the other binding poses in darker colors in descending order of prevalence. To see this figure in color, go online.
Figure 5
Figure 5
Free energy landscapes of the center of mass of the amine in LDN (A) and LDC (B). The top graphs show the pore from the same orientation as the top energy landscapes in Figs. 1, 2, 3, and 4 (top). The bottom graphs show the pore from the same orientation as the bottom energy landscapes in Figs. 1, 2, 3, and 4 (bottom). To see this figure in color, go online.
Figure 6
Figure 6
Average interaction energy of the four most populous clusters of each compound with the Nav1.4 channel. The compound-protein interaction energy is shown for CBZ (A), LMT (B), LDN (C), and LDC (D) in kilocalories per mole. The 10 amino acid residues with the most negative energy of interaction with the drugs were singled out and labeled. Only residues from the SF and segment S6 were plotted. The x axis of the plot is broken up into eight sections, each representing either part of the SF or S6 segment of each of the four domains. The y scale differs between the graphs, but all graphs are plotted with 0 kcal/mol at the center. To see this figure in color, go online.
Figure 7
Figure 7
Binding of each compound to Nav1.4. Representative snapshots from the top cluster for each compound. The compounds of interest are shown in licorice with heteroatoms colored according to their type and carbons colored according to the compound’s identity: yellow for CBZ (A), blue for LMT (B), orange for LDN (C), and green for LDC (D). The protein backbone is depicted in new cartoon, with DI represented in white and DII–DIV represented in progressively darker shades of gray. The six amino acid residues with the most negative energy of interaction with each compound are depicted in licorice, and their atoms are colored according to their type. Carbons (excluding those in the compounds of interest) are cyan, oxygens are red, nitrogens are dark blue, sulfurs are yellow, chlorines are green-yellow, and hydrogens are white. To see this figure in color, go online.
Figure 8
Figure 8
Binding of charged lidocaine (LDC) to human Nav1.4, NavPas, and NavMs, along with the role of F1583 and Y1593 in binding. (A) Representative snapshots from the top cluster for each channel, with the orientation of Y1593 and equivalent residues shown in the inset in the top left and the orientation of F1586 and equivalent residues shown in the bottom right. (B) A 90° rotation of figure (A) showing positions of Y1593, F1586, and lidocaine with respect to the SF. The E (Glu) and A (Ala) of the DEKA motif are shown in blue and pink licorice. Residues associated with hNav1.4 are in yellow, NavMs in green, and NavPas in orange. The protein is shown in different shades of gray, for which DI is the lightest and DIV is the darkest. (C) Angle between Y1593 and equivalents versus distance between Y1593 and Glu in the SF. The hNav1.4 simulation is in red, the NavPas simulation is in yellow, and the NavMs simulation in in green. The blue dots are all known crystal structures of eukaryotic channels or chimeras between eukaryotic and prokaryotic channels. To see this figure in color, go online.

Similar articles

Cited by

References

    1. Ahern C.A., Payandeh J., et al. Chanda B. The hitchhiker’s guide to the voltage-gated sodium channel galaxy. J. Gen. Physiol. 2016;147:1–24. - PMC - PubMed
    1. Andavan G.S., Lemmens-Gruber R. Voltage-gated sodium channels: mutations, channelopathies and targets. Curr. Med. Chem. 2011;18:377–397. - PubMed
    1. Shen H., Zhou Q., et al. Yan N. Structure of a eukaryotic voltage-gated sodium channel at near-atomic resolution. Science. 2017;355:eaal4326. - PubMed
    1. Yan Z., Zhou Q., et al. Yan N. Structure of the Nav1.4-β1 complex from electric eel. Cell. 2017;170:470–482.e11. - PubMed
    1. Pan X., Li Z., et al. Yan N. Structure of the human voltage-gated sodium channel Nav1.4 in complex with β1. Science. 2018;362:eaau2486. - PubMed

Publication types

MeSH terms

LinkOut - more resources