. 2022 Mar 2;30(3):1329-1342.
doi: 10.1016/j.ymthe.2021.11.007. Epub 2021 Nov 11.

An RNAi therapeutic targeting hepatic DGAT2 in a genetically obese mouse model of nonalcoholic steatohepatitis

Affiliations

An RNAi therapeutic targeting hepatic DGAT2 in a genetically obese mouse model of nonalcoholic steatohepatitis

Batuhan Yenilmez et al. Mol Ther. .

Abstract

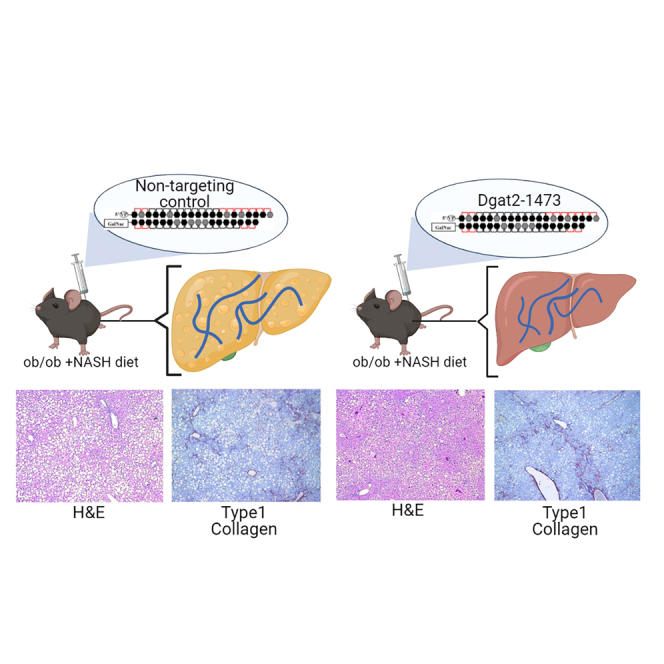
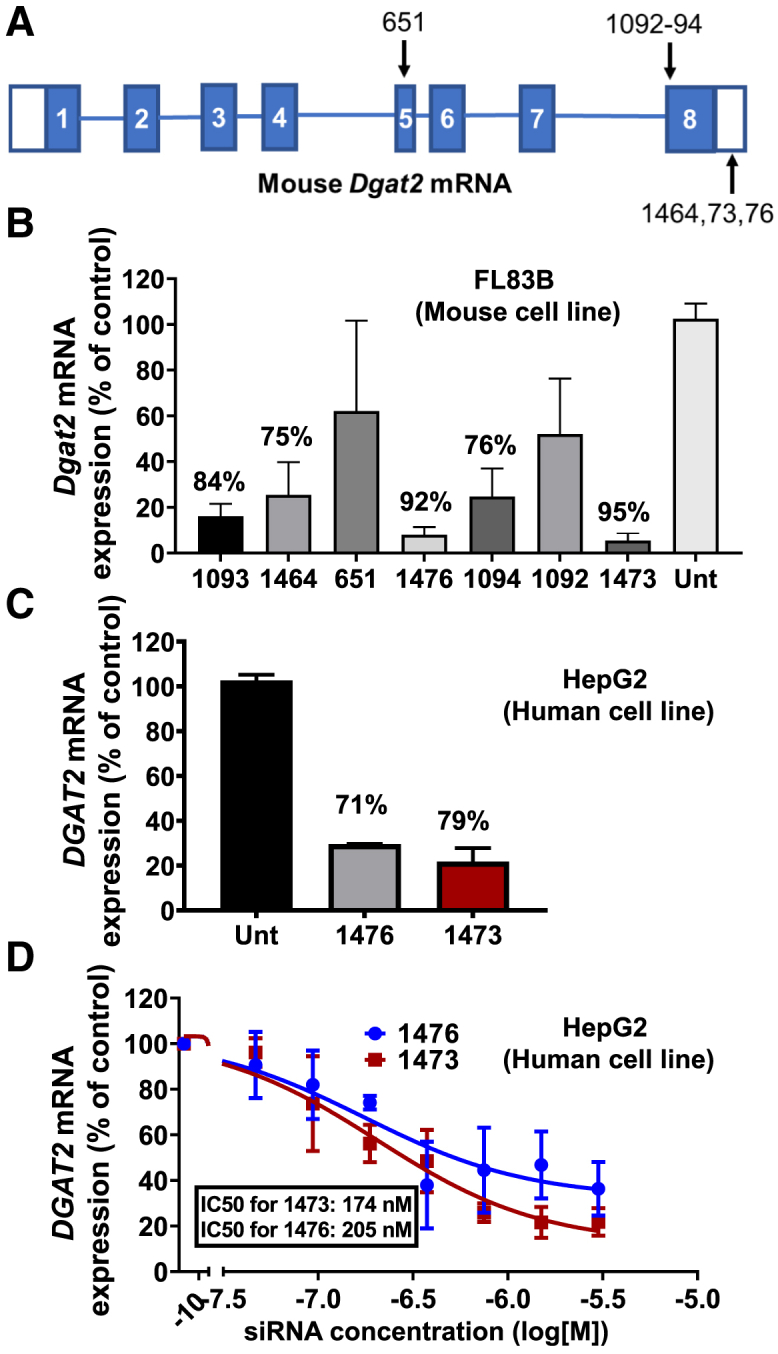
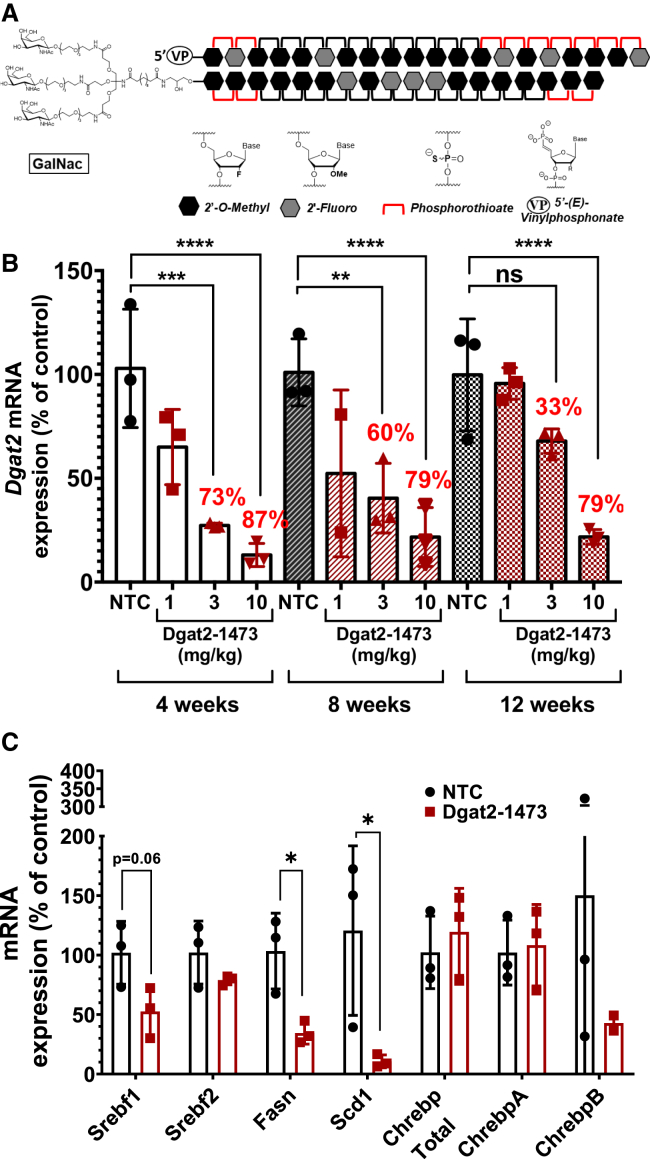
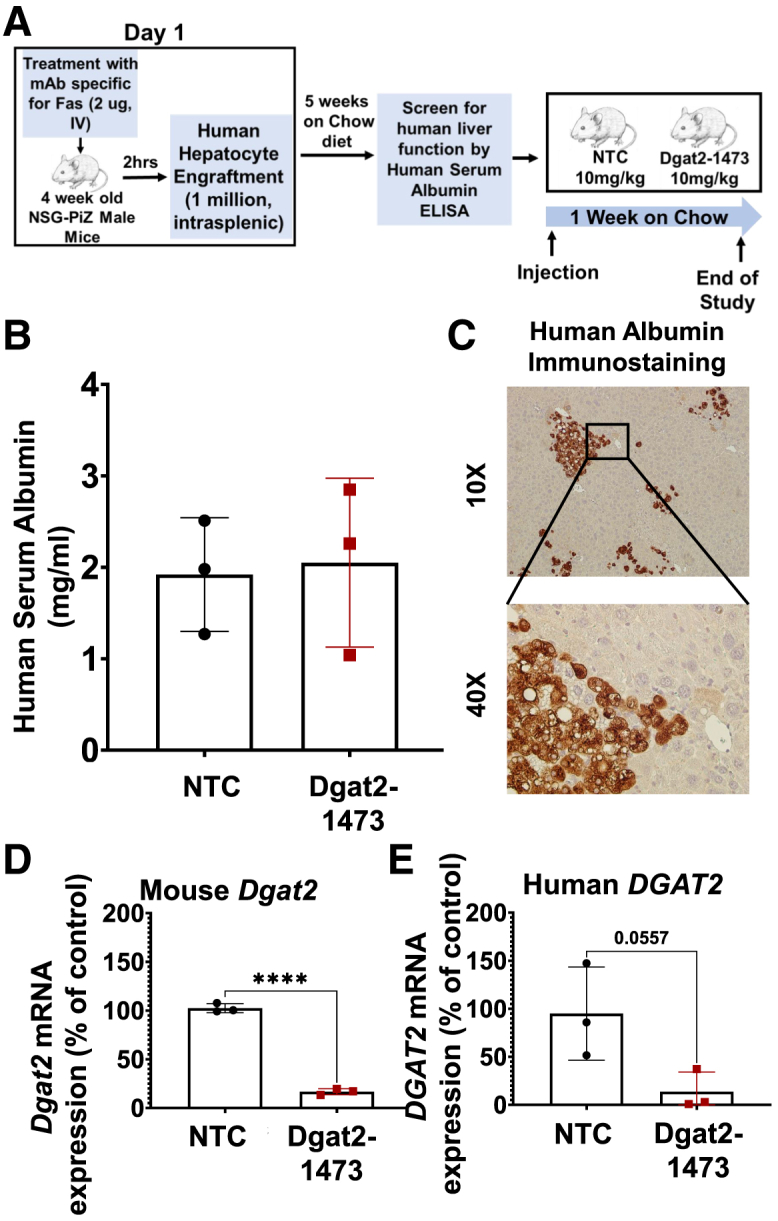
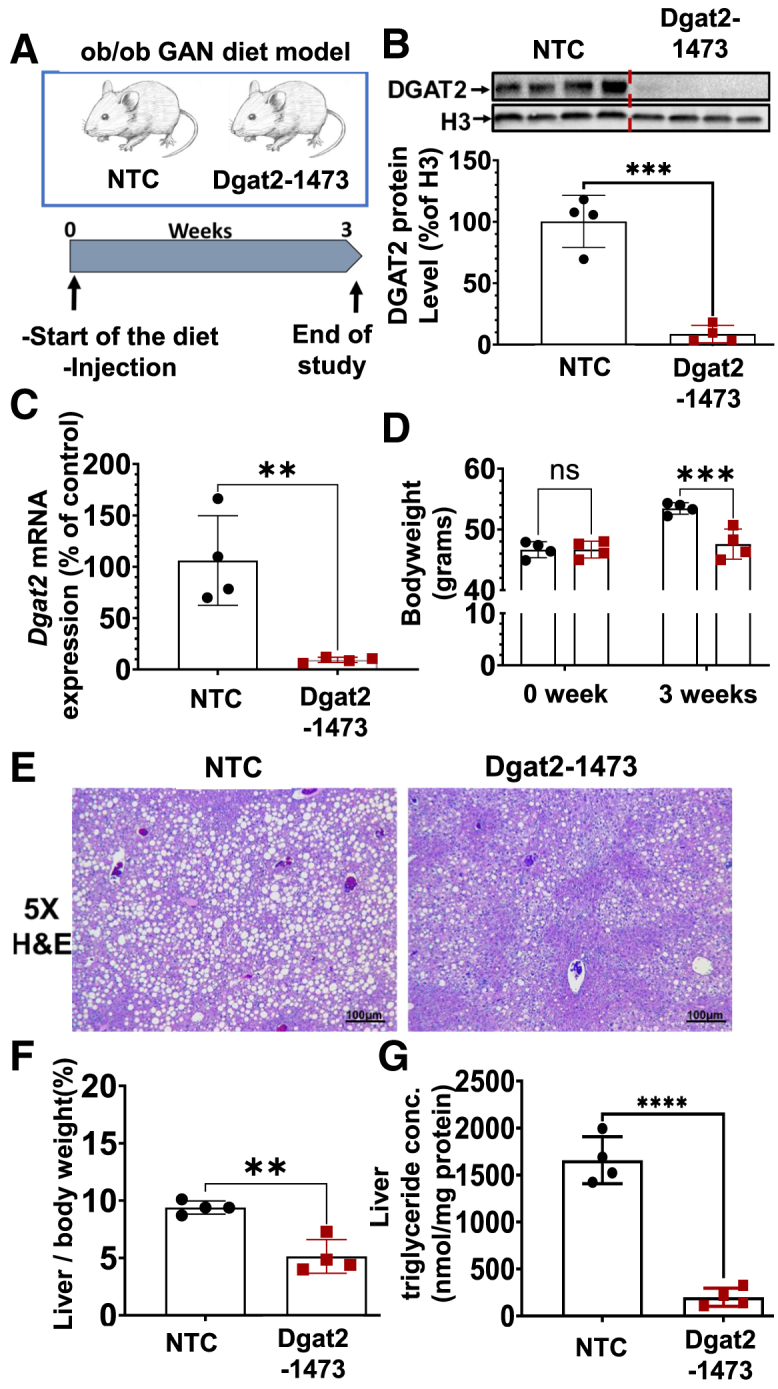
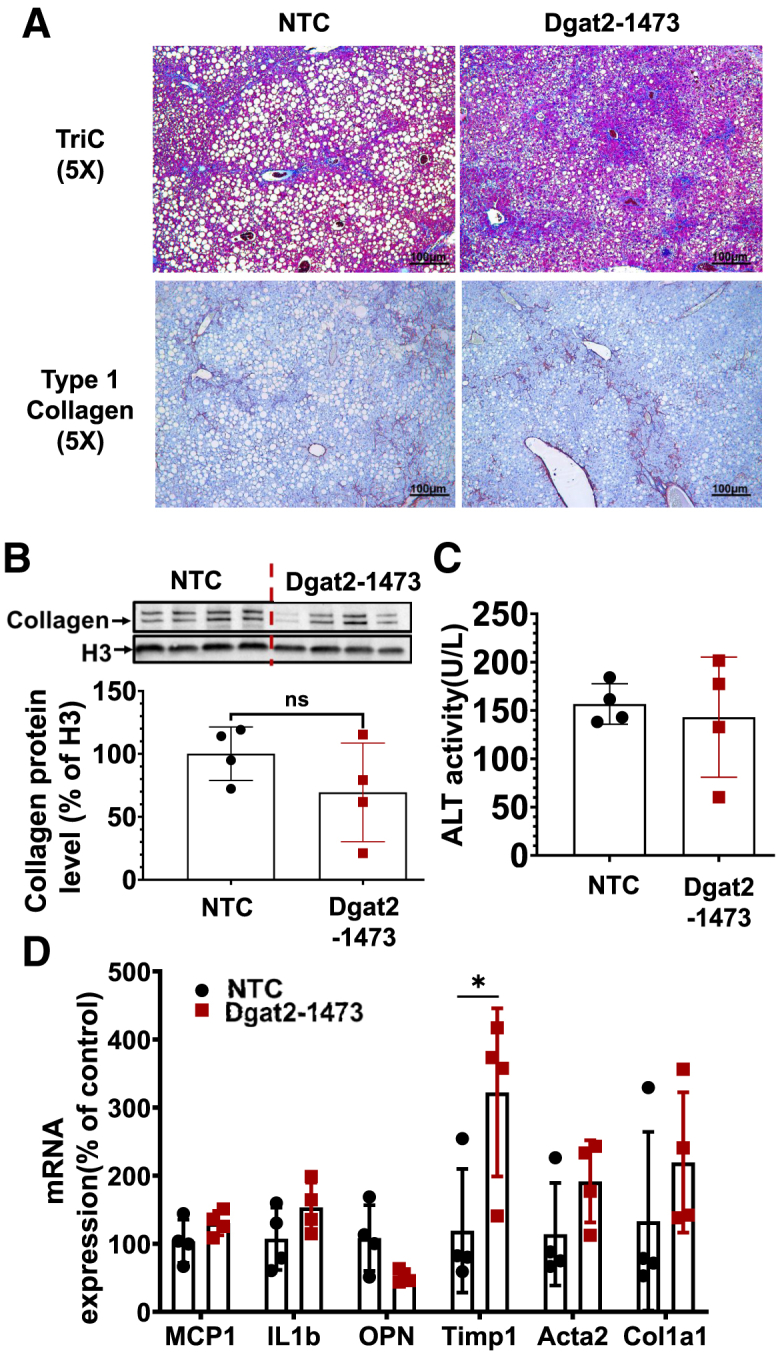
Nonalcoholic steatohepatitis (NASH) is a severe liver disorder characterized by triglyceride accumulation, severe inflammation, and fibrosis. With the recent increase in prevalence, NASH is now the leading cause of liver transplant, with no approved therapeutics available. Although the exact molecular mechanism of NASH progression is not well understood, a widely held hypothesis is that fat accumulation is the primary driver of the disease. Therefore, diacylglycerol O-acyltransferase 2 (DGAT2), a key enzyme in triglyceride synthesis, has been explored as a NASH target. RNAi-based therapeutics is revolutionizing the treatment of liver diseases, with recent chemical advances supporting long-term gene silencing with single subcutaneous administration. Here, we identified a hyper-functional, fully chemically stabilized GalNAc-conjugated small interfering RNA (siRNA) targeting DGAT2 (Dgat2-1473) that, upon injection, elicits up to 3 months of DGAT2 silencing (>80%-90%, p < 0.0001) in wild-type and NSG-PiZ "humanized" mice. Using an obesity-driven mouse model of NASH (ob/ob-GAN), Dgat2-1473 administration prevents and reverses triglyceride accumulation (>85%, p < 0.0001) without increased accumulation of diglycerides, resulting in significant improvement of the fatty liver phenotype. However, surprisingly, the reduction in liver fat did not translate into a similar impact on inflammation and fibrosis. Thus, while Dgat2-1473 is a practical, long-lasting silencing agent for potential therapeutic attenuation of liver steatosis, combinatorial targeting of a second pathway may be necessary for therapeutic efficacy against NASH.

Keywords: NAFLD; NASH; Non-alcoholic steatohepatitis; Oligonucleotide therapy; RNAi therapeutics; non-alcoholic fatty liver disease.


Figures

None
Graphical abstract
Figure 1
Figure 1
Identification of two potent chemically modified siRNAs that silence both human and mouse Dgat2 transcripts in cultured hepatocytes (A) Targeted locations on the mouse Dgat2 transcript by the candidate compounds. (B) FL83B hepatocytes were treated with siRNA compounds (1.5 μM) for 72 h prior to analysis of Dgat2 mRNA levels to identify the most active siRNA sequences. (C) HepG2 human hepatocytes were treated with two best siRNA compounds (1.5 μM), from the previous mouse cell line screening, for 72 h prior to analysis of human DGAT2 mRNA levels to identify the most active siRNA sequences. (D) Dose response relationships for the two siRNAs (compounds 1476 and 1473) that showed the strongest silencing using human HepG2 cell line. The IC50 values were determined by using eight point serially diluted concentrations of the compounds starting from 1.5 μM.
Figure 2
Figure 2
Dgat2-1473 provides strong silencing for at least 12 weeks after a single subcutaneous injection in the livers of male C57BL/6 mice (A) Representative cartoon of chemically modified, GalNAc-conjugated siRNAs that were used for in vivo studies. (B) Dose response relationships and longevity of silencing elicited by Dgat2-1473 that was subcutaneously injected into wild-type C57BL/6 mice (n = 3) on chow diet. The mice were treated with the indicated doses (10, 3, 1 mg/kg) of Dgat2-1473 or NTC compound (10 mg/kg) and sacrificed at the indicated time points (4, 8, 12 weeks) after injections. The mRNA levels of Dgat2 were normalized against the NTC group and 18S was used as the housekeeping gene for the calculations. (C) DNL-related gene expression changes upon Dgat2 silencing in wild-type C57BL6 mice. ∗p < 0.05, ∗∗p < 0.005.
Figure 3
Figure 3
Dgat2-1473 silences the human Dgat2 transcript in human hepatocyte-engrafted NSG-PiZ mice (A) Experimental procedure for generating human hepatocyte-engrafted NSG-PiZ mouse model. (B) Human serum albumin levels in the plasma of these engrafted mice were determined after being randomized from the study groups. (C) Immunostaining of liver sections for human albumin for confirmation of engraftment. (D) Mouse Dgat2 mRNA levels 1 week after injection (E) HumanDGAT2 mRNA levels 1 week after the injection of mice(n = 3) with Dgat2-1473. ∗p < 0.05, ∗∗p < 0.005, ∗∗∗p < 0.0005, ∗∗∗∗p < 0.00005.
Figure 4
Figure 4
Single subcutaneous injection of Dgat2-1473 alleviates liver fat accumulation and decreased liver-to-body weight ratio in a genetically obese NASH mouse model (A) Ten-week-old male genetically obese C57BL6/J (ob/ob) mice (n = 4) were injected subcutaneously with either NTC (10 mg/kg) or Dgat2-1473 (10 mg/kg) and provided a NASH-inducing diet (GAN diet) for 3 weeks. After 3 weeks, mice were sacrificed. (B) DGAT2 protein levels in liver 3 weeks after NTC or Dgat2-1473 injection. (C) Dgat2 mRNA level changes in liver in response to either Dgat2-1473 or NTC. (D) Body-weight difference comparison (start versus 3 weeks on GAN diet). (E) Histological comparison of liver H&E sections of the groups. (F) Liver weight to body weight ratio between groups. (G) Liver total triglyceride measurements via lipidomics. ∗p < 0.05, ∗∗p < 0.005, ∗∗∗p < 0.0005.
Figure 5
Figure 5
Dgat2 silencing by Dgat2-1473 elicits significant changes in many pathways and genes in the livers of genetically obese mice with NASH DEBrowser data that came from the DolphinNext RNA-seq pipeline (Figure 5) was first filtered to eliminate genes whose expression level was not above 10 in any sample, and then DESeq2 was employed to determine DE genes, using an adjusted p value of 0.05 as the cutoff and requiring at least a 1.5-fold change, up or down. The list of DE genes was then analyzed using the enrichGO function in the clusterProfiler package. The pathways were simplified using its simplify function with options of p value cutoff of 0.05. This was followed by manually specified merging of similar pathways to produce heatmaps. DE genes were clustered according to the pathways they were involved in, and the pathways (color coded) were displayed on the left column alongside the heatmap. Color scheme for the DE gene presentation was produced by Z-scoring method (−2 to +2 standard deviation from the mean) on expression levels normalized for sample depth by DESeq2. Heatmap representation of (A) upregulated and (B) downregulated DE genes clustered by the pathways in which they are involved.
Figure 6
Figure 6
Targeting liver DGAT2 by Dgat2-1473 in genetically obese NASH mice causes downregulation of major genes in the fatty acid metabolism pathway, correlating with a decrease in SREBP1c processing and ChREBP protein expression (A) Heatmap representation of DE liver genes in fatty acid metabolism pathway (major DNL genes in the pathway highlighted by the black arrows). (B) qPCR confirmation of the RNA-seq data for important genes in fatty acid metabolism pathway. ∗p < 0.05, ∗∗p < 0.005, ∗∗∗p < 0.0005, ∗∗∗∗p < 0.00005. (C) Measurements of both unprocessed (cytosolic) and processed (nuclear) SREBP1c protein levels in liver. (D) ChREBP protein level measurements in liver. ∗p < 0.05, ∗∗p < 0.005, ∗∗∗p < 0.0005, ∗∗∗∗p < 0.00005.
Figure 7
Figure 7
Dgat2 silencing in liver of genetically obese NASH mice causes downregulation of major metabolic pathways Heatmap representation of DE genes in (A) acyl-CoA metabolism, (B) cholesterol metabolism, and (C) carbohydrate metabolism (major genes in the pathways that are involved with the synthesis are highlighted by the black arrows).
Figure 8
Figure 8
Dgat2 silencing does not significantly alleviate the inflammation and fibrosis in the liver of genetically obese NASH mice Ten-week-old genetically obese ob/ob mice (n = 4) were injected subcutaneously with either NTC (10 mg/kg) or Dgat2-1473 (10 mg/kg) and provided a NASH-inducing diet (GAN diet) for 3 weeks. After 3 weeks, mice were sacrificed. (A) Histological examination of fibrosis via trichrome staining and type 1 collagen IHC. (B) Type I collagen protein levels in whole-liver tissue. (C) Plasma ALT measurements. (D) Inflammation and fibrosis related gene expression levels. ∗p < 0.05, ∗∗p < 0.005.

Similar articles

Cited by

References

    1. Younossi Z.M., Blissett D., Blissett R., Henry L., Stepanova M., Younossi Y., Racila A., Hunt S., Beckerman R. The economic and clinical burden of nonalcoholic fatty liver disease in the United States and Europe. Hepatology. 2016;64:1577–1586. - PubMed
    1. Younossi Z.M., Koenig A.B., Abdelatif D., Fazel Y., Henry L., Wymer M. Global epidemiology of nonalcoholic fatty liver disease—meta-analytic assessment of prevalence, incidence, and outcomes. Hepatology. 2016;64:73–84. - PubMed
    1. Alexander M., Loomis A.K., van der Lei J., Duarte-Salles T., Prieto-Alhambra D., Ansell D., Pasqua A., Lapi F., Rijnbeek P., Mosseveld M., et al. Risks and clinical predictors of cirrhosis and hepatocellular carcinoma diagnoses in adults with diagnosed NAFLD: real-world study of 18 million patients in four European cohorts. BMC Med. 2019;17:95. doi: 10.1186/s12916-019-1321-x. - DOI - PMC - PubMed
    1. Lomonaco R., Ortiz-Lopez C., Orsak B., Webb A., Hardies J., Darland C., Finch J., Gastaldelli A., Harrison S., Tio F., Cusi K. Effect of adipose tissue insulin resistance on metabolic parameters and liver histology in obese patients with nonalcoholic fatty liver disease. Hepatology. 2012;55:1389–1397. - PubMed
    1. Estes C., Razavi H., Loomba R., Younossi Z., Sanyal A.J. Modeling the epidemic of nonalcoholic fatty liver disease demonstrates an exponential increase in burden of disease. Hepatology. 2018;67:123–133. - PMC - PubMed

Publication types