

Single-cell RNA Sequencing Reveals Thoracolumbar Vertebra Heterogeneity and Rib-genesis in Pigs
- PMID: 34775075
- PMCID: PMC8864194
- DOI: 10.1016/j.gpb.2021.09.008
Single-cell RNA Sequencing Reveals Thoracolumbar Vertebra Heterogeneity and Rib-genesis in Pigs
Abstract
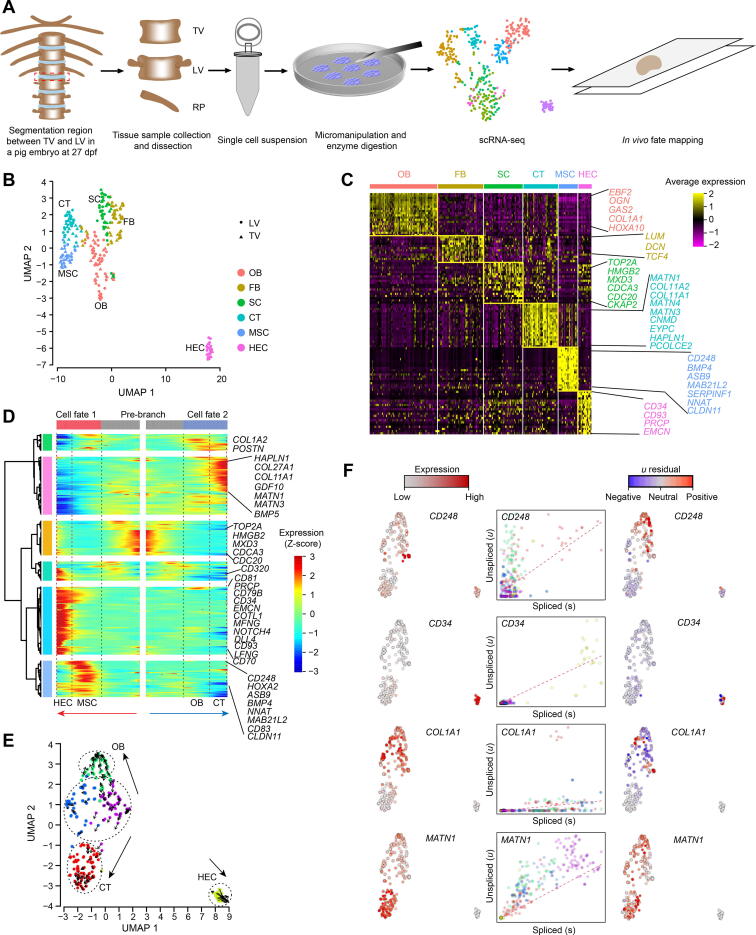
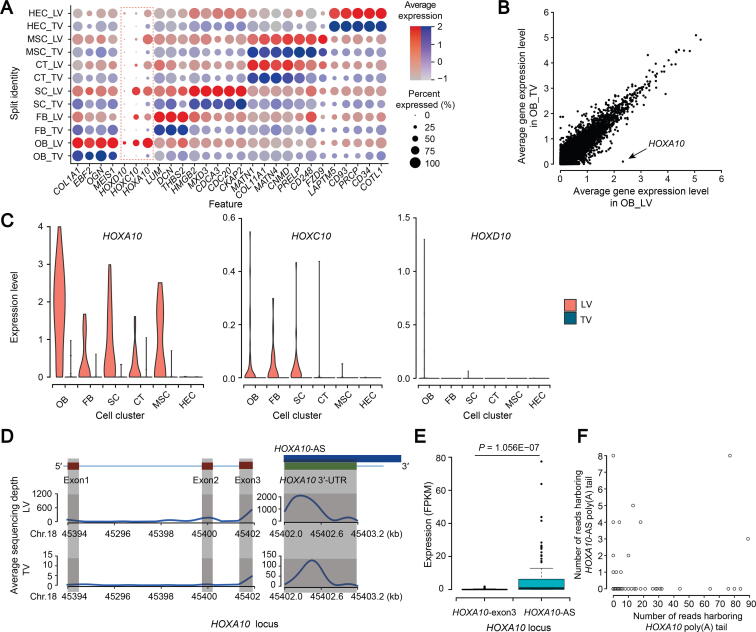
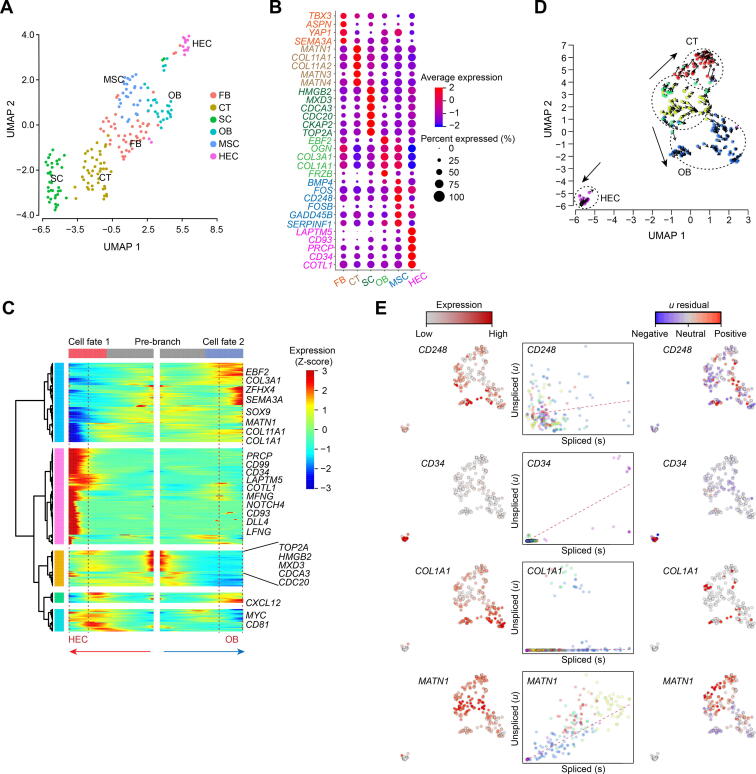
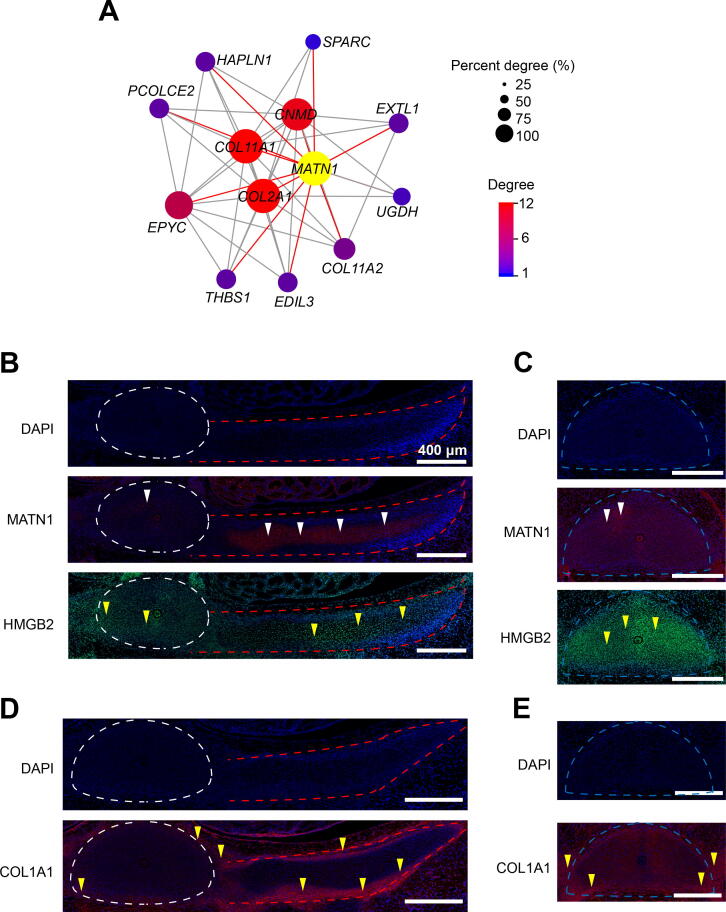
Development of thoracolumbar vertebra (TLV) and rib primordium (RP) is a common evolutionary feature across vertebrates, although whole-organism analysis of the expression dynamics of TLV- and RP-related genes has been lacking. Here, we investigated the single-cell transcriptome landscape of thoracic vertebra (TV), lumbar vertebra (LV), and RP cells from a pig embryo at 27 days post-fertilization (dpf) and identified six cell types with distinct gene expression signatures. In-depth dissection of the gene expression dynamics and RNA velocity revealed a coupled process of osteogenesis and angiogenesis during TLV and RP development. Further analysis of cell type-specific and strand-specific expression uncovered the extremely high level of HOXA10 3'-UTR sequence specific to osteoblasts of LV cells, which may function as anti-HOXA10-antisense by counteracting the HOXA10-antisense effect to determine TLV transition. Thus, this work provides a valuable resource for understanding embryonic osteogenesis and angiogenesis underlying vertebrate TLV and RP development at the cell type-specific resolution, which serves as a comprehensive view on the transcriptional profile of animal embryo development.
Keywords: Angiogenesis; Osteogenesis; Rib-genesis; Thoracolumbar vertebra transition; scRNA-seq.
Copyright © 2021 The Author. Published by Elsevier B.V. All rights reserved.
Figures
Similar articles
-
Radiographic and Magnetic Resonance Imaging Identification of Thoracolumbar Spine Variants with Implications for the Positioning of the Conus Medullaris in Rhesus Macaques.Anat Rec (Hoboken). 2017 Feb;300(2):300-308. doi: 10.1002/ar.23495. Epub 2016 Nov 7. Anat Rec (Hoboken). 2017. PMID: 27731939
-
Effects of the combined VDS-Zielke and Harrington operation on the frontal rib cage deformity of double major curves in idiopathic scoliosis.Spine (Phila Pa 1976). 1995 May 1;20(9):1061-7. doi: 10.1097/00007632-199505000-00013. Spine (Phila Pa 1976). 1995. PMID: 7631236
-
A porcine model of early-onset scoliosis combined with thoracic insufficiency syndrome: Construction and transcriptome analysis.Gene. 2023 Mar 30;858:147202. doi: 10.1016/j.gene.2023.147202. Epub 2023 Jan 13. Gene. 2023. PMID: 36646188
-
Single-cell RNA sequencing: A new opportunity for retinal research.Wiley Interdiscip Rev RNA. 2021 Sep;12(5):e1652. doi: 10.1002/wrna.1652. Epub 2021 Mar 22. Wiley Interdiscip Rev RNA. 2021. PMID: 33754496 Review.
-
Single-Cell Sequencing Methodologies: From Transcriptome to Multi-Dimensional Measurement.Small Methods. 2021 Jun;5(6):e2100111. doi: 10.1002/smtd.202100111. Epub 2021 Apr 17. Small Methods. 2021. PMID: 34927917 Review.
Cited by
-
ASPN Synergizes with HAPLN1 to Inhibit the Osteogenic Differentiation of Bone Marrow Mesenchymal Stromal Cells and Extracellular Matrix Mineralization of Osteoblasts.Orthop Surg. 2023 Sep;15(9):2423-2434. doi: 10.1111/os.13803. Epub 2023 Jul 10. Orthop Surg. 2023. PMID: 37427673 Free PMC article.
-
Integrated single-cell analyses decode the developmental landscape of the human fetal spine.iScience. 2022 Jun 27;25(7):104679. doi: 10.1016/j.isci.2022.104679. eCollection 2022 Jul 15. iScience. 2022. PMID: 35832888 Free PMC article.
-
Innovative Insights into Single-Cell Technologies and Multi-Omics Integration in Livestock and Poultry.Int J Mol Sci. 2024 Dec 2;25(23):12940. doi: 10.3390/ijms252312940. Int J Mol Sci. 2024. PMID: 39684651 Free PMC article. Review.
-
Advanced Single-cell Omics Technologies and Informatics Tools for Genomics, Proteomics, and Bioinformatics Analysis.Genomics Proteomics Bioinformatics. 2021 Jun;19(3):343-345. doi: 10.1016/j.gpb.2021.12.001. Epub 2021 Dec 16. Genomics Proteomics Bioinformatics. 2021. PMID: 34923125 Free PMC article. No abstract available.
-
Advancing skeletal health and disease research with single-cell RNA sequencing.Mil Med Res. 2024 May 30;11(1):33. doi: 10.1186/s40779-024-00538-3. Mil Med Res. 2024. PMID: 38816888 Free PMC article. Review.
References
-
- Gilbert S.F., Barresi M.J. Development biology. Am J Med Genet A. 2017;173:1430.
-
- Gomez C., Özbudak E.M., Wunderlich J., Baumann D., Lewis J., Pourquié O. Control of segment number in vertebrate embryos. Nature. 2008;454:335–339. - PubMed
-
- Wilson V., Olivera-Martinez I., Storey K.G. Stem cells, signals and vertebrate body axis extension. Development. 2009;136:1591–1604. - PubMed
-
- Jurberg A., Aires R., Varela-Lasheras I., Nóvoa A., Mallo M. Switching axial progenitors from producing trunk to tail tissues in vertebrate embryos. Dev Cell. 2013;25:451–462. - PubMed
Publication types
MeSH terms
LinkOut - more resources
Full Text Sources
