

Geospatial Analysis of Social Determinants of Health Identifies Neighborhood Hot Spots Associated With Pediatric Intensive Care Use for Life-Threatening Asthma
- PMID: 34775118
- PMCID: PMC9007839
- DOI: 10.1016/j.jaip.2021.10.065
Geospatial Analysis of Social Determinants of Health Identifies Neighborhood Hot Spots Associated With Pediatric Intensive Care Use for Life-Threatening Asthma
Abstract
Background: Social determinants of health are associated with asthma prevalence and healthcare use in children with asthma, but are multifactorial and complex. Whether social determinants similarly influence exacerbation severity is not clear.
Objective: Composite measures of social determinants of health and readmission outcomes were evaluated in a large regional cohort of 1,403 school-age children admitted to a pediatric intensive care unit (PICU) for asthma.
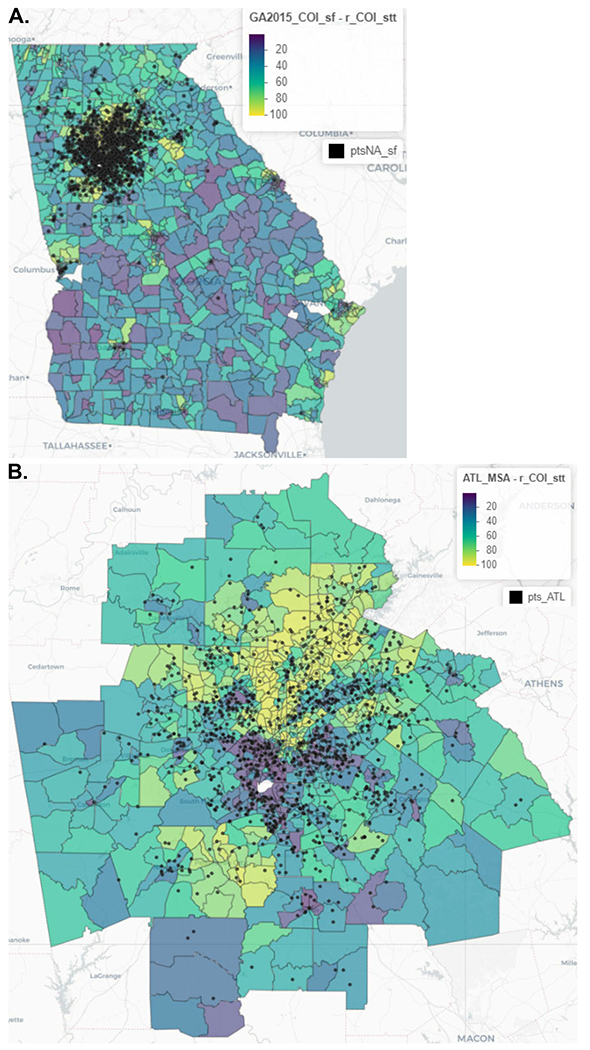
Methods: Residential addresses were geocoded and spatially joined to census tracts. Composite measures of social vulnerability and childhood opportunity, PICU readmission rates, and hospital length of stay were compared between neighborhood hot spots, where PICU admission rates per 1,000 children are at or above the 90th percentile, versus non-hot spots.
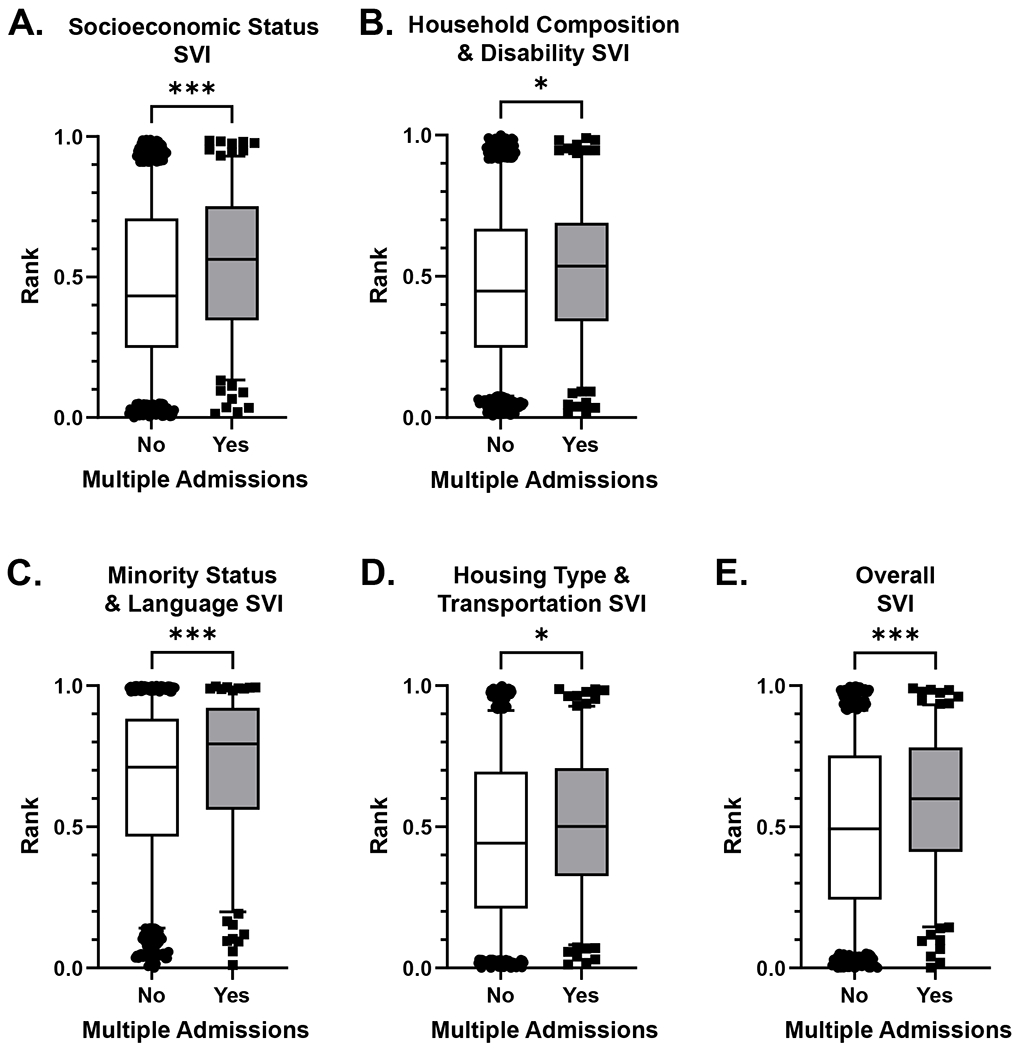
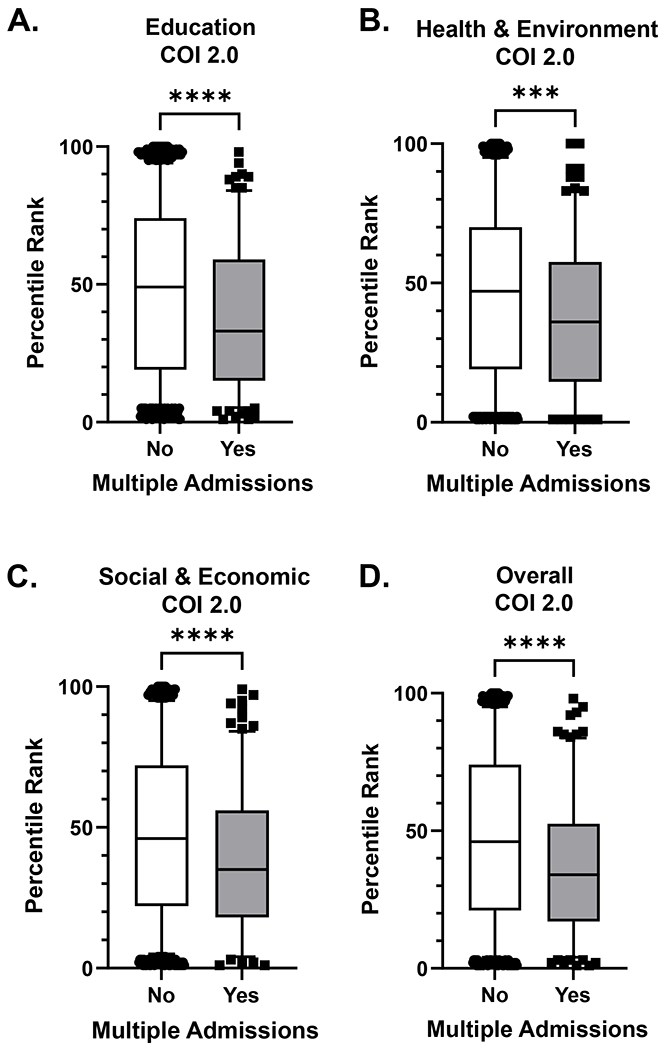
Results: A total of 228 children resided within a neighborhood hot spot (16%). Hot spots were associated with a higher (ie, poorer) composite Social Vulnerability Index ranking, reflecting differences in socioeconomic status, household composition and disability, and housing type and transportation. Hot spots also had a lower (ie, poorer) composite Childhood Opportunity Index percentile ranking, reflecting differences in the education, health and environment, and social and economic domains. Higher social vulnerability and lower childhood opportunity were associated with PICU readmission. Residing within a hot spot was further associated with a longer duration of hospital stay, individual inpatient bed days, and total census tract inpatient bed days.
Conclusions: Social determinants of health identified by geospatial analyses are associated with more severe asthma exacerbation outcomes in children. Outpatient strategies that address both biological and social determinants of health are needed to care for and prevent PICU admissions optimally in children with asthma.
Keywords: Census tract; Childhood Opportunity Index; Geocoding; Neighborhood; Pediatric intensive care unit; Social Vulnerability Index; Social determinants of health; disparities; status asthmaticus.
Copyright © 2021 American Academy of Allergy, Asthma & Immunology. Published by Elsevier Inc. All rights reserved.
Conflict of interest statement
Figures
Comment in
-
"Redlining" to "Hot Spots": The Impacts of a Continued Legacy of Structural and Institutional Racism and Bias on Asthma in Children.J Allergy Clin Immunol Pract. 2022 Apr;10(4):992-993. doi: 10.1016/j.jaip.2022.02.003. J Allergy Clin Immunol Pract. 2022. PMID: 35397818 No abstract available.
References
-
- Slejko JF, Ghushchyan VH, Sucher B, Globe DR, Lin SL, Globe G, et al. Asthma control in the United States, 2008-2010: indicators of poor asthma control. J Allergy Clin Immunol 2014; 133:1579–87. - PubMed
-
- Federico MJ, McFarlane AE 2nd, Szefler SJ, Abrams EM. The Impact of Social Determinants of Health on Children with Asthma. J Allergy Clin Immunol Pract 2020; 8:1808–14. - PubMed
-
- Parikh K, Berry J, Hall M, Mussman GM, Montalbano A, Thomson J, et al. Racial and Ethnic Differences in Pediatric Readmissions for Common Chronic Conditions. J Pediatr 2017; 186:158–64 e1. - PubMed
