. 2021 Dec:48:102185.
doi: 10.1016/j.redox.2021.102185. Epub 2021 Nov 11.

Epigallocatechin-3-gallate pretreatment alleviates doxorubicin-induced ferroptosis and cardiotoxicity by upregulating AMPKα2 and activating adaptive autophagy

Affiliations

Epigallocatechin-3-gallate pretreatment alleviates doxorubicin-induced ferroptosis and cardiotoxicity by upregulating AMPKα2 and activating adaptive autophagy

Huan He et al. Redox Biol. 2021 Dec.

Abstract

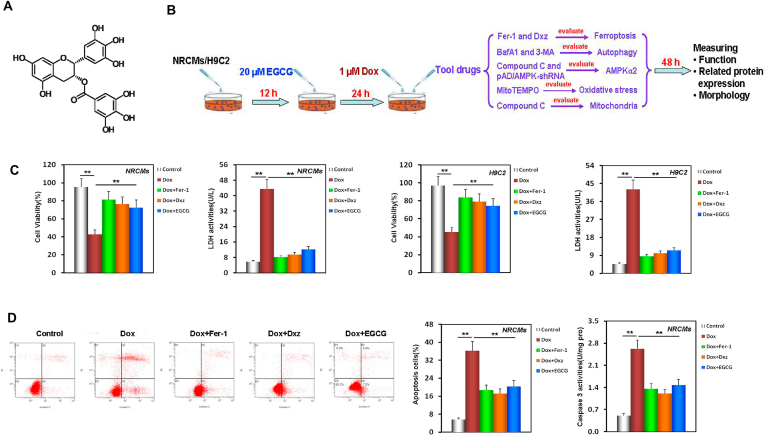
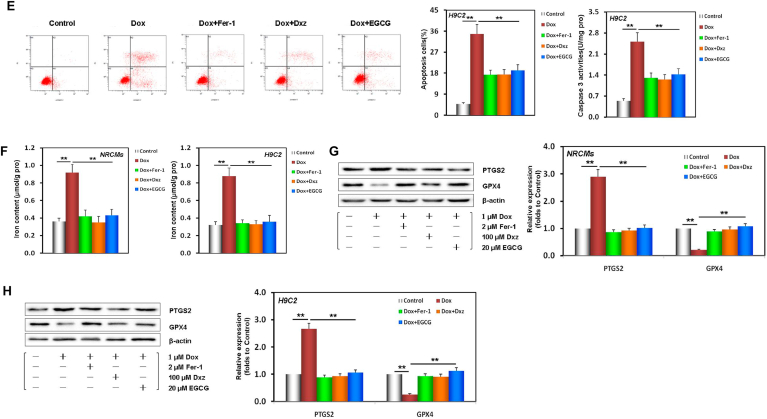
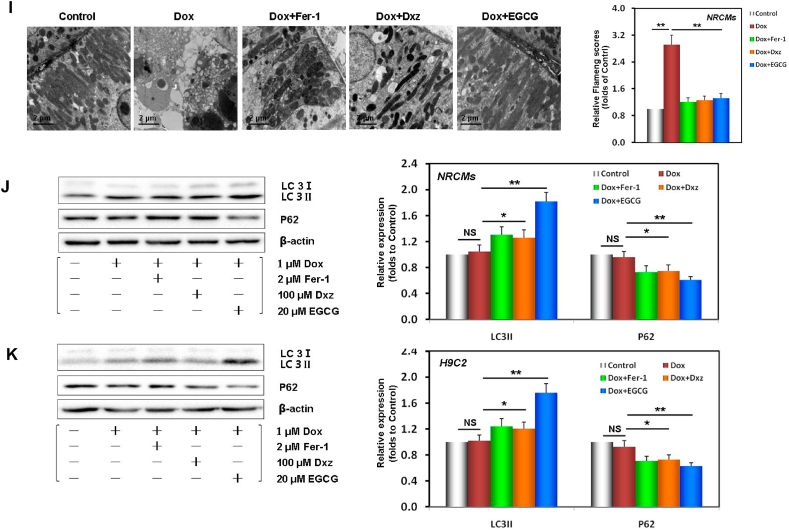
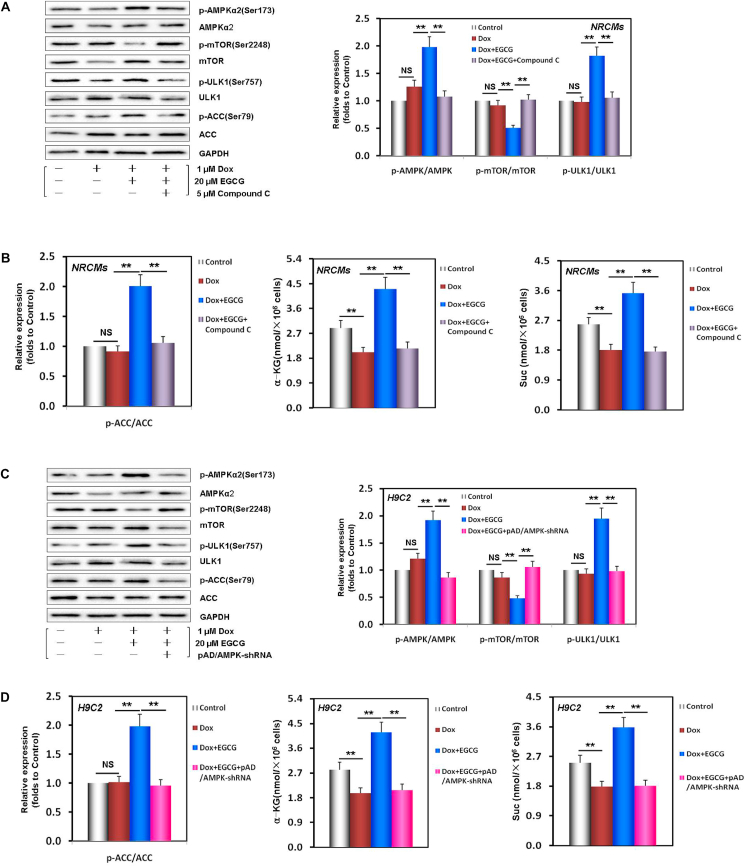
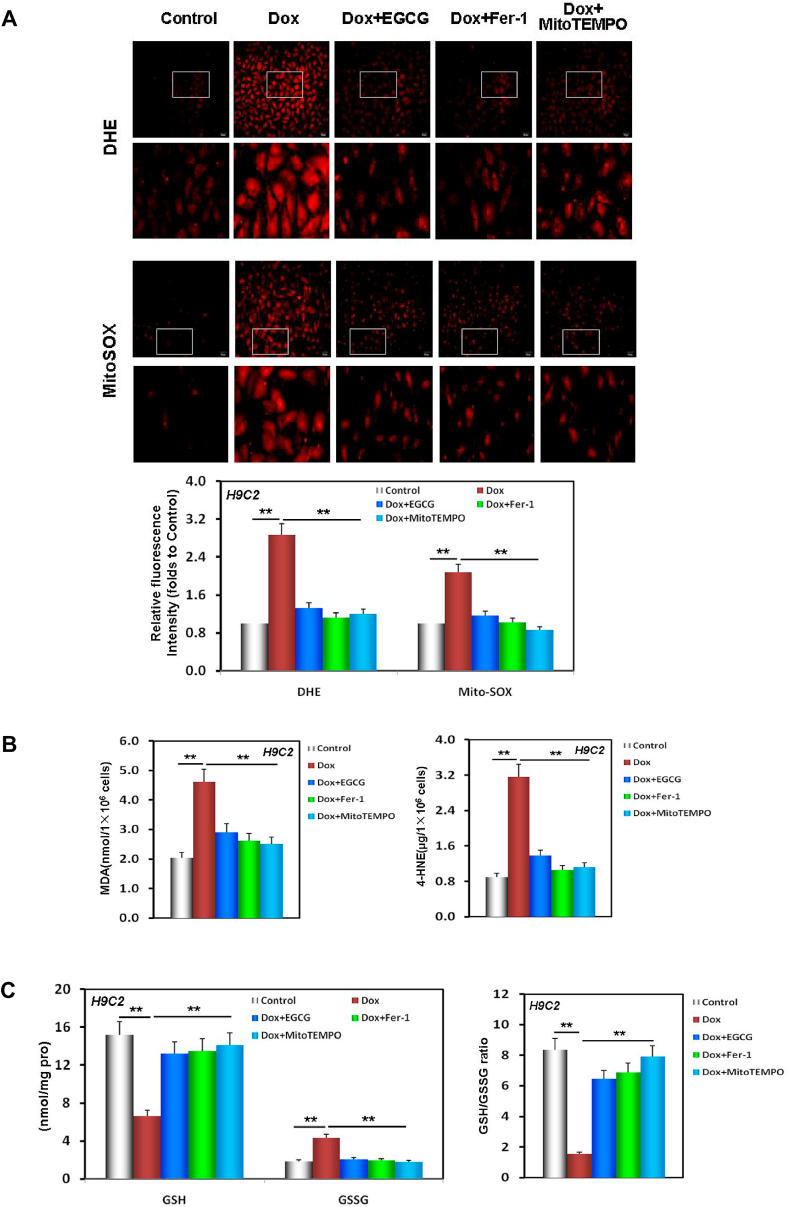
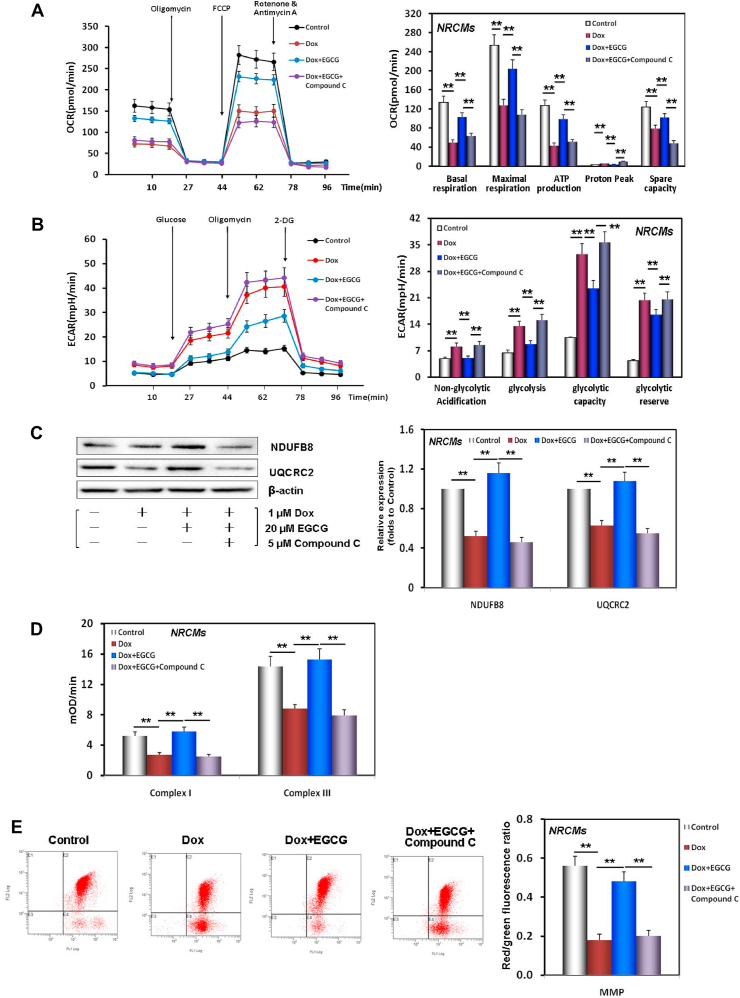
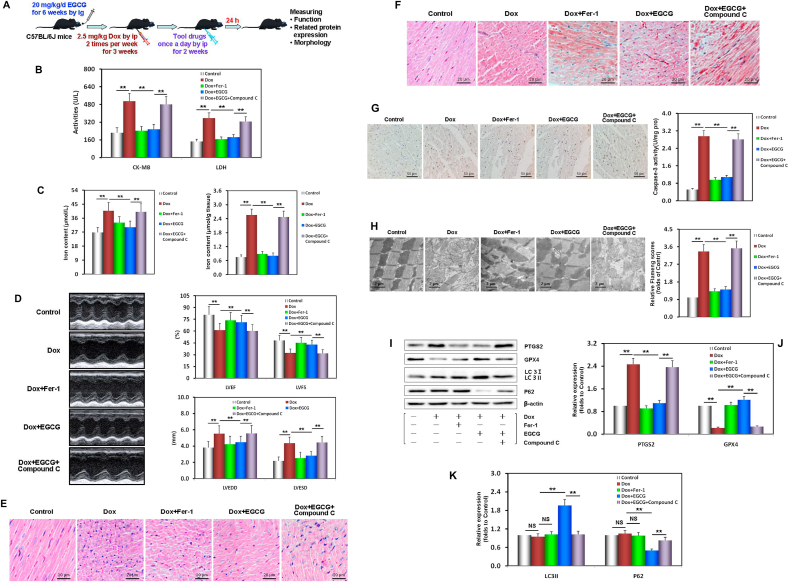
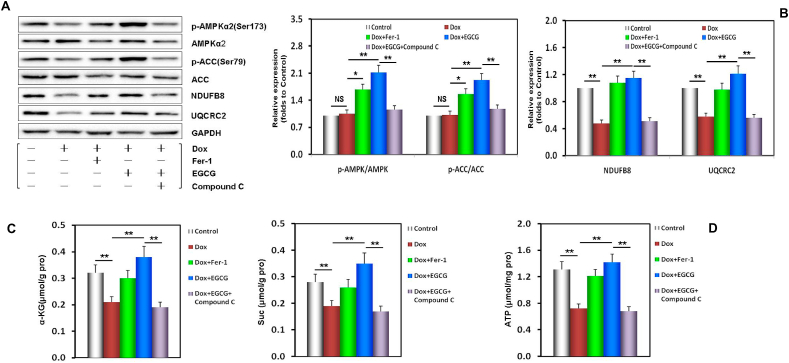
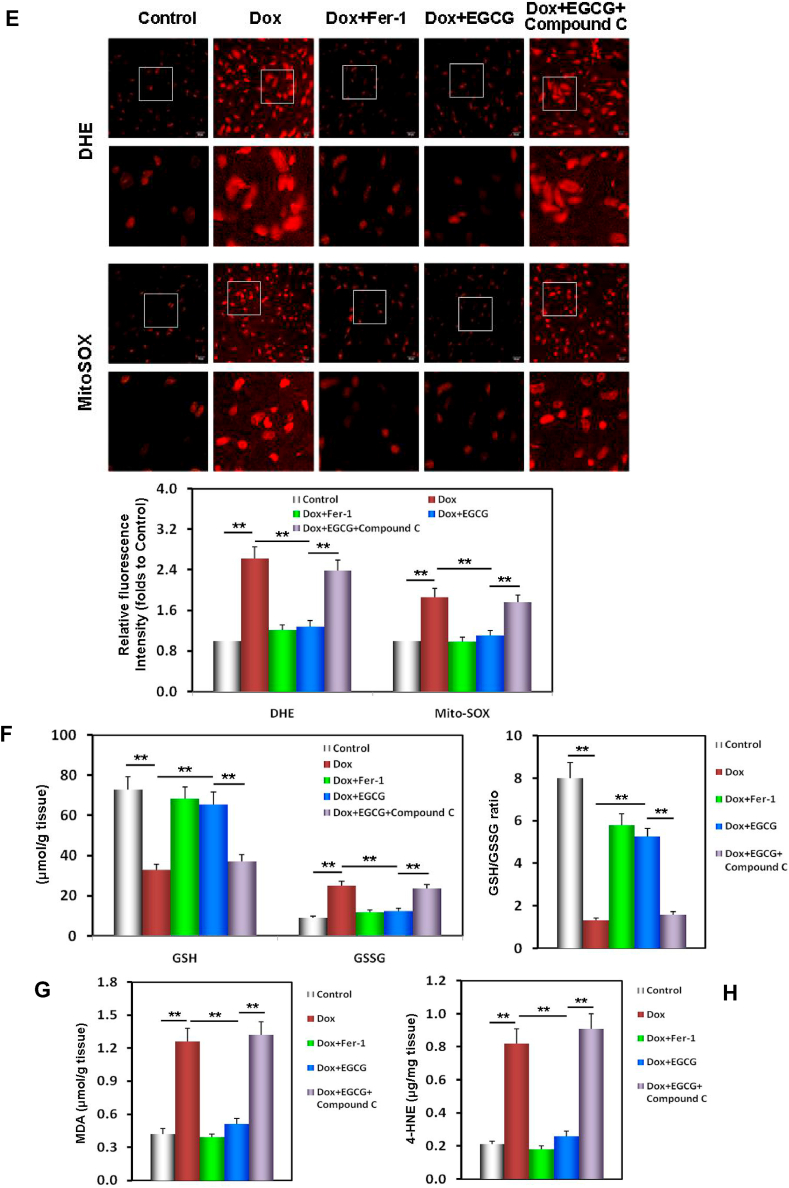
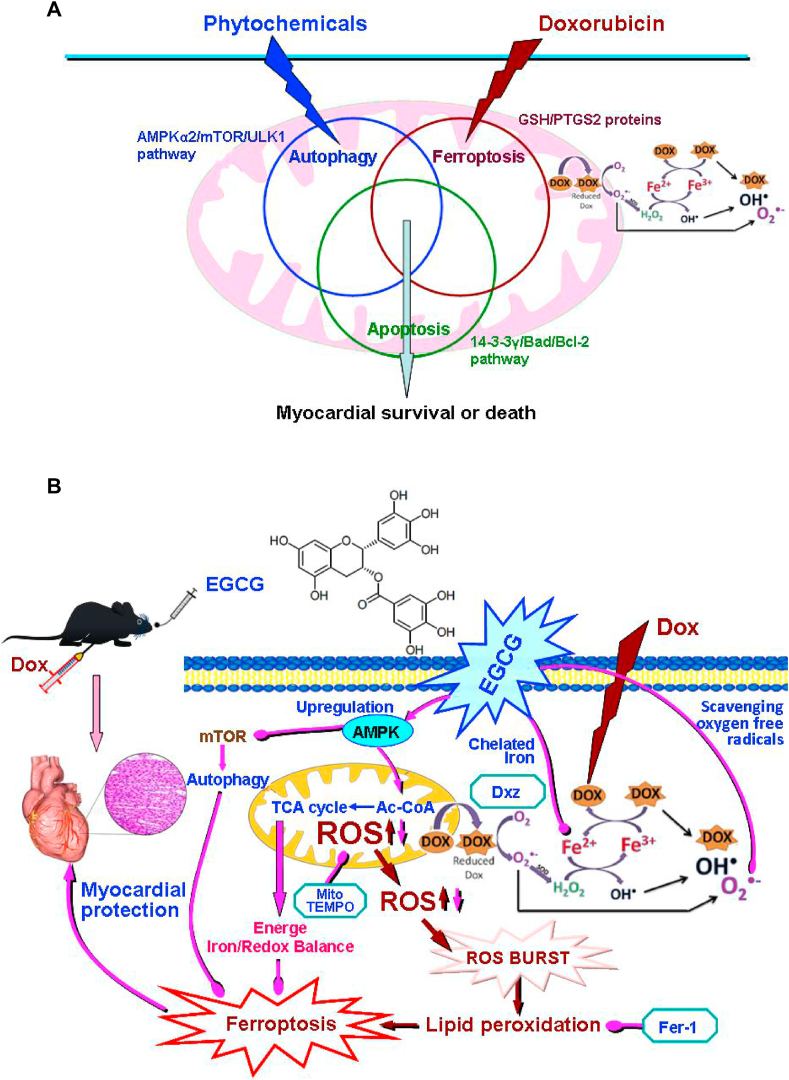
Reports indicate that the mechanism of doxorubicin (Dox)-induced cardiotoxicity is very complex, involving multiple regulatory cell death forms. Furthermore, the clinical intervention effect is not ideal. Iron dependence, abnormal lipid metabolism, and excess reactive oxygen species generation, three characteristics of ferroptosis, are potential therapeutic intervention targets. Here, we confirmed in vitro and in vivo that at least autophagy, apoptosis, and ferroptosis are involved in Dox cardiotoxicity-induced damage. When the neonatal rat cardiomyocytes and H9C2 cells or C57BL/6 mice were subjected to Dox-induced cardiotoxicity, epigallocatechin-3-gallate pretreatment could effectively decrease iron accumulation, inhibit oxidative stress and abnormal lipid metabolism, and thereby alleviate Dox cardiotoxicity-induced ferroptosis and protect the myocardium according to multiple functional, enzymatic, and morphological indices. The underlying mechanism was verified to involve the upregulation and activation of AMP-activated protein kinase α2, which promoted adaptive autophagy, increased energy supply, and maintained mitochondrial function. We believe that epigallocatechin-3-gallate is a candidate phytochemical against Dox-induced cardiotoxicity.

Keywords: AMP-Activated protein kinase α2; Autophagy; Cardiotoxicity; Doxorubicin; Epigallocatechin-3-gallate; Ferroptosis.


Conflict of interest statement

The authors declare that they have no conflict of interest.

Figures

Fig. 1
Fig. 1
EGCG pretreatment alleviated Dox-induced cardiomyocyte ferroptosis. A EGCG molecular formula. B Diagram of the in vitro study design. C NRCM and H9C2 cell viability and LDH activity (containing 20 μM EGCG [during the 24 h pretreatment before exposure to 1 μM Dox] in cells subjected or not to 20 μM EGCG, 2 μM Fer-1, and 100 μM Dxz co-treatment for 48 h; the below findings were also obtained using this method. D Apoptosis and caspase-3 activity of NRCMs. E Apoptosis and caspase-3 activity of H9C2 cells. F Iron contents of NRCMs and H9C2 cells. Values are mean ± SD from five individual experiments. **p < 0.01 compared with the indicated groups. G Western blot bands showing PTGS2 and GPX4 protein expression and the relative signal intensities in NRCMs. H Western blot bands showing PTGS2 and GPX4 protein expression and the relative signal intensities in H9C2 cells. I Transmission electron microscope images and the relative Fiameng scores of NRCMs. J Western blot bands showing LC3 and P62 protein expression and the relative signal intensities in NRCMs. K Western blot bands showing LC3 and P62 protein expression and the relative signal intensities in H9C2 cells. Values are mean ± SD from three individual experiments. NS, nonsignificant. *p < 0.05 compared with the indicated groups. **p < 0.01 compared with the indicated groups.
Fig. 1
Fig. 1
EGCG pretreatment alleviated Dox-induced cardiomyocyte ferroptosis. A EGCG molecular formula. B Diagram of the in vitro study design. C NRCM and H9C2 cell viability and LDH activity (containing 20 μM EGCG [during the 24 h pretreatment before exposure to 1 μM Dox] in cells subjected or not to 20 μM EGCG, 2 μM Fer-1, and 100 μM Dxz co-treatment for 48 h; the below findings were also obtained using this method. D Apoptosis and caspase-3 activity of NRCMs. E Apoptosis and caspase-3 activity of H9C2 cells. F Iron contents of NRCMs and H9C2 cells. Values are mean ± SD from five individual experiments. **p < 0.01 compared with the indicated groups. G Western blot bands showing PTGS2 and GPX4 protein expression and the relative signal intensities in NRCMs. H Western blot bands showing PTGS2 and GPX4 protein expression and the relative signal intensities in H9C2 cells. I Transmission electron microscope images and the relative Fiameng scores of NRCMs. J Western blot bands showing LC3 and P62 protein expression and the relative signal intensities in NRCMs. K Western blot bands showing LC3 and P62 protein expression and the relative signal intensities in H9C2 cells. Values are mean ± SD from three individual experiments. NS, nonsignificant. *p < 0.05 compared with the indicated groups. **p < 0.01 compared with the indicated groups.
Fig. 2
Fig. 2
EGCG pretreatment enhanced adaptive autophagy in Dox-injured cardiomyocytes. A Dox-induced autophagic flux evaluated by the difference in the P62 and LC3 levels between NRCMs subjected or not to treatment with 100 nM BafA1. B Dox-induced autophagic flux evaluated by the difference in the P62 and LC3 levels between H9C2 cells subjected or not to treatment with 100 nM BafA1. C Western blot bands showing LC3 and P62 protein expression and the relative signal intensities in NRCMs pretreated with 20 μM EGCG for 24 h and then exposed to 1 μM Dox, and in cells subjected or not to 20 μM EGCG and 5 mM 3-MA co-treatment for 48 h; the below findings were also obtained using this method. D Western blot bands showing LC3 and P62 protein expression and the relative signal intensities in H9C2 cells. e NRCM images stained with MDC. f NRCM images stained with LysoTracker Red DND-99. Values are mean ± SD from three individual experiments. NS, nonsignificant. *p < 0.05 compared with the indicated groups. **p < 0.01 compared with the indicated groups. (For interpretation of the references to colour in this figure legend, the reader is referred to the Web version of this article.)
Fig. 3
Fig. 3
EGCG pretreatment upregulated AMPKα2 and promoted TCA cycle activation in Dox-injured cardiomyocytes. A Western blot bands showing total and phosphorylated AMPKα2, mTOR, and ULK1 expression and the relative intensities of p-AMPKα2/AMPKα2, p-mTOR/mTOR, and p-ULK1/ULK1 expression in NRCMs pretreated with 20 μM EGCG for 24 h and then exposed to 1 μM Dox, and in cells subjected or not to 20 μM EGCG and 5 μM compound C co-treatment for 48 h; the below findings were also obtained using this method. B The relative intensity of p-ACC/ACC and the contents of α-KG and Suc in NRCMs. C Western blot bands showing total and phosphorylated AMPKα2, mTOR, and ULK1 expression and the relative intensities of p-AMPKα2/AMPKα2, p-mTOR/mTOR, and p-ULK1/ULK1 expression in H9C2 cells pretreated with 20 μM EGCG for 24 h and then exposed to 1 μM, and in cells subjected or not to 20 μM EGCG and pAD/AMPK-shRNA co-treatment for 48 h; the below findings were also obtained using this method. D The relative intensity of p-ACC/ACC and the contents of α-KG and Suc in H9C2 cells. Values are mean ± SD from three individual experiments. NS, nonsignificant. **p < 0.01 compared with the indicated groups.
Fig. 4
Fig. 4
EGCG pretreatment improved redox equilibrium and lipid metabolism in Dox-injured cardiomyocytes. A Images of DHE/MitoSOX probe-stained H9C2 cells and the relative fluorescence intensity of DHE/MitoSOX in H9C2 cells pretreated with 20 μM EGCG for 24 h and then exposed to 1 μM Dox, and in cells subjected or not to 20 μM EGCG, 2 μM Fer-1, and 10 μM MitoTEMPO co-treatment for 48 h; the below findings were also obtained using this method. B The MDA and 4-HNE contents in H9C2 cells. C The levels of GSH, GSSG, and the GSH/GSSG ratio in H9C2 cells. Values are mean ± SD from three individual experiments. **p < 0.01 compared with the indicated groups.
Fig. 5
Fig. 5
EGCG pretreatment maintained and improved mitochondrial function in Dox-injured cardiomyocytes. A OCR curve charts and the histogram of indices related to mitochondrial vitality in NRCMs pretreated with 20 μM EGCG for 24 h and then exposed to 1 μM Dox, and in cells subjected or not to 20 μM EGCG and 5 μM compound C co-treatment for 48 h; the below findings were also obtained using this method. B ECAR curve charts and the histogram of indices related to mitochondrial glycolytic function in NRCMs. C Western blot bands showing NDUFB8 and UQCRC2 protein expression and the relative signal intensities in NRCMs. D The activities of complexes I and III in the ETC of mitochondria in NRCMs. E MMP levels detected by JC-1 in NRCMs indicated by the red/green fluorescence ratio. Values are mean ± SD from three individual experiments. **p < 0.01 compared with the indicated groups. (For interpretation of the references to colour in this figure legend, the reader is referred to the Web version of this article.)
Fig. 6
Fig. 6
EGCG pretreatment enhanced adaptive autophagy and alleviated Dox-induced myocardial ferroptosis in mice. A Diagram of the in vivo study design. B CK-MB and LDH activity in mouse serum in each treatment group. C The iron contents of mouse serum and myocardium in each treatment group. D Echocardiographic images, and the histogram of LVEDD, LVESD, LVEF, and LVFS parameters in mice. Values are mean ± SD from six individual experiments. **p < 0.01 compared with the indicated groups. E Images of HE-stained mouse myocardium. F Images of Masson-stained mouse myocardium. G Images of TUNEL-stained mouse myocardium. H Transmission electron microscope images and the relative Fiameng scores of mouse myocardium. I Western blot bands showing PTGS2, GPX4, LC3, and P62 protein expression in mouse myocardium. J Relative intensities of PTGS2 and GPX4 expression in mouse myocardium. K Relative intensities of LC3 and P62 expression in mouse myocardium. Values are mean ± SD from three individual experiments. NS, nonsignificant. **p < 0.01 compared with the indicated groups.
Fig. 7
Fig. 7
EGCG pretreatment upregulated AMPKα2 and improved redox equilibrium and mitochondrial function in the Dox-injured mouse myocardium. A Western blot bands showing total and phosphorylated AMPKα2 and ACC expression, NDUFB8 and UQCRC2 expression, and the relative intensities of p-AMPKα2/AMPKα2 and p-ACC/ACC expression in the mouse myocardium. B Relative intensities of NDUFB8 and UQCRC2 expression in the mouse myocardium. C The contents of α-KG and Suc in the mouse myocardium. D The ATP contents in the mouse myocardium. E DHE/MitoSOX probe-stained images and the relative fluorescence intensity of DHE/MitoSOX in the mouse myocardium. F The levels of GSH, GSSG, and the GSH/GSSG ratio in the mouse myocardium. G The MDA contents in the mouse myocardium. H The 4-HNE contents in the mouse myocardium. Values are mean ± SD from three individual experiments. NS, nonsignificant. *p < 0.05 compared with the indicated groups. **p < 0.01 compared with the indicated groups.
Fig. 7
Fig. 7
EGCG pretreatment upregulated AMPKα2 and improved redox equilibrium and mitochondrial function in the Dox-injured mouse myocardium. A Western blot bands showing total and phosphorylated AMPKα2 and ACC expression, NDUFB8 and UQCRC2 expression, and the relative intensities of p-AMPKα2/AMPKα2 and p-ACC/ACC expression in the mouse myocardium. B Relative intensities of NDUFB8 and UQCRC2 expression in the mouse myocardium. C The contents of α-KG and Suc in the mouse myocardium. D The ATP contents in the mouse myocardium. E DHE/MitoSOX probe-stained images and the relative fluorescence intensity of DHE/MitoSOX in the mouse myocardium. F The levels of GSH, GSSG, and the GSH/GSSG ratio in the mouse myocardium. G The MDA contents in the mouse myocardium. H The 4-HNE contents in the mouse myocardium. Values are mean ± SD from three individual experiments. NS, nonsignificant. *p < 0.05 compared with the indicated groups. **p < 0.01 compared with the indicated groups.
Fig. 8
Fig. 8
Schematic diagram of related hypothesis. A. Schematic diagram of “Autophagy, iron ptosis and apoptosis always overlap and interfere with each other” and the protein and signal pathway hypothesis related to the study. B. Schematic diagram showing how EGCG pretreatment protected cardiomyocytes against Dox-induced ferroptosis. EGCG pretreatment upregulated the expression and phosphorylation of AMPKα2 and activated adaptive autophagy, thereby decreasing iron accumulation, inhibiting excess ROS generation and abnormal lipid metabolism, increasing energy supply, and maintaining mitochondrial function, ultimately protecting the myocardium against Dox-induced ferroptosis.

References

    1. Miller K.D., Nogueira L., Mariotto A.B., Rowland J.H., Yabroff K.R., Alfano C.M., et al. Cancer treatment and survivorship statistics. CA A Cancer J. Clin. 2019;69:363–385. doi: 10.3322/caac.21565. 2019. - DOI - PubMed
    1. Global Burden of Disease Cancer Collaboration, C. Fitzmaurice. Dicker D., Pain A., Hamavid H., Moradi-Lakeh M., et al. The global Burden of cancer 2013. JAMA Oncol. 2015;1:505–527. doi: 10.1001/jamaoncol.2015.0735. - DOI - PMC - PubMed
    1. Volkova M., 3rd Russell R. Anthracycline cardiotoxicity: prevalence, pathogenesis and treatment. Curr. Cardiol. Rev. 2011;7:214–220. doi: 10.2174/157340311799960645. - DOI - PMC - PubMed
    1. Swain S.M., Whaley F.S., Ewer M.S. Congestive heart failure in patients treated with doxorubicin: a retrospective analysis of three trials. Cancer. 2003;97:2869–2879. doi: 10.1002/cncr.11407. - DOI - PubMed
    1. Zhang S., Liu X., Bawa-Khalfe T., Lu L.S., Lyu Y.L., Liu L.F., er al. Identification of the molecular basis of doxorubicin-induced cardiotoxicity. Nat. Med. 2012;18:1639–1642. doi: 10.1038/nm.2919. - DOI - PubMed

LinkOut - more resources