Review
. 2021;217(3):48.
doi: 10.1007/s11214-021-00816-9. Epub 2021 Apr 13.

The Mars Environmental Dynamics Analyzer, MEDA. A Suite of Environmental Sensors for the Mars 2020 Mission

J A Rodriguez-Manfredi  1 M de la Torre Juárez  2 A Alonso  3 V Apéstigue  4 I Arruego  4 T Atienza  5 D Banfield  6 J Boland  2 M A Carrera  7 L Castañer  5 J Ceballos  8 H Chen-Chen  9 A Cobos  3 P G Conrad  10 E Cordoba  2 T Del Río-Gaztelurrutia  9 A de Vicente-Retortillo  1 M Domínguez-Pumar  5 S Espejo  8 A G Fairen  1 A Fernández-Palma  7 R Ferrándiz  1 F Ferri  11 E Fischer  12 A García-Manchado  3 M García-Villadangos  1 M Genzer  13 S Giménez  1 J Gómez-Elvira  4 F Gómez  1 S D Guzewich  14 A-M Harri  13 C D Hernández  2 M Hieta  13 R Hueso  9 I Jaakonaho  13 J J Jiménez  4 V Jiménez  5 A Larman  7 R Leiter  2 A Lepinette  1 M T Lemmon  15 G López  5 S N Madsen  2 T Mäkinen  13 M Marín  1 J Martín-Soler  1 G Martínez  16 A Molina  1 L Mora-Sotomayor  1 J F Moreno-Álvarez  3 S Navarro  1 C E Newman  17 C Ortega  7 M C Parrondo  4 V Peinado  1 A Peña  3 I Pérez-Grande  18 S Pérez-Hoyos  9 J Pla-García  1 J Polkko  13 M Postigo  1 O Prieto-Ballesteros  1 S C R Rafkin  19 M Ramos  20 M I Richardson  17 J Romeral  1 C Romero  1 K D Runyon  21 A Saiz-Lopez  22 A Sánchez-Lavega  9 I Sard  7 J T Schofield  2 E Sebastian  1 M D Smith  14 R J Sullivan  6 L K Tamppari  2 A D Thompson  2 D Toledo  4 F Torrero  3 J Torres  1 R Urquí  1 T Velasco  3 D Viúdez-Moreiras  1 S Zurita  1 MEDA team
Affiliations
Review

The Mars Environmental Dynamics Analyzer, MEDA. A Suite of Environmental Sensors for the Mars 2020 Mission

J A Rodriguez-Manfredi et al. Space Sci Rev. 2021.

Abstract

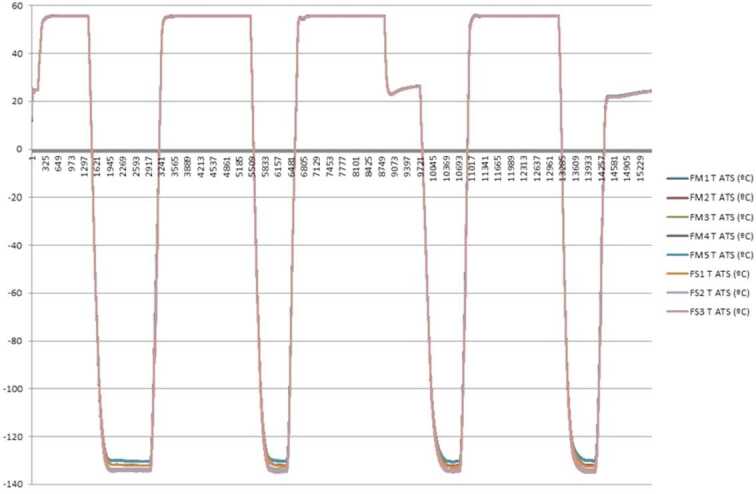
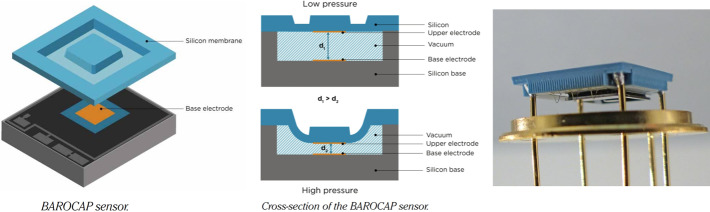
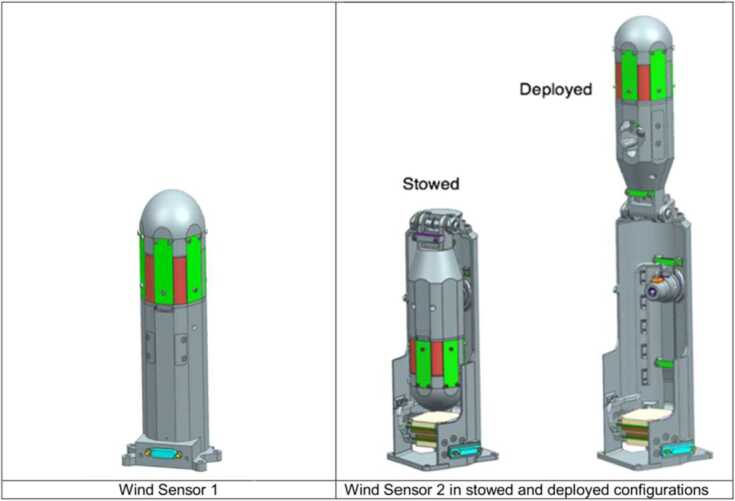
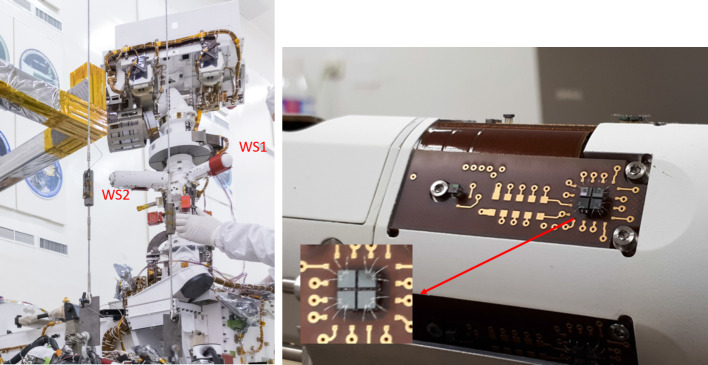
NASA's Mars 2020 (M2020) rover mission includes a suite of sensors to monitor current environmental conditions near the surface of Mars and to constrain bulk aerosol properties from changes in atmospheric radiation at the surface. The Mars Environmental Dynamics Analyzer (MEDA) consists of a set of meteorological sensors including wind sensor, a barometer, a relative humidity sensor, a set of 5 thermocouples to measure atmospheric temperature at ∼1.5 m and ∼0.5 m above the surface, a set of thermopiles to characterize the thermal IR brightness temperatures of the surface and the lower atmosphere. MEDA adds a radiation and dust sensor to monitor the optical atmospheric properties that can be used to infer bulk aerosol physical properties such as particle size distribution, non-sphericity, and concentration. The MEDA package and its scientific purpose are described in this document as well as how it responded to the calibration tests and how it helps prepare for the human exploration of Mars. A comparison is also presented to previous environmental monitoring payloads landed on Mars on the Viking, Pathfinder, Phoenix, MSL, and InSight spacecraft.

Keywords: Albedo; Atmosphere; Clouds; Dust; Instruments; MEDA instrument; Mars; Mars2020; Perseverance; Pressure; Radiation fluxes; Surface temperature; Temperature; Thermal infrared; UV; Wind.


Figures

Fig. 1
Fig. 1
(Left) Elements of each Temperature Sensor TS (top) and TS Circuit Diagram (bottom). (Center) Aluminum isothermal block (top) and components of each isothermal block (bottom). (Right) ATS Three thermocouples glued to the FR4 structure (top) and finished TS unit (bottom)
Fig. 2
Fig. 2
Location of the ATS units on the rover
Fig. 3
Fig. 3
Temperatures measured during the Thermal Vacuum Test in a chamber – Range from 133 K to 328 K for 127 hours
Fig. 4
Fig. 4
Thermocouple time response in air with a velocity of 19,8 m/s (65 feet/s). Further information is available in vendor’s website (Omega 2021)
Fig. 5
Fig. 5
Flow diagram of the retrieval process followed to calculate ambient temperatures from raw counts readings of each TS
Fig. 6
Fig. 6
Schematic of the Barocap® sensor head, drawing by Vaisala, Inc. (left). Barocap® sensor head type NGM (right)
Fig. 7
Fig. 7
Pressure sensor with the pipe protruding through the Faraday shield (left). Right: PS PCB top containing P1 electronics without a cover. NGM Barocaps® are in top right corner, RSP2M 1.6 in bottom left. Thermocap sensor heads are reddish glass tubes in bottom right corner
Fig. 8
Fig. 8
Block diagram of calibration equipment at FMI
Fig. 9
Fig. 9
MEDA PS Flight, Spare and Qualification models attached to a support plate. Pressure vessel used in the MEDA PS tests is visible behind the models
Fig. 10
Fig. 10
Short-term repeatability of Barocaps® 1.8 (left) and 1.6 (right) in the main calibration run
Fig. 11
Fig. 11
Time constant of the PS QM
Fig. 12
Fig. 12
(Left) Difference between the sensor pressure and the reference pressure of Barocaps® 1.6 and 1.8 in Martian pressure STT (no offset correction, p0=0). A drift of around 1 Pa between the first and the last test can be contributed to the outgassing of the instrument. (Right) Barocaps® 1.6 and 1.8 readings in STT vacuum measurements. These measurements can be used for determining interim p0 offset parameter of the Barocaps®
Fig. 13
Fig. 13
Barocaps® 1.8 (left) and 1.6 (right) with the reference pressure during a single measurement in STT functional test (no offset correction, p0=0)
Fig. 14
Fig. 14
(Left) HS location on the Remote Sensing Mast. (Right) Detail of HS PCB without covers. Humicaps® on right (white rectangles), Thermocap sensor heads next to them
Fig. 15
Fig. 15
Block diagram of the calibration equipment
Fig. 16
Fig. 16
Thermocaps and PT1000 sensors difference to reference after temperature calibration
Fig. 17
Fig. 17
Humidity testing setup for Martian range tests
Fig. 18
Fig. 18
HS test setup in Michigan Mars Environmental Chamber
Fig. 19
Fig. 19
(Top) Saturation and dry points for Humicap® 1 in low pressure CO2. (Bottom) Saturation and dry points for Humicap® 2 in low pressure CO2
Fig. 20
Fig. 20
(Top) TIRS exploded 3d drawing showing the components of the sensor head: the housing, the support place, and the calibration plate. From Perez-Izquierdo et al. (2018). (Middle) (Left) TIRS thermopiles with 100 n-bismuth-antimony/p-antimony (Bi0.87Sb0.13/Sb) thermocouples with a Seebeck coefficient of 135 μV/K each. (Middle) Stain-steel socket and thermopile chip (Credit IPHT). (Right) Thermopile filter glued to the nickel cap. From Sebastian et al. (2020). (Bottom) (Left) The support plate rear structure during thermopiles gluing. (Middle) The support plate with the front structure assembled. (Right) The calibration plate (inner side). From Sebastian et al. (2020)
Fig. 21
Fig. 21
(Left) Thermopiles external IR flux diagram. (Right) Thermopiles internal IR flux diagram. From Sebastian et al. (2020)
Fig. 22
Fig. 22
Sequential steps of TIRS’ calibration plan. From Sebastian et al. (2020)
Fig. 23
Fig. 23
(a) Spectral transmittance of the 8–14 μm (IR5), 14.5–15.5 μm (IR2), and 6.5–30 μm (IR1 and IR4) filters and spectral absorptance of the IF LW absorber at room temperature. (b) Spectral transmittance of the 0.3–3 μm (IR3) filter and spectral absorptance for the BBS absorber at room temperature. (c) Spectral responsivity of the 8–14 μm, 14.5–15.5 μm, 6.5–30 μm, and 0.3–3 μm thermopiles. (d) Spectral diffuse emissivity of TIRS aluminum surface treatments (inorganic black anodized and chromate conversion). From Sebastian et al. (2020)
Fig. 24
Fig. 24
TIRS Proto Flight Model relative (filled circles) and absolute (empty symbols) responsivities as a function of temperature. Colored lines represent a polynomial fit to absolute responsivities. (Insert) Experimental absolute responsivities obtained in the range of temperature shown in Table 13. From Sebastian et al. (2020)
Fig. 25
Fig. 25
TIRS PFM IR3 normalized thermopile response versus FoV angle. From Perez-Izquierdo et al. (2018)
Fig. 26
Fig. 26
Target temperature and irradiance uncertainty as result of thermal gradients for the nominal operation test data, (top) before applying thermal calibration, and (bottom) after applying thermal calibration. From Sebastian et al. (2021)
Fig. 27
Fig. 27
Wind Sensor Design Concept. Green plates are the wind sensor transducer boards
Fig. 28
Fig. 28
WS2 block diagram. The two transducer boards are connected to the ASIC by flexible PCB The HDRM is controlled directly from the MEDA-ICU by two lines: main and redundant; the main is switched off by a load cell included in the mechanism and redundant by a thermistor also part of the HDRM. The WS1 diagram is quite similar but without the HDRM. Each transducer board includes four hot dice and a single cold dice as well a thermistor in the back that monitors the board temperature. Lower image shows the two WS2 boards during the integration phase (Credit: AIRBUS-CRISA)
Fig. 29
Fig. 29
(Left) Position of WS1 and WS2 in their final configuration on the RSM. (Right) WS Transducer Board mounted on breadboard model called MP EQM+. It can be seen the four hot dice and the cold die in the back. Each hot die is a silicon cube which has printed two platinum resistances one for heating and one for sensing wire bonded to the board (see images detail). The cold die is similar but only the sensing part is wire bonded
Fig. 30
Fig. 30
Wind speed field around for several directions (0, 90 and 180). The simulation has been run with the FloEFD code with a model composed by 2.7 million cells (including solid, partial and fluid cells) (Bardera et al. ; Torres et al. 2017)
Fig. 31
Fig. 31
Adjustment of the power loss in the vacuum chamber to the injected power using the multiple regression derived coefficients Kcond1 (for die 1) and Krad
Fig. 32
Fig. 32
Tunnel tests with WS1 FM1 to obtain reduced set of mesh points. In the vertical axis GL12 and GT12 (labeled B2L and B2T) and flux direction in degrees in the horizontal axis
Fig. 33
Fig. 33
(Left) RDS upper (TOP) and lateral (LAT) detectors disposition, and (Right) RDS assembly 3D view
Fig. 34
Fig. 34
Lateral and Top opto-mechanical sets detail. (Left) RDS-DP Lateral channels (Lat) detail. (Right) RDS-DP Top channels and Top Housing detail
Fig. 35
Fig. 35
RDS-DP flexi-rigid PCB with two differentiated areas: Optical Head (OH) and Processing Electronics (PE)
Fig. 36
Fig. 36
(Left) Cutaway view of the SkyCam within the RDS. (Right) RDS-SkyCam Flight Model unit
Fig. 37
Fig. 37
SkyCam QM image of California sky. Clouds appears to the left and lower right; the Sun is visible with the ND-coated annulus. The bright sky near the Sun causes saturation and column bleeding
Fig. 38
Fig. 38
SPASOLAB facilities. (Left) LT/HT Chamber for offset and TFR calibrations. (Center) AM0 solar simulator for irradiance calibration. (Right) 4,5 m far away xenon/mercury lamp for ARF calibration
Fig. 39
Fig. 39
Offset calibration for the TOP (left) and LAT (right) channels as a function of the temperature
Fig. 40
Fig. 40
Thermal Response Function (TRF) for the TOP (left) and LAT (right) channels as a function of the temperature
Fig. 41
Fig. 41
Responsivity Calibration Results for lateral (left) and top (right) channels
Fig. 42
Fig. 42
Normalized experimental ARF for a Top channel: TOP3 (left), and a Lateral one: LAT-7 (right)
Fig. 43
Fig. 43
SkyCam electronics bias over temperature, with quadratic fit
Fig. 44
Fig. 44
SkyCam dark current field: the frame transfer dark near 30 C is shown on the left, the active dark is shown on the right
Fig. 45
Fig. 45
Dark current is shown over temperature. Frame-transfer dark current, averaged for the last two rows to be read out, is shown in DN per exposure. Frame-averaged active dark current is shown as DN/sec. In each case, and Arrhenius fit is shown
Fig. 46
Fig. 46
Transmission of the SkyCam optics over wavelength
Fig. 47
Fig. 47
The SkyCam flat field (left). A series of masks (right) identify the areas sensitive to the sky blue), the ND area (red annulus), the baffled area (4 red corners); transition areas are uncolored
Fig. 48
Fig. 48
SkyCam image from rover testing within enclosed chamber. The vertical bright streak is bleeding of highly saturated pixels. The remote sensing mast instrument are visible near the top
Fig. 49
Fig. 49
Images of resolution targets were used to assess modulation transfer function

References

    1. V. Apéstigue, Diseño de un radiometro miniaturizado para la exploración de Marte. PhD thesis, Universidad Politécnica de Madrid (2019). http://oa.upm.es/57356
    1. Apéstigue V., Arruego I., Martinez J., Jiménez J.J., Rivas J., Gonzalez M., Alvarez M., Azcue J., Martin-Ortega A., de Mingo J.R., Alvarez M., Bastide L.A., Carretero A., Santiago A., Martin I., Martin B., Alcacera M.A., Manzano J., Belenger T., Lopez R., Escribano D., Manzano P., Boland J., Cordoba E., Sanchez-Lavega A., Perez S., Sainz-Lopez A., Lemmon M.T., Smith M.D., Newman C.E., Gomez-Elvira J., Bridges N., Conrad P., de la Torre Juarez M., Urqui R., Rodriguez-Manfredi J.A. Radiation and Dust Sensor for MARS2020: technical design and development status overview; EPSC Proccedings, Vol. 10, EPSC2015-813-2; 2015.
    1. Arruego I., Apéstigue V., Jiménez-Martin J., Martinez-Oter J., Alvarez-Rios F.J., Gonzalez-Guerrero M., Rivas J., Azcue J., Martin I., Toledo D., Gomez L., Jimenez-Michavila M., DREAMS-SIS M.Y. The Solar Irradiance Sensor on-board the ExoMars 2016 lander. Adv. Space Res. 2017;60(1):103–120. doi: 10.1016/j.asr.2017.04.002. - DOI
    1. D. Banfield, J.A. Rodriguez-Manfredi, C.T. Russell, K.M. Rowe, D. Leneman, H.R. Lai, P.R. Cruce, J.D. Means, C.L. Johnson, A. Mittelholz, S.P. Joy, P.J. Chi, I.G. Mikellides, S. Carpenter, S. Navarro, E. Sebastian, J. Gomez-Elvira, J. Torres, L. Mora, V. Peinado, A. Lepinette, K. Hurst, P. Lognonné, S.E. Smrekar, W.B. Banerdt, Insight Auxiliary Payload Sensor Suite (APSS). Space Sci. Rev. 215(4) (2019). 10.1007/s11214-018-0570-x
    1. Banfield D., Spiga A., Newman C.E., Forget F., Lemmon M.T., Lorenz R., Murdoch N., Viudez-Moreiras D., Pla-Garcia J., Garcia R.F., Lognonné P., Karatekin Ö., Perrin C., Martire L., Teanby N., Hove B.V., Maki J.N., Kenda B., Mueller N.T., Rodriguez S., Kawamura T., McClean J.B., Stott A.E., Charalambous C., Millour E., Johnson C.L., Mittelholz A., Määttänen A., Lewis S.R., Clinton J., Stähler S.C., Ceylan S., Giardini D., Warren T., Pike W.T., Daubar I., Golombek M., Rolland L., Widmer-Schnidrig R., Mimoun D., Beucler É., Jacob A., Lucas A., Baker M., Ansan V., Hurst K., Mora-Sotomayor L., Navarro S., Torres J., Lepinette A., Molina A., Marin-Jimenez M., Gomez-Elvira J., Peinado V., Rodriguez-Manfredi J.A., Carcich B.T., Sackett S., Russell C.T., Spohn T., Smrekar S.E., Banerdt W.B. The atmosphere of Mars as observed by InSight. Nat. Geosci. 2020;13:190–198. doi: 10.1038/s41561-020-0534-0. - DOI

LinkOut - more resources