. 2021 Oct 29:15:701317.
doi: 10.3389/fnins.2021.701317. eCollection 2021.

Raloxifene Modulates Microglia and Rescues Visual Deficits and Pathology After Impact Traumatic Brain Injury

Affiliations

Raloxifene Modulates Microglia and Rescues Visual Deficits and Pathology After Impact Traumatic Brain Injury

Marcia G Honig et al. Front Neurosci. .

Abstract

Mild traumatic brain injury (TBI) involves widespread axonal injury and activation of microglia, which initiates secondary processes that worsen the TBI outcome. The upregulation of cannabinoid type-2 receptors (CB2) when microglia become activated allows CB2-binding drugs to selectively target microglia. CB2 inverse agonists modulate activated microglia by shifting them away from the harmful pro-inflammatory M1 state toward the helpful reparative M2 state and thus can stem secondary injury cascades. We previously found that treatment with the CB2 inverse agonist SMM-189 after mild TBI in mice produced by focal cranial blast rescues visual deficits and the optic nerve axon loss that would otherwise result. We have further shown that raloxifene, which is Food and Drug Administration (FDA)-approved as an estrogen receptor modulator to treat osteoporosis, but also possesses CB2 inverse agonism, yields similar benefit in this TBI model through its modulation of microglia. As many different traumatic events produce TBI in humans, it is widely acknowledged that diverse animal models must be used in evaluating possible therapies. Here we examine the consequences of TBI created by blunt impact to the mouse head for visual function and associated pathologies and assess raloxifene benefit. We found that mice subjected to impact TBI exhibited decreases in contrast sensitivity and the B-wave of the electroretinogram, increases in light aversion and resting pupil diameter, and optic nerve axon loss, which were rescued by daily injection of raloxifene at 5 or 10 mg/ml for 2 weeks. Raloxifene treatment was associated with reduced M1 activation and/or enhanced M2 activation in retina, optic nerve, and optic tract after impact TBI. Our results suggest that the higher raloxifene dose, in particular, may be therapeutic for the optic nerve by enhancing the phagocytosis of axonal debris that would otherwise promote inflammation, thereby salvaging less damaged axons. Our current work, together with our prior studies, shows that microglial activation drives secondary injury processes after both impact and cranial blast TBI and raloxifene mitigates microglial activation and visual system injury in both cases. The results thus provide a strong basis for phase 2 human clinical trials evaluating raloxifene as a TBI therapy.

Keywords: CB2 receptors; inflammatory responses; microglia; mouse model; neuroinflammation; raloxifene; traumatic brain injury; visual deficits.


Conflict of interest statement

The authors declare that the research was conducted in the absence of any commercial or financial relationships that could be construed as a potential conflict of interest.

Figures

FIGURE 1
FIGURE 1
Contrast sensitivity and visual acuity as measured using Optometry ∼2 months after impact. (A) The contrast sensitivity thresholds for both eyes were significantly higher in impact-vehicle mice than in sham-vehicle mice. Mice treated with raloxifene were similar to sham and improved over impact-vehicle mice. (B) Visual acuity for impact-vehicle mice was somewhat diminished compared to sham mice, but the reduction was not statistically significant. Mice treated with raloxifene showed a smaller reduction in visual acuity than the impact-vehicle mice. Data are pooled for the two eyes. Errors bars are SEMs. Animal numbers: 21 sham-vehicle mice, 26 impact-vehicle mice, 22 impact-ral5 mice, and 14 impact-ral10 mice.
FIGURE 2
FIGURE 2
Average flash-evoked scotopic ERG peak A-wave and B-wave amplitudes at ∼2 months after impact. (A) A-wave peak amplitudes, compared across the three brightest light intensities, were similar for sham-vehicle, impact-vehicle, and impact-ral10 mice, but were increased for the impact-ral5 mice (p = 0.0006 relative to sham). (B) B-wave peak amplitudes, compared across the six brightest light intensities, were reduced for impact-vehicle mice (p = 2.8 × 10− 5 relative to sham). Impact mice treated with 5 mg/kg raloxifene showed rescue of the B-wave deficit, with amplitudes increased compared to impact-vehicle mice (p = 2.0 × 10− 10). Raloxifene at 10 mg/ml did not yield rescue, with B-wave amplitudes similar to impact-vehicle mice and significantly less than in sham (p = 3.2 × 10− 5). Errors bars are SEMs. Animal numbers: 15 sham-vehicle mice, 17 impact-vehicle mice, 17 impact-ral5 mice, and 14 impact-ral10 mice.
FIGURE 3
FIGURE 3
Light aversion at ∼5 months after impact. Light aversion was plotted as cumulative avoidance of an enclosed chamber with increasing brightness, relative to an adjacent dark chamber. Impact-vehicle mice and impact-ral5 mice showed greater avoidance of the enclosed chamber with increasing light intensity than sham-vehicle mice across the three levels of illumination (p = 0.031). Mice treated with 10 mg/kg raloxifene, however, exhibited less light aversion than impact-vehicle mice (p = 0.029) and impact-ral5 mice (p = 0.033) but not significantly differently than sham mice. Thus, 10 mg/kg raloxifene, but not 5 mg/kg, rescued the increase in light aversion that resulted from impact TBI. Errors bars are SEMs. Animal numbers: 16 sham-vehicle mice, 20 impact-vehicle mice, 17 impact-ral5 mice, and 14 impact-ral10 mice.
FIGURE 4
FIGURE 4
Pupil responses to red and blue light ∼7 months after impact. (A) Pupil area is shown normalized to the pre-illumination baseline for sham mice. Pupil size at rest was greater in all groups of impact mice (including drug treated) than in sham mice (p = 0.0362), as well as during red light in the case of impact-vehicle mice (p = 0.0059) and blue light in the case of impact-vehicle mice (p = 0.0009) and impact-ral5 mice (p = 0.0033). (B) Pupil size is plotted as the % constriction from baseline for each group of mice. The % constriction during red and blue light was no different in sham, impact-vehicle, and impact-ral5 mice. Although 10 mg/kg raloxifene did not rescue the increase in resting pupil size caused by impact (p = 0.0086), it did normalize the absolute magnitude of constriction caused by red light and yielded hyperconstriction to blue light (p = 0.0014). As a result, % pupil constriction from baseline in response to blue light was significantly greater in impact-ral10 mice than in sham (p = 7.6 × 10− 8), as was the % constriction to red light (p = 0.0001). Errors bars are SEMs. Animal numbers: 21 sham-vehicle mice, 25 impact-vehicle mice, 22 impact-ral5 mice, and 14 impact-ral10 mice.
FIGURE 5
FIGURE 5
Optic nerve axon loss. (A) Impact-vehicle mice showed a significant 21.8% loss of optic nerve axons compared to sham mice. Treatment with 5 mg/kg raloxifene yielded partial rescue, with only a 7.4% reduction in optic nerve axons, such that axon abundance was significantly greater than for the impact-vehicle mice and only trended toward being significantly different from sham (p = 0.084). With raloxifene at 10 mg/kg, axon abundance was again significantly greater than in the impact-vehicle mice and indistinguishable from that in sham mice. Errors bars are SEMs. Animal numbers: 21 sham-vehicle mice, 25 impact-vehicle mice, 21 impact-ral5 mice, and 13 impact-ral10 mice. (B–E) High-magnification views of the optic nerve in sham-vehicle, impact-vehicle, impact-ral5, and impact-ral10 mice. The density of axons is obviously lower in the image from the impact-vehicle mouse, and glial cells occupy relatively more space than in the image from the sham mouse. The asterisk in C marks the nucleus of a glial cell. By contrast, axon density in the images from the impact-ral5 and impact-ral10 mice appears similar to that in the image from the sham mouse. Scale bar in (E) applies to (B–E).
FIGURE 6
FIGURE 6
Axon injury and microglial activation in the optic nerve. Confocal images of optic nerve sections from mice 3 days after impact TBI, taken from the region just beyond the extraocular muscle cone, immunostained with SMI-32 to detect injured axons and for IBA1 to reveal microglia. (A) Large SMI-32+ axon bulbs (magenta) and intensely stained microglia (green), indicative of injury to the nerve, are visible in the image from an impact-vehicle mouse. Note that, by contrast, in sham mice, axon bulb pathology is absent (and thus not shown here) and microglia are lightly labeled for IBA1 (see Figure 7A). (B) Microglia with more rounded shapes are present in impact mice treated with 10 mg/kg raloxifene, one of which appears to be engulfing an axon bulb. (C) Numerous microglia are seen clustered together, amidst a field of small SMI-32+ profiles that resemble debris from degenerating axons. (D–F) Higher-magnification views of the regions shown boxed in (C). The small arrow in (D) marks an especially large axon bulb. The larger arrow in (E) indicates a rounded microglial cell that appears to be engulfing an axon bulb. Scale bar in (A) applies to (A–C), and scale bar in (D) applies to (D–F).
FIGURE 7
FIGURE 7
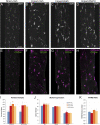
Microglia in the optic nerve 3 days after impact TBI. (A–F) Confocal images of sections immunostained for IBA1 to visualize microglia, for the M1 marker, CD16/32, and for the M2 marker, CD206. The upper panels show IBA1 immunolabeling (white), while the matching lower panels show the merge for CD16/32 (magenta) and CD206 (green). (A,E) Microglia in the sham-vehicle mouse have small cell bodies, have thin processes, and are lightly labeled. (B,F) Microglia in the impact-vehicle mouse are larger and more intensely labeled. (C,G) Microglia in impact-ral5 mice largely resemble those in impact-vehicle mice. (D,H) Microglia in impact-ral10 mice are larger, rounder in shape, and more intensely labeled than microglia in the impact-vehicle mice. The green CD206 immunolabeling in (H) is more predominant than in (F), reflecting the lower M1/M2 ratio for impact-ral10 mice. The scale bar in (A) applies to (A–H). (I–K) Quantification of IBA1, CD16/32, and CD206 immunolabeling. Optic nerve area occupied by microglia, size, and roundedness of IBA1+ particles, expression of IBA1, CD16/32, and CD206, and M1/M2 ratio were all increased in impact-vehicle mice. Raloxifene at 5 mg/ml reduced CD16/32 and CD206 expression, M1/M2 ratio, optic nerve area occupied by microglia, and the size and roundedness of IBA1+ particles relative to impact-vehicle mice, but not IBA1 expression. Microglial area and size and roundedness of IBA1+ particles were greater for impact-ral10 mice than for impact-vehicle mice, IBA1 and CD206 were increased above impact-vehicle levels, but CD16/32 to a lesser extent, resulting in a lower M1/M2 ratio. Numbers of optic nerves analyzed: 10 sham-vehicle mice, 11 impact-vehicle mice, 12 impact-ral5 mice, and 15 impact-ral10 mice. Yellow asterisks indicate significant differences between the impact-ral10 mice and the sham-vehicle mice; *p < 0.05, **p < 0.01.
FIGURE 8
FIGURE 8
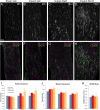
Microglia in the optic tract 3 days after impact TBI. (A–H) Confocal images of sections immunostained for IBA1 to visualize microglia, for the M1 marker, CD16/32, and for the M2 marker, CD206. The upper panels show IBA1 immunolabeling (white), while the matching lower panels show the merge for CD16/32 (magenta) and CD206 (green). (A,E) Microglia in the sham-vehicle mouse have small cell bodies, thin processes and are lightly labeled. (B–D,F–H) Microglia are larger and more intensely labeled in the impact mice with and without raloxifene treatment. The scale bar in (A) applies to (A–H). (I–K) Quantification of IBA1, CD16/32, and CD206 immunolabeling. For impact-vehicle mice, optic tract area occupied by microglia and size of IBA1+ particles were increased, IBA1, CD16/32, and CD206 expression were all slightly increased, but CD206 expression showed a slightly larger increase than CD16/32, resulting in a slightly lower M1/M2 ratio than in sham mice. The two doses of raloxifene after impact TBI similarly were associated with an increased microglial area, size of IBA1+ particles, and IBA1 and CD16/32 expression. However, as CD206 expression in raloxifene-treated mice was slightly higher than in sham mice and less than in impact-vehicle mice, their M1/M2 ratios were higher. Numbers of optic tracts analyzed: 11 sham-vehicle mice, 15 impact-vehicle mice, 16 impact-ral5 mice, and 16 impact-ral10 mice. Red, orange, and yellow asterisks indicate significant differences between the impact-vehicle mice, impact-ral5 mice, and impact-ral10 mice, respectively, compared to the sham-vehicle mice; *p < 0.05.
FIGURE 9
FIGURE 9
Expression of microglial markers 3 days after impact TBI. Levels of M0, M1, and M2 transcripts were determined by qPCR/NanoString for the optic nerve (A,B), thalamus (E,F), and retina (I,J). Histograms show average levels relative to sham mice or the M1/M2 ratio relative to sham. Multiple immunofluorescence was performed for IBA1, CD16/32, and CD206 on sections of optic nerve (C,D) and optic tract (G,H) and quantified by determining the integrated optical density for each marker in the region of interest. Histograms show the total integrated density relative to sham or the M1/M2 ratio relative to sham. Red, orange, and yellow asterisks indicate significant differences between the impact-vehicle mice, impact-ral5 mice, and impact-ral10 mice, respectively, compared to the sham-vehicle mice; *p < 0.05, **p < 0.01, ***p < 0.001. (K) Chi-square analysis of mean M0 transcript levels or IBA1 integrated optical density, mean M1 transcript levels or CD16/32 integrated optical density, and mean M2 transcript levels or CD206 integrated optical density, and the M1/M2 ratio was used to compare across experimental groups to determine how these four endpoints (M0 marker, M1 marker, M2 marker, and M1/M2 ratio) differed as a set for each of the tissues examined. Comparisons yielding p < 0.05 are highlighted in yellow.

Similar articles

Cited by

References

    1. Anyaegbu C. C., Mao Y., McGonigle T., Raja S., Clarke T., Black A. M. B., et al. (2021). Simultaneous flow cytometric characterization of multiple cell types and metabolic states in the rat brain after repeated mild traumatic brain injury. J. Neurosci. Methods 359:109223. 10.1016/j.jneumeth.2021.109223 - DOI - PubMed
    1. Armstrong R. A. (2018). Visual problems associated with traumatic brain injury. Clin. Exp. Optom. 101 716–726. 10.1111/cxo.12670 - DOI - PubMed
    1. Ashton J. C., Glass M. (2007). The cannabinoid CB2 receptor as a target for inflammation-dependent neurodegeneration. Curr. Neuropharmacol. 5 73–80. 10.2174/157015907780866884 - DOI - PMC - PubMed
    1. Atwood B. K., Straiker A., Mackie K. (2012). CB2: therapeutic target-in-waiting. Prog. Neuropsychopharmacol. Biol. Psychiatry 38 16–20. 10.1016/j.pnpbp.2011.12.001 - DOI - PMC - PubMed
    1. Bennett M. L., Bennett F. C., Liddelow S. A., Ajami B., Zamanian J. L., Fernhoff N. B., et al. (2016). New tools for studying microglia in the mouse and human CNS. Proc. Natl. Acad. Sci. U.S.A. 113 E1738–E1746. - PMC - PubMed