

Recommendations of Choice of Head Coil and Prescan Normalize Filter Depend on Region of Interest and Task
- PMID: 34776844
- PMCID: PMC8585748
- DOI: 10.3389/fnins.2021.735290
Recommendations of Choice of Head Coil and Prescan Normalize Filter Depend on Region of Interest and Task
Abstract
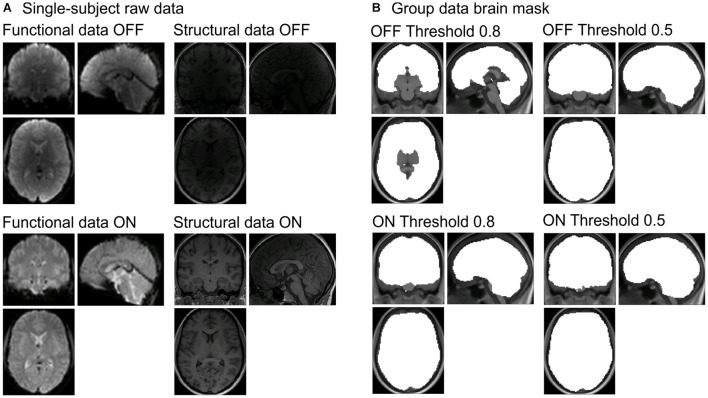
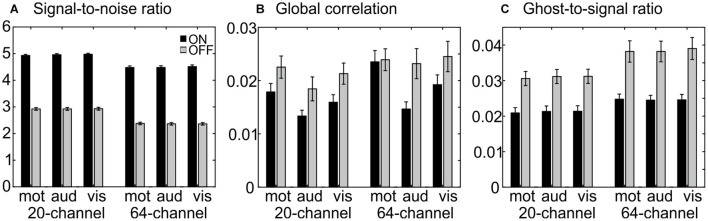
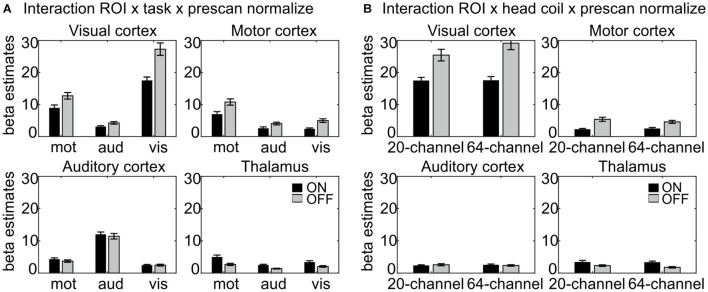
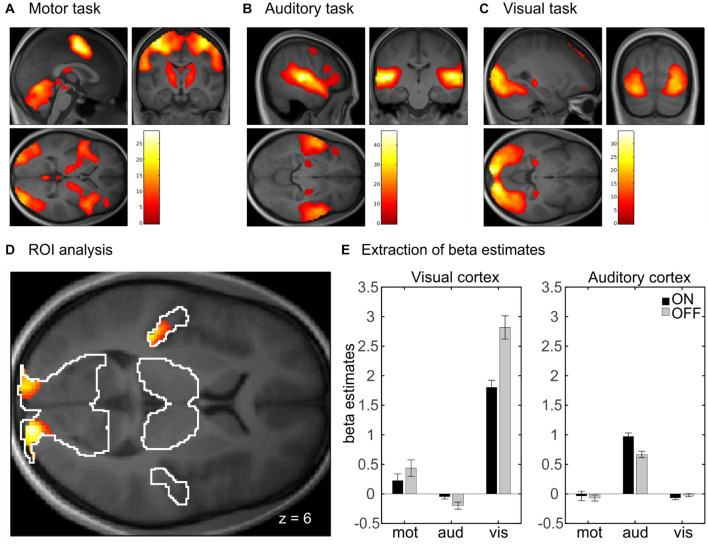
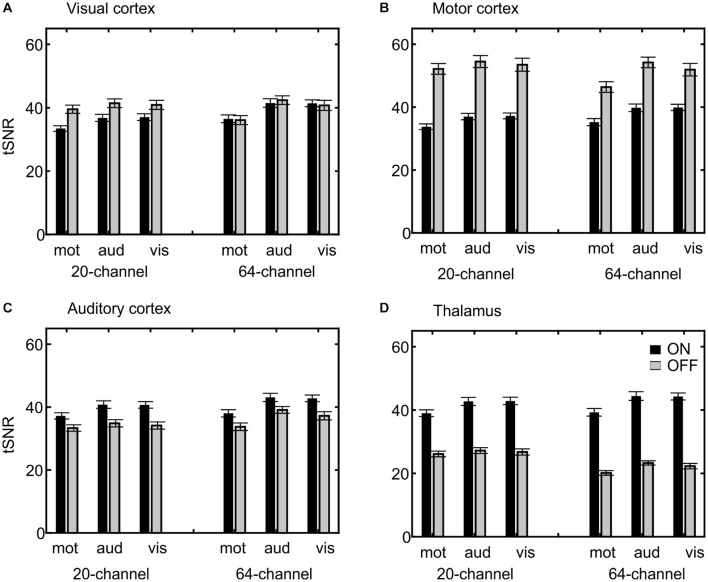
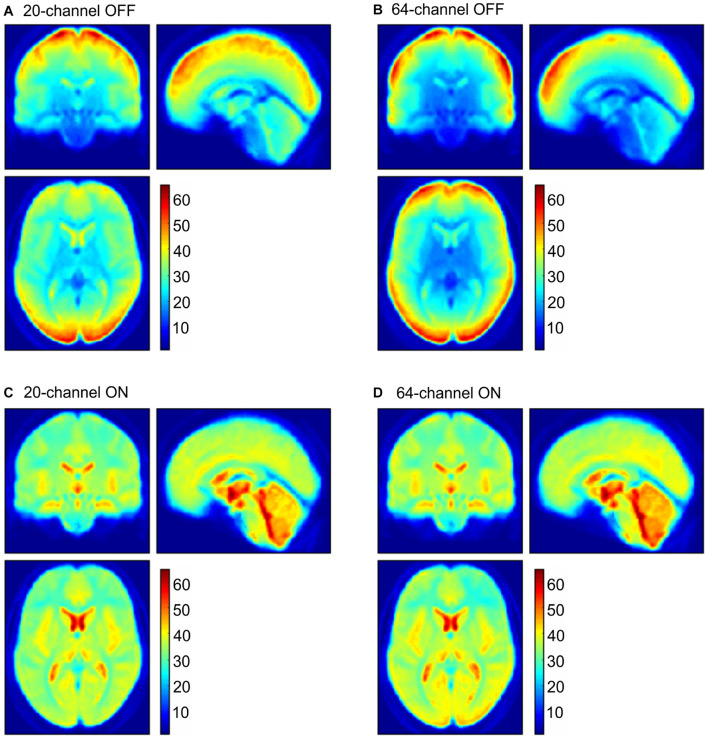
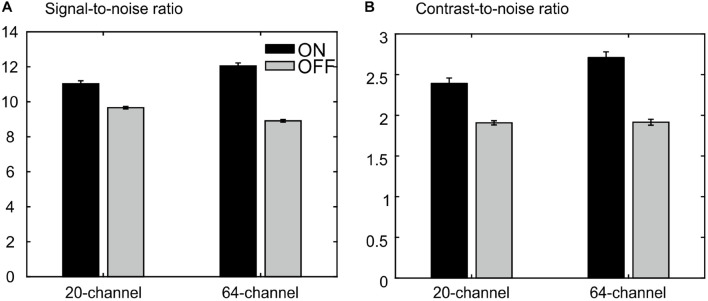
The performance of MRI head coils together with the influence of the prescan normalize filter in different brain regions was evaluated. Functional and structural data were recorded from 26 participants performing motor, auditory, and visual tasks in different conditions: with the 20- and 64-channel Siemens head/neck coil and the prescan normalize filter turned ON or OFF. Data were analyzed with the MRIQC tool to evaluate data quality differences. The functional data were statistically evaluated by comparison of the β estimates and the time-course signal-to-noise ratio (tSNR) in four regions of interest, i.e., the auditory, visual, and motor cortices and the thalamus. The MRIQC tool indicated a better data quality for both functional and structural data with the prescan normalize filter, with an advantage for the 20-channel head coil in functional data and an advantage for the 64-channel head coil in structural measurements. Nevertheless, recommendations for the functional data regarding choice of head coils and prescan normalize filter depend on the brain regions of interest. Higher β estimates and tSNR values occurred in the auditory cortex and thalamus with the prescan normalize filter, whereas the contrary was true for the visual and motor cortices. Due to higher β estimates in the visual cortex in the 64-channel head coil, this head coil is recommended for studies investigating the visual cortex. For most of the research questions, the 20-channel head coil is better suited for functional experiments, with the prescan normalize filter, especially when investigating deep brain areas. For anatomical studies, the 64-channel head coil seemed to be the better choice.
Keywords: 20-channel head coil; 64-channel head coil; MRIQC; anatomical images; echo-planar imaging; prescan normalize.
Copyright © 2021 Schmitt and Rieger.
Conflict of interest statement
The authors declare that the research was conducted in the absence of any commercial or financial relationships that could be construed as a potential conflict of interest.
Figures
Similar articles
-
Customization of neonatal functional magnetic resonance imaging: A preclinical phantom-based study.PLoS One. 2024 Nov 1;19(11):e0313192. doi: 10.1371/journal.pone.0313192. eCollection 2024. PLoS One. 2024. PMID: 39485821 Free PMC article.
-
Comparison of a 32-channel with a 12-channel head coil: are there relevant improvements for functional imaging?J Magn Reson Imaging. 2011 Jul;34(1):173-83. doi: 10.1002/jmri.22614. Epub 2011 May 25. J Magn Reson Imaging. 2011. PMID: 21618334
-
A 16-channel loop array for in vivo macaque whole-brain imaging at 3 T.Magn Reson Imaging. 2020 May;68:167-172. doi: 10.1016/j.mri.2020.02.008. Epub 2020 Feb 17. Magn Reson Imaging. 2020. PMID: 32081631 Free PMC article.
-
Functional Laterality of Task-Evoked Activation in Sensorimotor Cortex of Preterm Infants: An Optimized 3 T fMRI Study Employing a Customized Neonatal Head Coil.PLoS One. 2017 Jan 11;12(1):e0169392. doi: 10.1371/journal.pone.0169392. eCollection 2017. PLoS One. 2017. PMID: 28076368 Free PMC article.
-
A Specialized Multi-Transmit Head Coil for High Resolution fMRI of the Human Visual Cortex at 7T.PLoS One. 2016 Dec 2;11(12):e0165418. doi: 10.1371/journal.pone.0165418. eCollection 2016. PLoS One. 2016. PMID: 27911950 Free PMC article.
Cited by
-
A statistical approach to automated analysis of the low-contrast object detectability test for the large ACR MRI phantom.J Appl Clin Med Phys. 2025 Jul;26(7):e70173. doi: 10.1002/acm2.70173. J Appl Clin Med Phys. 2025. PMID: 40657681 Free PMC article.
-
Relationship between Memory Load and Listening Demands in Age-Related Hearing Impairment.Neural Plast. 2021 Jun 4;2021:8840452. doi: 10.1155/2021/8840452. eCollection 2021. Neural Plast. 2021. PMID: 34188676 Free PMC article.
-
Analysis of Factors Affecting Quality in Structural Magnetic Resonance Images.Hum Brain Mapp. 2025 Aug 1;46(11):e70271. doi: 10.1002/hbm.70271. Hum Brain Mapp. 2025. PMID: 40748186 Free PMC article.
-
Customization of neonatal functional magnetic resonance imaging: A preclinical phantom-based study.PLoS One. 2024 Nov 1;19(11):e0313192. doi: 10.1371/journal.pone.0313192. eCollection 2024. PLoS One. 2024. PMID: 39485821 Free PMC article.
-
Feasibility study of subject-specific, brain specific-absorption-rate maps retrieved from MRI data.Magn Reson Med. 2025 Sep;94(3):1136-1151. doi: 10.1002/mrm.30547. Epub 2025 May 24. Magn Reson Med. 2025. PMID: 40411380 Free PMC article.
References
LinkOut - more resources
Full Text Sources
Miscellaneous