. 2021 Oct 28:15:746821.
doi: 10.3389/fnins.2021.746821. eCollection 2021.

A Time-Course-Based Estimation of the Human Medial Olivocochlear Reflex Function Using Clicks

Affiliations

A Time-Course-Based Estimation of the Human Medial Olivocochlear Reflex Function Using Clicks

Sriram Boothalingam et al. Front Neurosci. .

Abstract

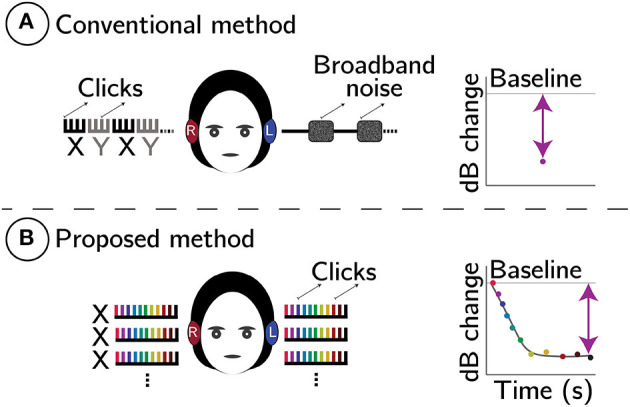
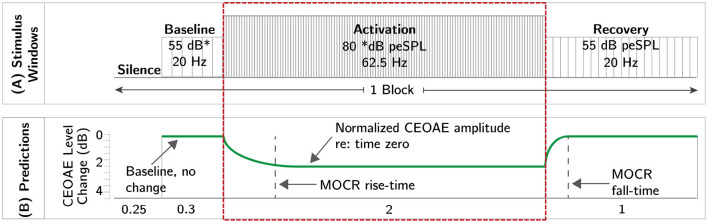
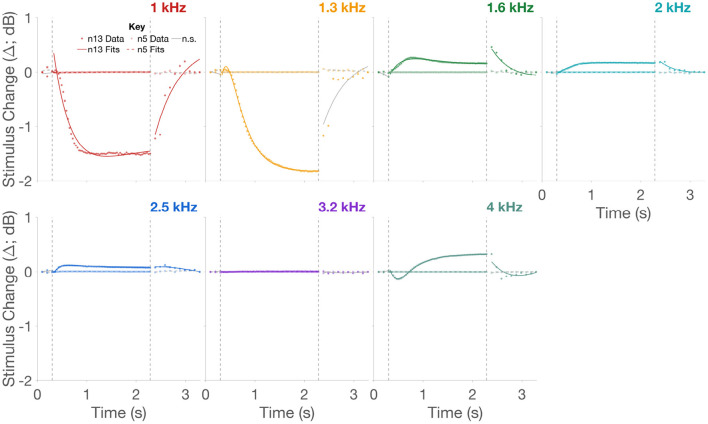
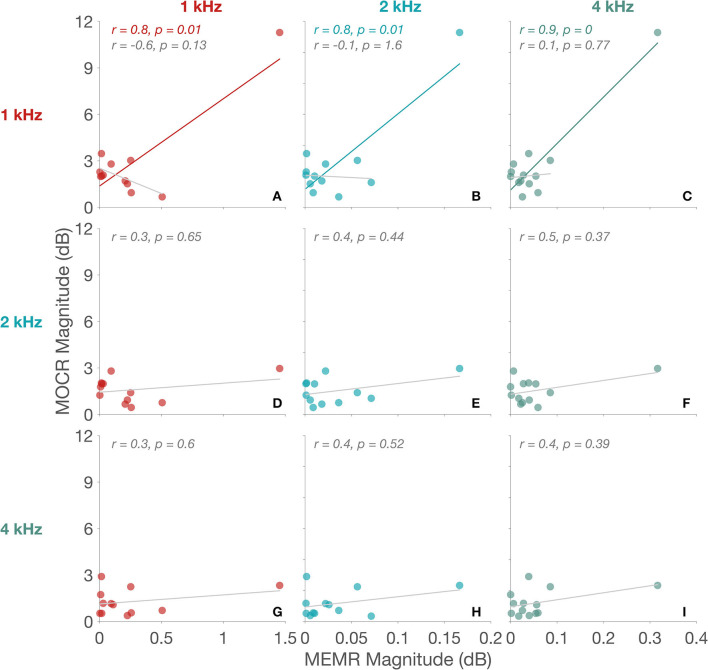
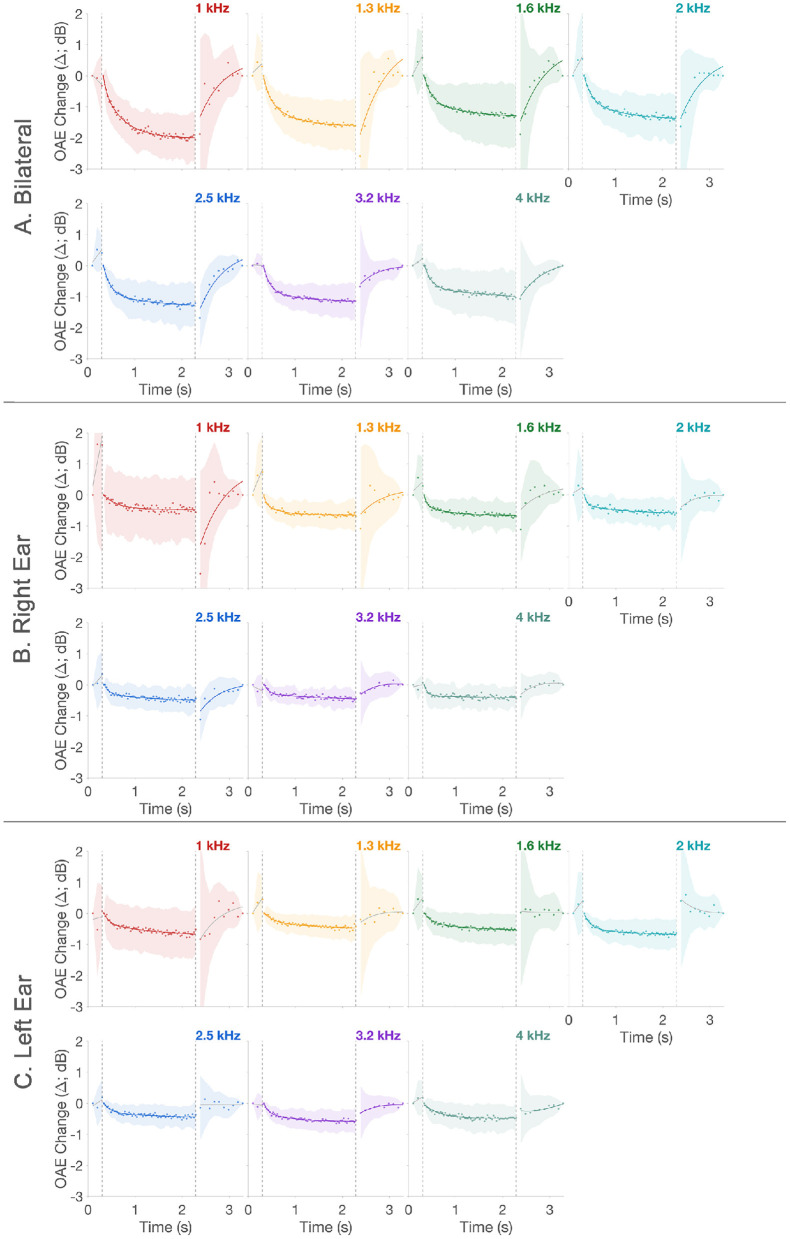
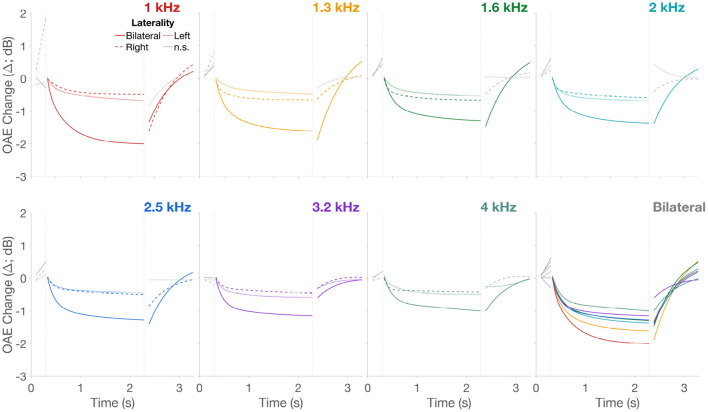
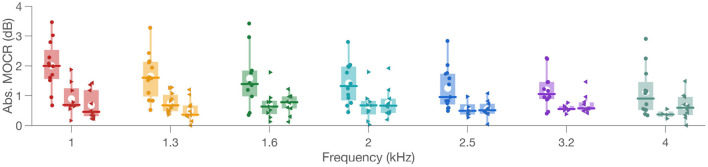
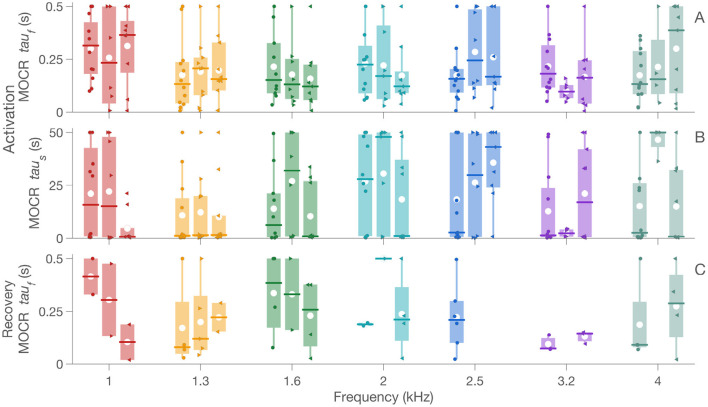
The auditory efferent system, especially the medial olivocochlear reflex (MOCR), is implicated in both typical auditory processing and in auditory disorders in animal models. Despite the significant strides in both basic and translational research on the MOCR, its clinical applicability remains under-utilized in humans due to the lack of a recommended clinical method. Conventional tests employ broadband noise in one ear while monitoring change in otoacoustic emissions (OAEs) in the other ear to index efferent activity. These methods, (1) can only assay the contralateral MOCR pathway and (2) are unable to extract the kinetics of the reflexes. We have developed a method that re-purposes the same OAE-evoking click-train to also concurrently elicit bilateral MOCR activity. Data from click-train presentations at 80 dB peSPL at 62.5 Hz in 13 young normal-hearing adults demonstrate the feasibility of our method. Mean MOCR magnitude (1.7 dB) and activation time-constant (0.2 s) are consistent with prior MOCR reports. The data also suggest several advantages of this method including, (1) the ability to monitor MEMR, (2) obtain both magnitude and kinetics (time constants) of the MOCR, (3) visual and statistical confirmation of MOCR activation.

Keywords: click-evoked otoacoustic emissions; kinetics; medial olivocochlear reflex; middle ear muscle reflex; time-course.


Conflict of interest statement

The authors declare that the research was conducted in the absence of any commercial or financial relationships that could be construed as a potential conflict of interest.

Figures

Figure 1
Figure 1
Schematic comparison between conventional (A) and proposed (B) MOCR methods. In both panels, comb-like structures represent click trains. In (A), X (black) are baseline CEOAEs without, and Y (gray) are with contralateral noise elicitor, respectively. Plots on the right are predicted change in CEOAE level (dB). In (B), whole click-trains (X) are averaged and CEOAE inhibition is estimated using a two-term exponential fit to the change in CEOAE level, Δ, as a function of time. The line-fit also provides reflex kinetics (time-constants).
Figure 2
Figure 2
Schematic of the experimental paradigm. Panel (A) illustrates the temporal order of different windows presented in the experiment. Panel (B) illustrates the predicted change in CEOAE level across different windows (green curves). The activation window, highlighted by the dotted red rectangle, is the same as the click paradigm described in Figure 1B. The duration of each click window are provided at the bottom of panel (B).
Figure 3
Figure 3
Stimulus change over time in two representative participants. Panels separate 1/3rd octave-band frequencies. Time-course data for the two participants, n5 and n13, are shown as squares and circles, respectively. Fits to the data are shown as dashed and unbroken lines, respectively. Colors represent the different frequencies. Fits lines in the respective color are statistically significant while fit lines in gray are not. The two vertical dashed lines in panels indicate the temporal separation between the three windows.
Figure 4
Figure 4
MEMR vs. MOCR. Panels (A96I) separate 1/3rd octave-band frequencies. MEMR magnitude are along the x-axis and MOCR magnitude are along the y-axis in all panels. MEMR frequencies are differentiated in panel columns and MOCR frequencies in panel rows. Comparison frequencies in each panel are the two frequencies intersecting the specific panel [e.g., panel (A) compares both MOCR and MEMR magnitude at 1 kHz]. Significant fits are indicated by frequency specific colors and non-significant fits are in gray. Corresponding Pearson correlation coefficient (r) and the p-value are provided at the top of each panel.
Figure 5
Figure 5
CEOAE change over time. Panels (A–C) show bilateral, right, and left ear mean time-course data, respectively. In all panels, scatter plot is the mean CEOAE change (Δ) across all 13 participants. The lines are statistical model fit to the data, linear (baseline) and two-term exponential (activation and recovery). Shaded region around the data represents ± 1SD around the mean. Colors represent the different frequencies. Fits lines in the respective color are statistically significant while fit lines in gray are not. The two vertical dashed lines in panels indicate the temporal separation between the three windows.
Figure 6
Figure 6
CEOAE change over time. Only the fits from Figure 5 are plotted to allow direct comparison across the three lateralities. Unbroken lines are bilateral, dashed lines are right, and dotted lines are left ear stimulation, respectively. Panels are separated by frequency in addition to the different colors for the 7 frequencies. Lines in gray are non-significant fits. Fits across all frequencies, only for the bilateral stimulation, is presented in the last panel “Bilateral” to allow direct visual comparison of CEOAE Δ as a function of frequency.
Figure 7
Figure 7
MOCR magnitude. Box plots show individual MOCR magnitude, i.e., absolute Δmax, as filled colored shapes at respective frequencies along the x-axis. Circle is bilateral, right-pointing triangle is right ear, and left-pointing triangle is for left ear data. Colors represent frequency in the x axis. In the box plots, the box represents the interquartile range, white circle is the mean, vertical line is the data range, and the horizontal line is the median.
Figure 8
Figure 8
MOCR tau. Panels (A,B) show data for tauf and taus in the activation window and panel (C) shows data for tauf in the recovery window. Similar to Figure 7, box plots show individual MOCR tau as colored boxes at respective frequencies along the x-axis. Colored circle is bilateral, right-pointing triangle is right ear, and left-pointing triangle is for left ear data. In the box plots, the box represents the interquartile range, white circle is the mean, vertical line is the data range, and the horizontal line is the median.

References

    1. Abdala C., Dhar S., Ahmadi M., Luo P. (2014). Aging of the medial olivocochlear reflex and associations with speech perception. J. Acoust. Soc. Am. 135, 755–765. 10.1121/1.4861841 - DOI - PMC - PubMed
    1. Backus B. C., Guinan J. J. (2006). Time-course of the human medial olivocochlear reflex. J. Acoust. Soc. Am. 119, 2889–2904. 10.1121/1.2169918 - DOI - PubMed
    1. Backus B. C., Guinan J. J. (2007). Measurement of the distribution of medial olivocochlear acoustic reflex strengths across normal-hearing individuals via otoacoustic emissions. J. Assoc. Res. Otolaryngol. 8, 484–496. 10.1007/s10162-007-0100-0 - DOI - PMC - PubMed
    1. Benjamini Y., Hochberg Y. (1995). Controlling the false discovery rate - a practical and powerful approach to multiple testing. J. R. Stat. Soc. Ser. B Methodol. 57, 289–300. 10.1111/j.2517-6161.1995.tb02031.x - DOI
    1. Berlin C. I., Hood L. J., Hurley A. E., Wen H., Kemp D. T. (1995). Binaural noise suppresses linear click-evoked otoacoustic emissions more than ipsilateral or contralateral noise. Hear. Res. 87, 96–103. 10.1016/0378-5955(95)00082-F - DOI - PubMed