Review
. 2021 Oct 29:15:770011.
doi: 10.3389/fnins.2021.770011. eCollection 2021.

Sensory Adaptation in the Whisker-Mediated Tactile System: Physiology, Theory, and Function

Affiliations
Review

Sensory Adaptation in the Whisker-Mediated Tactile System: Physiology, Theory, and Function

Mehdi Adibi et al. Front Neurosci. .

Abstract

In the natural environment, organisms are constantly exposed to a continuous stream of sensory input. The dynamics of sensory input changes with organism's behaviour and environmental context. The contextual variations may induce >100-fold change in the parameters of the stimulation that an animal experiences. Thus, it is vital for the organism to adapt to the new diet of stimulation. The response properties of neurons, in turn, dynamically adjust to the prevailing properties of sensory stimulation, a process known as "neuronal adaptation." Neuronal adaptation is a ubiquitous phenomenon across all sensory modalities and occurs at different stages of processing from periphery to cortex. In spite of the wealth of research on contextual modulation and neuronal adaptation in visual and auditory systems, the neuronal and computational basis of sensory adaptation in somatosensory system is less understood. Here, we summarise the recent finding and views about the neuronal adaptation in the rodent whisker-mediated tactile system and further summarise the functional effect of neuronal adaptation on the response dynamics and encoding efficiency of neurons at single cell and population levels along the whisker-mediated touch system in rodents. Based on direct and indirect pieces of evidence presented here, we suggest sensory adaptation provides context-dependent functional mechanisms for noise reduction in sensory processing, salience processing and deviant stimulus detection, shift between integration and coincidence detection, band-pass frequency filtering, adjusting neuronal receptive fields, enhancing neural coding and improving discriminability around adapting stimuli, energy conservation, and disambiguating encoding of principal features of tactile stimuli.

Keywords: information theory; neural coding; neural network; neuronal adaptation; noise correlation; rodent; somatosensory; whisker system.


Conflict of interest statement

The authors declare that the research was conducted in the absence of any commercial or financial relationships that could be construed as a potential conflict of interest.

Figures

Figure 1
Figure 1
Characterisation of the adaptation profile to repetitive stimulation. (A) Histological reconstruction of a sample layer 5 pyramidal neuron juxta-cellularly recorded from the vibrissal area of S1 in anaesthetised rats while applying deflections (200 μm in amplitude) to the principal whisker. (B) Raster plots and peri-stimulus time histograms (PSTHs) for the sample neuron in (A) for different stimulation frequencies. Vertical purple lines indicate individual deflections. Dots in the lower parts of panels indicate individual spikes and rows correspond to trials. (C) The cumulative response of the sample neuron as a function of time normalised to the response to the first deflection exhibiting a systematic decrease in responsiveness with time. The decline is steeper and reaches a lower level as the stimulation frequency increased. Error bars indicate standard error of the means (s.e.m.) across trials. (D) On average, across neurons, adaptation increases with stimulation frequency in an exponential manner (solid curve). Responsiveness index (RI) is defined as the net neuronal response rate to the 3-s train of deflections divided by the response to the first deflection. Error bars indicate s.e.m. (E) Prominent response facilitation in a subset of neurons. The response profile of three sample neurons exhibiting response facilitation is shown at stimulation frequency of 8 Hz. (F) Neuronal reconstruction and diversity of adaptation. Upper panel illustrates the morphology of 14 example reconstructed neurons and their cortical location as identified by histology. The lower panel shows the diversity of adaptation for the 14 neurons. (G) Response latencies increases over the time course of stimulation, irrespective of the dynamics of their response rate (facilitation versus adaptation). PSTHs for 3 sample neurons to 6 consecutive deflections at 2 Hz stimulation. Different shades of green represent the order of deflection within the simulation train, with darker corresponding to earlier deflections. Modified from Kheradpezhouh et al. (2017).
Figure 2
Figure 2
Parallel processing of tactile intensity during adaptation in the two trigeminal nuclei. (A) Sub-threshold post-synaptic responses of a PrV neuron to repeated low intensity input (blue) and high intensity stimulation (red). (B) Normalised peak sub-threshold response of PrV neurons for two intensities. PrV neurons exhibit less adaptation to the stronger stimulation. Error bars represent s.e.m. (C) Population averaged firing responses of PrV neurons as a function of stimulation velocity at low (blue circles), medium (orange squares), and high (red diamonds) intensity contexts. (D) Same data as in (C), but re-plotted as a function of normalised (Z-scores) velocity. (E) Sub-threshold post-synaptic responses of a SpVi neuron to repeated high and low intensity stimulation. (F) Normalised peak sub-threshold response of PrV neurons for low and high intensities. In contrast to PrV, SpVi neurons adapt more to higher intensity stimulation. Error bars represent s.e.m. (G) Average firing response of SpVi neurons as a function of stimulation velocity. (H) as in (G), but as a function of normalised (z-scored) velocity. Although unadapted responses (black circles) are similar for both nuclei, PrV encodes stimulus intensity more linearly at the high-intensity context and the SpVi better encodes the low-intensity context. Modified from Ganmor et al. (2010), Mohar et al. (2013), and Mohar et al. (2015).
Figure 3
Figure 3
Adaptation to sustained whisker stimulation generates systematic shifts in neuronal response statistics. (A) Extracellular multi-electrode array recording in rat whisker area of S1. The inset depicts the somatotopic organisation of barrels in layer 4 and infra-barrels in layer 6a, and the isolated spikes of a typical cortical neuron recorded from Barrel D4 while stimulating the principal whisker under three adaptation conditions (red: 0, green: 6 and magenta: 12 μm, 250 ms long at 80 Hz) followed by a single-cycle sinusoidal whisker vibration (0–33 μm). (B) Each panel shows response of the sample neuron to the 30 μm test stimulus in each adaptation condition. PSTHs are calculated in a 5 ms long bin sliding in 1 ms steps over 100 trials. (C) Adaptation shifts the response function of thalamic neurons. Vertical dashed lines represent the magnitude of the adapting stimulus. (D) Adaptation generates systematic shifts in the average population response function of S1 neurons. The response of simultaneously recorded units were averaged together to produce a population spike rate for individual sessions (n = 8 comprising a total of 159 single- and multi-units). Spike rates are calculated in a 50 ms window after test stimulus onset (boxes in B). (E) Trial-to-trial variations in neuronal responses of cortical single units (n = 64) as captured by Fano factor (variance over mean spike counts across trials) exhibits a shift by adaptation. (F) The coding accuracy quantified by Fisher information peaks at amplitudes higher than that of the adapting stimulus. Single-neuron Fisher information as a function of stimulus magnitude (n = 73 single neurons). All error bars indicate s.e.m. Modified from Adibi et al. (2013a) and Adibi et al. (2013b).
Figure 4
Figure 4
Effect of adaptation on population response correlations along the thalamocortical pathway. (A) The correlations in trial-by-trial spike-count variability (known as noise correlation) for a population of thalamic neurons in three adaptation states, as in Figure 3. Adaptation has small effect on the correlated variability across thalamic neurons. Error bars represent s.e.m. Colour conventions as in Figure 3. (B) Similar to (A) but for cortical neurons. Adaptation produces a systematic shift in the noise correlation characteristic function. Modified from Adibi et al. (2013b).
Figure 5
Figure 5
Adaptation maintains dynamics of synchrony in cortical neuronal populations. (A) Extracellular multi-electrode array recording in rat somatosensory cortex using a 10 × 10 array. The inset depicts the 10 × 10 array with 400 μm electrode spacing. (B) The probability density function (PDF) of the population activity triggered by spikes on an example electrode (arrows in A). This is identical to the cross-correlogram analysis. The peak of this PDF relative to chance level (denoted by C), represented by hp, quantifies the synchrony between each electrode and the pooled activity. The inset depicts the median of the PDF, denoted by dp, which estimates the delay (or lead) of each electrode relative to the population spiking at all other electrodes. (C) Map of electrodes colour coded by their corresponding dp values. The dp changes systematically from positive (leading the population) to negative (lagged relative to the population) most evident along the rows corresponded to the medio-lateral stereotaxic axis. (D) The mean and s.e.m. of strength of correlations (CCG) in spontaneous activity for informative pairs of units (where both electrodes in a pair were informative about sensory stimuli; cyan) and uninformative pairs (where both electrodes had low information about sensory stimuli; grey). Pairwise CCGs were calculated similar to that in (B), but across two electrodes. (E) The histogram of correlations in spontaneous activity (normalised to the chance level C) against spike-count correlations in the fluctuations of evoked neuronal activity (noise correlations) showing significant strong relation between them. (F) Adaptation maintains the structure of correlations across the network. Strength of coupling in the spontaneous activity (non-adapted state, the abscissa) is highly correlated (correlation coefficient, r = 0.94) with those during sustained sensory stimulation (adapted condition, the ordinate). Each circle corresponds to an electrode. (G) Same as in (F), but for dp. The values of dp for episodes of spontaneous activity were highly correlated with those for the sustained stimulation (r = 0.82). This indicated that the sequence of activation among electrodes is highly preserved across the spontaneous (non-adapted) and adapted conditions. (H) The position of electrodes in the functional space built based on the pairwise CCG values from (D). The functional space is reduced to two dimensions with multi-dimensional scaling (MDS). Colours of electrodes were assigned based on their spatial position as shown in the inset array. The spatial structure of coupling across neuronal population predicts the physical position of electrodes. (I) The mean and s.e.m. of distances in the 2-dimensional functional space at each physical distance. For dimensions higher than two, changes in the relation of functional space and anatomical space remained relatively small (less than 5%). (J) Adaptation increases signal correlations—correlations across response functions across stimuli—in neuronal populations. Signal correlation as a function of population size under the three adaptation states as in Figure 3. Colour convention is identical to Figure 3. Modified from Adibi et al. (2014) and Sabri et al. (2016).
Figure 6
Figure 6
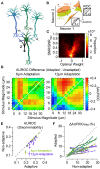
Adaptation improves population decoding. (A) Schematic representation of linear combination of neuronal activity by the downstream decoder. Coefficients w1, w2 and wi represent the synaptic weights between the neurons (top row) and the decoder (bottom). (B) Schematic representation of pooling (summation along identity line) and optimal decoding. The green and orange ovals represent the joint distribution of the neurons' responses to two sensory stimuli. The solid black lines represent the weight vectors. The weight vector corresponding to pooling is along the identity line. The bell-shaped areas on each weight vector represent the projection of the neuronal response distribution for each stimulus on the weight vector. Dashed lines correspond to the best criterion to discriminate the two stimuli. The insets show the hit rate versus false alarm rate (ROC) for every possible criterion. Grey shaded areas indicate area under ROC (AUROC) quantifying discriminability. (C) The optimal decoding weights for informative neurons are higher. Histogram of the optimal weights as a function of the signal-to-noise ratio (SNR) for each stimulus pair across populations of 8 single neurons. The weights and SNR values are normalised to that of the best neuron in each population. (D) Shift in discriminability from low amplitudes to amplitudes higher than the adapting stimulus for every stimulus pair, in a sample session with 11 simultaneously recorded single neurons. Left and right panels exhibit the difference in discriminability (in terms of AUROC) between adapted and non-adapted conditions. Pairwise decoding applies a distinct set of weights for every stimulus pair, while the groupwise decoding applies an identical weight vector to discriminate across all stimulus pairs. (E) Decoding generalisation across adaptation states. The abscissa indicates the discriminability for the adaptive optimal decoder when optimised on half of the adapted responses and tested on the other half. The ordinate corresponds to discriminability for the non-adaptive optimal decoder when optimised on the non-adapted responses and tested on the adapted responses. Error bars indicate s.e.m. (F) The per cent drop in discriminability when ignoring noise correlations, denoted by ΔAUROCdiag, for adaptation states, against the same measure in the non-adapted state. While noise correlations are higher in adapted states, the effect of ignoring these noise correlations under adaptation states is less compared to non-adapted state. Modified from Adibi et al. (2014).
Figure 7
Figure 7
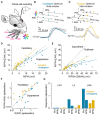
Adaptation enhances the information content of neuronal responses. (A) Mutual information (MI) between the whole stimulus set and the neuronal responses (from Figure 3) in adaptation condition (ordinate, 6 μm adaptation in green and 12 μm adaptation state in magenta) versus the non-adapted state (abscissa). Each data point corresponds to a single neuron (n = 73; square markers) or a cluster of multi-units (n = 86; diamonds). (B) As in (A), but plotting the response entropy of individual neuronal recordings. (C) As in (A,B), but plotting the response entropy conditional on stimulus. (D) Adaptation increases the average information content of individual spikes. Neuronal responses from different population sizes were pooled together and plotted against the average pooled spiking for every population size. (E) Percent increase in the single spike information in the adapted states relative to the non-adapted state. Data is from (D). The data points after the break in the abscissa include multi-unit clusters with the single-unit data. From the firing rates, we estimate that the total population consisted of ~215 single units. Modified from Adibi et al. (2013a).
Figure 8
Figure 8
Adaptation enhances summation of synaptic inputs and allows surround stimuli to facilitate responses. (A) Cortical neurons in the vibrissal area of S1 were recorded intra-cellularly during complex multi-whisker stimulation to nine whiskers. The principal whisker (PW) and each of the eight adjacent whiskers (AW) were stimulated with high-velocity deflections of fixed temporal structure (5-ms rise and 5-ms decay) in arbitrary angles. Deflections occurred stochastically in time and direction at a frequency of ~9.1 Hz. The inset represents whisker directions in an eight angle-binned space. (B) The multi-whisker stimulus that evokes the maximum response for each neuron was determined and played back in isolation (unadapted). Trial-averaged post-synaptic responses of a neuron to each of the nine whiskers, R(PW) or R(AW) are shown in black. The arrow indicates stimulus onset. The response to the multi-whisker stimuli, R(PW + ΣAWi), is shown in cyan (unadapted). (C) As in (B), but the multi-whisker stimulus was embedded within random surround stimuli (adapted, amber). (D) Response to the multi-whisker stimuli, R(PW + ΣAWi), is plotted against the responses to principal whisker deflection, R(PW). Surround inputs facilitated the PW response during adaptation by a factor of 1.28 ± 0.43 (n = 36, p < 10−9, sign test), but suppressed activity in unadapted neurons by a factor of 0.893 ± 0.269 (n = 33, p = 0.36, sign test). (E) Data from (D), but plotting response to the multi-whisker stimuli, R(PW + ΣAWi), against the sum of responses to individual deflections, R(PW) + ΣR(AWi). Multi-whisker summation was closer to linear during adaptation (amber, slope = 0.491, r = 0.631, p < 10−7) compared to highly sublinear summation in unadapted condition (cyan, slope = 0.223, r = 0.442, p < 10−9). (F) As in (D), but for the spiking activity of neurons (13 out of n = 33) that fired spikes in both conditions. Adaptation significantly facilitated spiking by a factor of 1.78 ± 1.04 (p = 0.02). In unadapted condition, responses were weakly suppressed or were not facilitated (0.85 ± 0.3, p = 0.30, sign test). (G) Same as (F), but separated for layer 2 and 3 (L2/3), L4, and L5/6 neurons. The PW stimulation alone is the most effective driver of spiking activity in unadapted neurons in L4 and 5/6, but optimal multi-whisker stimuli were more effective under adaptation. Spiking activity in L2/3 remained sparse. Modified from Ramirez et al. (2014).
Figure 9
Figure 9
Circumventing cortical adaptation enhances detection and frequency discrimination, while adaptation improves deviant detection. (A) Detection task: in a 2-alternative choice task, rats were trained to detect stimulus that applied to either the left or the right C1 whisker or its barrel column. A reward was given if the animal responded correctly by licking at one of two water spouts on the side associated with the stimulus side. Whisker stimuli (red) consisted of individual or uniform sequences of pulses (single-cycle 120-Hz sine-wave). Photo-stimuli (blue) consisted of individual or sequence of 1-ms square-wave pulses. Insets show extracellular recording from two neurons to 40-Hz photo-stimulation (left) and stimulation of the principal whisker (right). PSTHs with spike rates normalised to the initial response. (B) Normalised response to whisker pulses (shades of red, 33 neurons) and photo-stimulation (shades of blue, 15 neurons) at 5, 10, 20, and 40 Hz frequencies (darker corresponds to higher frequencies) showing frequency-dependent adaptation to whisker stimulation and little adaptation to photo-stimulation. (C) Velocity-response curves for detection of single-pulse whisker deflections for 3 rats. M50 and M100 correspond to the turning point and the asymptote of the cumulative Gaussian function fitted to each curve, respectively. (D) Circles represent detection performances for sequences of 1–4 stimuli (with 25 ms inter-pulse interval) at M50. Detection of single whisker stimulus was 67.9%. However, detection rate increased by an average of 2.3 ± 0.93% for every additional stimulus in the sequence. This is lower than the prediction that every stimulus had an equal perceptual detectability (equal probability model, solid curves). When adaptation was considered by reducing the detection probability of subsequent pulses according to observed neuronal adaptation in (B) (adapted probability model, dashed line), the predicted curve matched the behavioural detection performance. In contrast with whisker stimulation, detection performance of direct cortical photo-stimulation (in blue) was well-explained by equal detection probability of individual pulses (solid blue curve). This indicates that non-adaptive neural activation (as in B) results in uniform perceptual weight of individual pulses in a sequence. (E) Frequency discrimination task; as in (A), but the animals were trained to discriminate between a target stimulus (1-s long sequence of stimuli at 20 or 40 Hz) and a distractor with a lower frequency. (F) Three stimuli used in the discrimination task, with the corresponding normalised PSTHs (lower panels). Dashed line represents the adaptation level to whisker stimulus at 40 Hz. The whisker stimuli and uniform photo-stimulation pulses were set at M100 level. for the adapting photo-stimulation, the irradiation level of the initial pulse was set to M100, while the irradiation of subsequent pulses was reduced to that matching adaptation to whisker stimulation. (G) Frequency discrimination performances plotted against the frequency of distractor normalised to that of the target stimuli. Comparing discrimination performances for adaptation-free uniform photo-stimulation (blue) to whisker stimulation (red) reveals that adaptation reduces frequency discrimination performances. Adapting photo-stimulation (magenta) mimics whisker stimulation, resulting in reduced frequency discrimination performances. (H) Adaptation facilitates detection of deviant stimuli. The black trace shows average neural responses (n = 33) to a 2-s long 20-Hz whisker stimulation sequence (at the mean M50 velocity of 350°/s) with a single deviant (at M100, 850°/s). Response amplitude to subsequent pulses was decreased by 40% relative to the initial pulse, whereas deviant response amplitude remained close to non-adapted single-pulse response. (I) As in (H), but using whisker-box plot. The box shows the first and third quartiles, the inner line is the median. Box whiskers represent minimum and maximum values. (J) Deviant stimulus detection performance as a function of number of deviant stimuli, was higher for whisker stimuli than photo-stimulation. Deviant detection task: two base sequences of either whisker or photo stimuli (at M50 amplitude, 20-Hz frequency and duration of 2 s) presented bilaterally. The target sequence (left or right) contained 1, 4, or 10 deviant pulses of M100 in amplitude at a random time after 1.5 s. Rats were rewarded upon successful identification of the deviant-containing target sequence. Error bars indicate s.e.m. (B) and 95% CI (elsewhere). Modified from Musall et al. (2014).
Figure 10
Figure 10
Adaptation decreases stimulus detectability while improves discriminability. (A) Detection task: a piezoelectric actuator was placed on a single whisker, and a variable velocity probe stimulus (S+) was presented at a randomised time. The probe was preceded by an adapting stimulus on 50% of trials. Animals had a 1 s window following the stimulus in which to emit a lick response to receive a water reward. (B) Psychometric curve—response likelihood as a function of stimulus—averaged across all animals, for the non-adapted (grey) and adapted (amber) conditions. The black dashed line indicates the chance performance level (licks in catch trials). The inset depicts that behavioural detection thresholds are increased with adaptation. Each bar represents the perceptual detection threshold, measured as the 50% point of the sigmoidal fit (M50). Error bars represent s.e.m. (C) Ideal observer of neuronal activity. Neural activity was measured using voltage-sensitive dye (VSD) imaging of cortex within an approximately barrel-sized (300–500 μm in diameter) region of interest (ROI) time-averaged over 10–25 ms after stimulus onset. The ROI was defined as the 98% height contour of the 2D Gaussian fit to the trial-averaged non-adapted responses. The insets show the corresponding trial-averaged VSD images for no-stimulus (pre-stimulus, in black), non-adapted (grey), and adapted (amber) with the ROIs outlined in black. An average fluorescence within the ROI was extracted from each trial for ideal observer analysis. (D) The stimulus detectability of ideal observer decreased with adaptation. The d' value, a measure of the separation of stimulus vs. no-stimulus distributions, decreased with adaptation (p <0.005, n = 18, paired t-test). Error bars represent s.e.m. (E) Discrimination task: two piezoelectric actuators were used to stimulate two nearby whiskers. On a given trial either the whisker associated with the S+ (lick stimulus) or the nearby whisker associated with the S- (no-lick stimulus) was deflected with equal probability. Whisker deflection was at a fixed supra-threshold velocity. Animals were rewarded for responses to the S+ stimulus (hit), but were penalised with a time-out for responses to deflections of the S- whisker (false alarm, or FA). The insets depict neuronal responses to the two whisker stimuli (S+ and S-). Two responses were calculated for each single trial: the average fluorescence within the principal barrel area (bold ellipse), and that within the adjacent barrel area (thin ellipse) using the same method as in (C). The white scale bar in the inset represents 1 mm. (F) Adaptation improves the behavioural discriminability characterised in terms of the ratio of the proportion of hit trials to FA trials. (G) Example of linear discriminant analysis of neuronal responses to S+ and S- in the non-adapted (left panel) and adapted (right panel) conditions. Each data point corresponds to a single trial with the response from ROI associated with S+ principal whisker (ordinate) vs. the response from the ROI associated with S- principal whisker (abscissa). Neuronal response distributions to S+ and S- were obtained by projection of data points onto the axis orthogonal to the best discriminant line. The d' separation measure was then calculated for the two probability distributions. The d' values in this example were 1.7 (non-adapted) and 3.2 (adapted). (H) Adaptation enhances discrimination performance of the ideal observer of neuronal activity (p <0.05, n = 9, paired t-test). Error bars represent s.e.m. Modified from Ollerenshaw et al. (2014).

Similar articles

Cited by

References

    1. Abbott L., Varela J., Sen K., Nelson S. (1997). Synaptic depression and cortical gain control. Science 275, 221–224. 10.1126/science.275.5297.221 - DOI - PubMed
    1. Abeles M. (1982). Role of the cortical neuron: integrator or coincidence detector? Israel J. Med. Sci. 18, 83–92. - PubMed
    1. Adibi M. (2019). Whisker-mediated touch system in rodents: from neuron to behavior. Front. Syst. Neurosci. 13:40. 10.3389/fnsys.2019.00040 - DOI - PMC - PubMed
    1. Adibi M., Arabzadeh E. (2011). A comparison of neuronal and behavioral detection and discrimination performances in rat whisker system. J. Neurophysiol. 105:356. 10.1152/jn.00794.2010 - DOI - PubMed
    1. Adibi M., Clifford C. W. G., Arabzadeh E. (2013a). Informational basis of sensory adaptation: entropy and single-spike efficiency in rat barrel cortex. J. Neurosci. 33, 14921–14926. 10.1523/JNEUROSCI.1313-13.2013 - DOI - PMC - PubMed

LinkOut - more resources