. 2021 Oct 27:15:719364.
doi: 10.3389/fncir.2021.719364. eCollection 2021.

State-Dependent Effective Connectivity in Resting-State fMRI

Affiliations

State-Dependent Effective Connectivity in Resting-State fMRI

Hae-Jeong Park et al. Front Neural Circuits. .

Abstract

The human brain at rest exhibits intrinsic dynamics transitioning among the multiple metastable states of the inter-regional functional connectivity. Accordingly, the demand for exploring the state-specific functional connectivity increases for a deeper understanding of mental diseases. Functional connectivity, however, lacks information about the directed causal influences among the brain regions, called effective connectivity. This study presents the dynamic causal modeling (DCM) framework to explore the state-dependent effective connectivity using spectral DCM for the resting-state functional MRI (rsfMRI). We established the sequence of brain states using the hidden Markov model with the multivariate autoregressive coefficients of rsfMRI, summarizing the functional connectivity. We decomposed the state-dependent effective connectivity using a parametric empirical Bayes scheme that models the effective connectivity of consecutive windows with the time course of the discrete states as regressors. We showed the plausibility of the state-dependent effective connectivity analysis in a simulation setting. To test the clinical applicability, we applied the proposed method to characterize the state- and subtype-dependent effective connectivity of the default mode network in children with combined-type attention deficit hyperactivity disorder (ADHD-C) compared with age-matched, typically developed children (TDC). All 88 children were subtyped according to the occupation times (i.e., dwell times) of the three dominant functional connectivity states, independently of clinical diagnosis. The state-dependent effective connectivity differences between ADHD-C and TDC according to the subtypes and those between the subtypes of ADHD-C were expressed mainly in self-inhibition, magnifying the importance of excitation inhibition balance in the subtyping. These findings provide a clear motivation for decomposing the state-dependent dynamic effective connectivity and state-dependent analysis of the directed coupling in exploring mental diseases.

Keywords: ADHD; dynamic causal modeling (DCM); dynamic connectivity; effective connectivity; resting state fMRI.


Conflict of interest statement

The authors declare that the research was conducted in the absence of any commercial or financial relationships that could be construed as a potential conflict of interest.

Figures

Figure 1
Figure 1
Procedures for state-dependent effective connectivity analysis. A time series of the brain activity was obtained using a group independent component analysis (gICA) of the resting-state functional MRI (rsfMRI). A spectral DCM (spDCM) was estimated for each window separately for each participant. Parametric empirical Bayesian analysis (PEB) with temporal regressors of states can estimate the state-dependent effective connectivity in each individual. For the group-level analysis, the fixed effects model concatenates sets of windowed DCM parameters ({AwW}s) of all individuals into a set of DCM parameter series, which were then modeled with state labels using PEB. The random-effects model can be solved by applying PEB two times: one time for the windowed DCMs of each individual; and other time for the parameters of each individual, estimated using the first-level PEB to infer the group-level parameter sets. W:{1,2, …, number of windows}, N: number of subjects.
Figure 2
Figure 2
Simulation study with a time series generation and state-sequence estimation using HMM-MAR. (A) A network system with three different effective connectivity states, A1 (A matrix in Eq. 3 for the state S1), A2 (A matrix for the state S2), and A3 (A matrix for the state S3), used in this simulation are displayed. (B) fMRI signals with 300 s length (TR = 0.8 s, total 375 samples) were generated according to the dynamic equation in Eqs. 3–4 for five subjects by transitioning the three effective connectivity matrices. (C) the cross-spectral density for the three effective connectivity states is presented in blue, red, and yellow colors for A1, A2, and A3, respectively. (D, E) The ground-truth state sequence (D) and the estimated state sequence (E) obtained by the HMM-MAR analysis with K = 5 and order = 5. Only three clusters dominated the entire time for all the subjects. The blue, red, and yellow represent the three dominant effective connectivity states A1, A2, and A3. The occupation indices (or occupation times divided by the window size) of the three major states for each sliding window for (E) are displayed at (F). The state-dependent effective connectivity analysis is based on these estimated occupation indices as a state sequence.
Figure 3
Figure 3
Simulation results of the state-dependent effective connectivity estimation using HMM-MAR and spDCM. (A) The estimated state-dependent effective connectivity matrices (maximum a posteriori probability estimate; MAP) are displayed. A0 indicates the offset or baseline effective connectivity for states S1, S2, and S3. A(1), A(2) and A(3) indicate the MAPs corresponding to the regressors for S1, S2, and S3. The effect sizes that survived the criterion of 95% posterior confidence are shown in numbers and rectangles. (B) The scatter plots between estimated state-dependent effective connectivity and those of the ground truth are displayed. Estimated A for S1, S2, and S3 are a sum of A0 and A(1), a sum of A0 and A(2) and a sum of A0 and A(3), respectively. Among the 48 network parameters, 38 parameters (~80%) of the true parameters were in the range of 95% credible intervals of estimated parameters.
Figure 4
Figure 4
(A) The five independent components were used as nodes for the DMN network in the current study. (B) The occupation indices of five major cross-spectral density (CSD) states for all individuals, derived from HMM-MAR (K = 5 and order = 5), were concatenated and colored according to the amount of occupation portion of each state at each window. The states for individuals (21 windows per individual) were sectioned by white dotted lines. The lower panel of (B) indicates the occupation indices of all the states in each individual. (C) The auto-spectra (AS) and cross-spectra (CS) densities for the five major states were displayed. Among the five major states, S2, S4, and S5 were shared by all subjects.
Figure 5
Figure 5
Window size and overlap size-dependent log Bayes factors (BF) for the experimental data. The log BFs of the 12 pairs of window sizes and overlap sizes in the PEB analysis are presented. According to Zarghami and Friston (2020), we determined the optimal window size and overlap size by maximizing the relative log evidence (or the log BF) of a dynamic state model compared with a stationary model for a given window size and overlap size in the PEB analysis. The bracket contains a pair [window size, overlap size]. Among the 12 pairs of window size and overlap size, the window size = 60 and overlap size = 45 showed the highest BF in the DMN of the current experimental data. Overlap sizes were chosen to make sliding window steps (window size minus overlap size) 15 or 30 (see Method section in detail).
Figure 6
Figure 6
(A) Subtypes of individuals according to the similarity of the occupation indices of an individual of the five connectivity states. The similarity matrix of the occupation indices of the states across individuals was sorted using modularity optimization. The children with ADHD-C were labeled with “A,” and the TDC were labeled with “T.” The last three lows (red labels) indicate CBCL-EXT, CBCL-INT, and CBCL-AP. (B) The occupation indices of the three major CSD for each subtype C1, C2, and C3 are displayed. (C) The occupation indices of the three dominant states of individuals (S2, S4, and S5) were plotted with colors (subtype C1 with red, subtype C2 with blue, and subtype C3 with green).
Figure 7
Figure 7
Group PEB results for the state-dependent effective connectivity. Group-level state-dependent effective connectivity matrices, and their connection maps were displayed for connectivity states S2, S4, and S5. A fixed-effects model (concatenating all DCMs for all children) was used for all the subjects (both ADHD-C and TDC) using PEB. The fixed-effect models for ADHD-C and TDC's spDCMs were hierarchically modeled with group common (average) (A) and group difference (B) design matrix using an additional PEB analysis step. We found none or few group differences in the effective connectivity at the states S2 and S4 while stronger self-inhibition was found in the ADHD-C compared with TDC in the state S5. The colors in the rectangular matrix represent the MAP for the connectivity from the column element to the row element. The diagonal term in the rectangular matrix should be interpreted after a transformation of −0.5 exp(Aii), to constrain the diagonal term for the self-connectivity to be inhibitory. For clarity, diagonal elements are displayed with transformed values in the network diagram in the second row of (A). Effect sizes that survived a criterion of 95% posterior confidence are shown in numbers and rectangles.
Figure 8
Figure 8
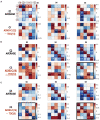
(Diagnostic) group comparison results for individuals in the same subtype according to the state occupation patterns. The group comparison results between ADHD-C and TDC according to subtype C1 (A), subtype C2 (B), and subtype C3 (C) are presented. Number in () indicates the number of subjects. We found significant (diagnostic) group differences in the effective connectivity at the functional connectivity states S2 and S5, particularly in the subtype group C3. Subtype-specific group differences between ADHD-C and TDC were detected. The diagonal term should be understood after a transformation of −0.5exp(Aii), indicating more self-inhibition for higher values of diagonal terms. The black rectangles show prominent group differences.
Figure 9
Figure 9
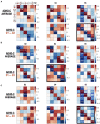
(A–C) Subtype-dependent effective connectivity differences in ADHD-C. According to functional connectivity states, children with ADHD-C have different effective connectivity, in particular between subtype groups C2 and C3 in state 5. See black rectangles that show obvious subtype differences.
Figure 10
Figure 10
The state-dependent connectivity at the DMN with the whole brain connectivity as a state sequence. (A) The state distribution according to the whole-brain functional connectivity occupation indices and (B) the cross-spectra for each state, derived from the HMM-MAR of the whole brain time series, are displayed. (C) The modularity optimization of the similarity matrix of individuals according to the state occupation indices of the whole brain clustered individuals into three subtypes regardless of diagnostic groups. (D) The group average and group-difference in the state-dependent effective connectivity at the DMN (ADHD-C – TDC) are presented to show the state-dependent DMN effective connectivity according to the state of the whole-brain connectivity. Not many group differences exist for state-dependent connectivity when ADHD-C and TDC are analyzed as a whole. This calls for a subtype-level comparison of the groups, as shown in Figures 8, 9.

References

    1. Achenbach T. M., Rescorla L. A. (2001). Manual for the ASEBA School-Age Forms and Profiles: an Integrated System of Multi-Informant Assessment. Burlington: ASEBA.
    1. Ainley V., Apps M. A., Fotopoulou A., Tsakiris M. (2016). ‘Bodily precision’: a predictive coding account of individual differences in interoceptive accuracy. Philos. Trans. R. Soc. Lond,. B,. Biol. Sci. 371:20160003. 10.1098/rstb.2016.0003 - DOI - PMC - PubMed
    1. Alexander L. M., Escalera J., Ai L., Andreotti C., Febre K., Mangone A., et al. . (2017). An open resource for transdiagnostic research in pediatric mental health and learning disorders. Sci. Data 4:170181. 10.1038/sdata.2017.181 - DOI - PMC - PubMed
    1. Allen E. A., Damaraju E., Plis S. M., Erhardt E. B., Eichele T., Calhoun V. D. (2014). Tracking whole-brain connectivity dynamics in the resting state. Cereb. Cortex 24, 663–676. 10.1093/cercor/bhs352 - DOI - PMC - PubMed
    1. Anderson A., Douglas P. K., Kerr W. T., Haynes V. S., Yuille A. L., Xie J., et al. . (2014). Non-negative matrix factorization of multimodal MRI, fMRI and phenotypic data reveals differential changes in default mode subnetworks in ADHD. Neuroimage 102(Pt 1), 207–219. 10.1016/j.neuroimage.2013.12.015 - DOI - PMC - PubMed

Publication types