

Whole Brain Mapping of Neurons Innervating Extraorbital Lacrimal Glands in Mice and Rats of Both Genders
- PMID: 34776876
- PMCID: PMC8585839
- DOI: 10.3389/fncir.2021.768125
Whole Brain Mapping of Neurons Innervating Extraorbital Lacrimal Glands in Mice and Rats of Both Genders
Abstract
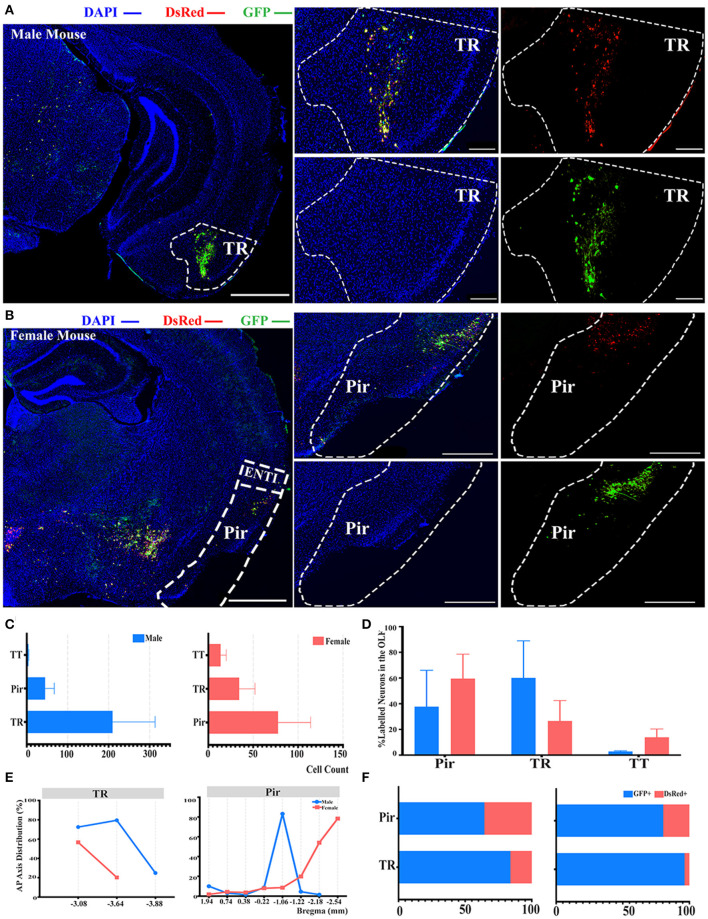
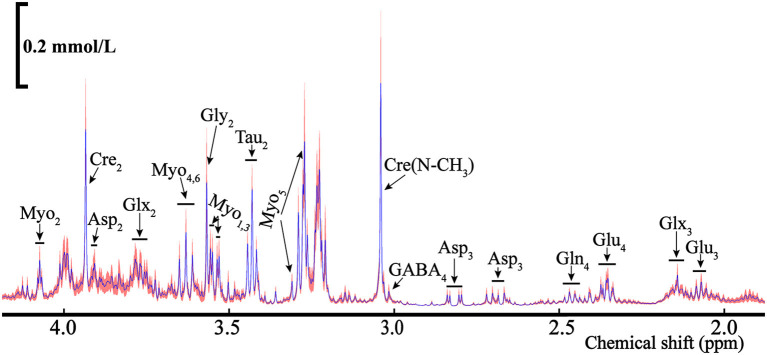
The extraorbital lacrimal glands (ELGs) secret tears to maintain a homeostatic environment for ocular surfaces, and pheromones to mediate social interactions. Although its distinct gender-related differences in mice and rats have been identified, its comprehensive histology together with whole-brain neuronal network remain largely unknown. The primary objective of the present study was to investigate whether sex-specific differences take place in histological and physiological perspectives. Morphological and histological data were obtained via magnetic resonance imaging (MRI), hematoxylin-eosin (HE) staining in mice and rats of both genders. The innervating network was visualized by a pseudorabies virus (PRV) mediated retrograde trans-multi-synaptic tracing system for adult C57BL6/J mice of both genders. In terms of ELGs' anatomy, mice and rats across genders both have 7 main lobes, with one exception observed in female rats which have only 5 lobes. Both female rats and mice generally have relatively smaller shape size, absolute weight, and cell size than males. Our viral tracing revealed a similar trend of innervating patterns antero-posteriorly, but significant gender differences were also observed in the hypothalamus (HY), olfactory areas (OLF), and striatum (STR). Brain regions including piriform area (Pir), post-piriform transition area (TR), central amygdalar nucleus (CEA), medial amygdalar nucleus (MEA), lateral hypothalamic area (LHA), parasubthalamic nucleus (PSTN), pontin reticular nucleus (caudal part) (PRNc), and parabrachial nucleus, (PB) were commonly labeled. In addition, chemical isotope labeling-assisted liquid chromatography-mass spectrometry (CIL-LC-MS) and nuclear magnetic resonance spectroscopy (NMR spectroscopy) were performed to reveal the fatty acids and metabolism of the ELGs, reflecting the relationship between pheromone secretion and brain network. Overall, our results revealed basic properties and the input neural networks for ELGs in both genders of mice, providing a structural basis to analyze the diverse functions of ELGs.
Keywords: CIL-LC-MS; anatomy; extraorbital lacrimal gland; neural circuits; neural tracing.
Copyright © 2021 Zhai, Li, Gui, Wang, Hu, Liu and Xu.
Conflict of interest statement
The authors declare that the research was conducted in the absence of any commercial or financial relationships that could be construed as a potential conflict of interest.
Figures


Similar articles
-
Parasubthalamic and calbindin nuclei in the posterior lateral hypothalamus are the major hypothalamic targets for projections from the central and anterior basomedial nuclei of the amygdala.Brain Struct Funct. 2017 Sep;222(7):2961-2991. doi: 10.1007/s00429-017-1379-1. Epub 2017 Mar 3. Brain Struct Funct. 2017. PMID: 28258483
-
Light cycle phase advance as a model for jet lag reprograms the circadian rhythms of murine extraorbital lacrimal glands.Ocul Surf. 2021 Apr;20:95-114. doi: 10.1016/j.jtos.2021.02.001. Epub 2021 Feb 11. Ocul Surf. 2021. PMID: 33582293
-
Neuronal connections of the central amygdalar nucleus with refeeding-activated brain areas in rats.Brain Struct Funct. 2018 Jan;223(1):391-414. doi: 10.1007/s00429-017-1501-4. Epub 2017 Aug 29. Brain Struct Funct. 2018. PMID: 28852859 Free PMC article.
-
Elucidation of the anatomy of a satiety network: Focus on connectivity of the parabrachial nucleus in the adult rat.J Comp Neurol. 2016 Oct 1;524(14):2803-27. doi: 10.1002/cne.23992. Epub 2016 May 5. J Comp Neurol. 2016. PMID: 26918800 Free PMC article.
-
High-Fat Nutritional Challenge Reshapes Circadian Signatures in Murine Extraorbital Lacrimal Glands.Invest Ophthalmol Vis Sci. 2022 May 2;63(5):23. doi: 10.1167/iovs.63.5.23. Invest Ophthalmol Vis Sci. 2022. PMID: 35588356 Free PMC article.
Cited by
-
Mdivi-1 improves postoperative neurocognitive disorders in aged rats undergoing splenectomy by inhibiting dynamin-related protein-1.Ann Transl Med. 2022 Dec;10(24):1338. doi: 10.21037/atm-22-5496. Ann Transl Med. 2022. PMID: 36660632 Free PMC article.
-
Use of a tissue clearing technique combined with retrograde trans-synaptic viral tracing to evaluate changes in mouse retinorecipient brain regions following optic nerve crush.Neural Regen Res. 2023 Apr;18(4):913-921. doi: 10.4103/1673-5374.353852. Neural Regen Res. 2023. PMID: 36204863 Free PMC article.
-
At the heart of the interoception network: Influence of the parasubthalamic nucleus on autonomic functions and motivated behaviors.Neuropharmacology. 2022 Feb 15;204:108906. doi: 10.1016/j.neuropharm.2021.108906. Epub 2021 Nov 29. Neuropharmacology. 2022. PMID: 34856204 Free PMC article. Review.
References
-
- Barbier M., Chometton S., Peterschmitt Y., Fellmann D., Risold P. Y. (2017). Parasubthalamic and calbindin nuclei in the posterior lateral hypothalamus are the major hypothalamic targets for projections from the central and anterior basomedial nuclei of the amygdala. In Brain Structure and Function (Vol. 222, Issue 7). 10.1007/s00429-017-1379-1 - DOI - PubMed
Publication types
MeSH terms
LinkOut - more resources
Full Text Sources