. 2021 Oct 29:15:734231.
doi: 10.3389/fnhum.2021.734231. eCollection 2021.

Predictability-Based Source Segregation and Sensory Deviance Detection in Auditory Aging

Affiliations

Predictability-Based Source Segregation and Sensory Deviance Detection in Auditory Aging

Christiane R Neubert et al. Front Hum Neurosci. .

Abstract

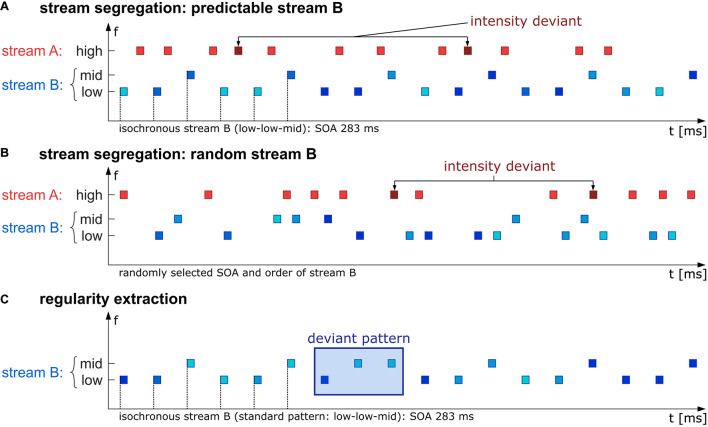
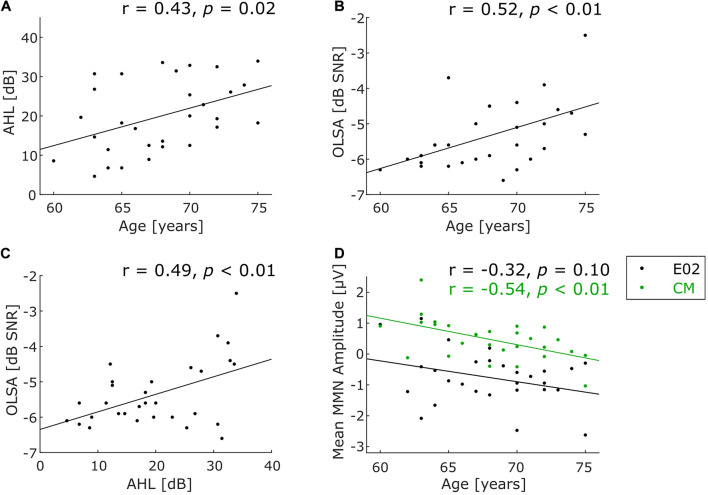
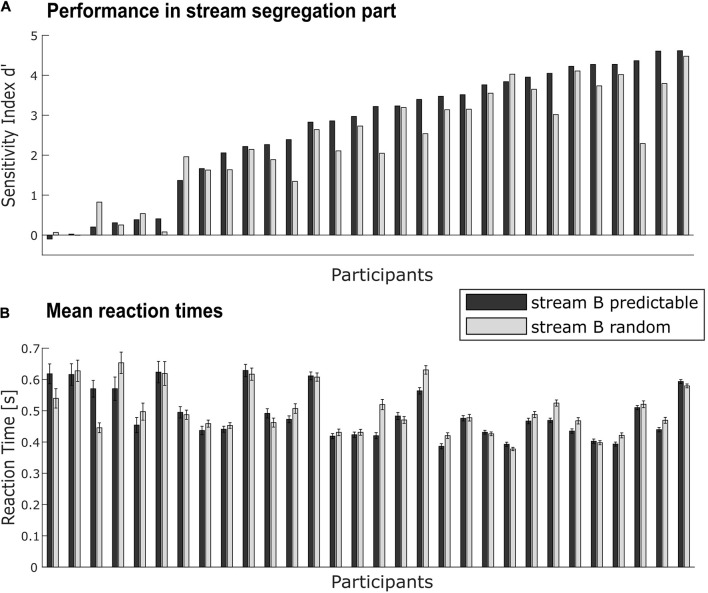
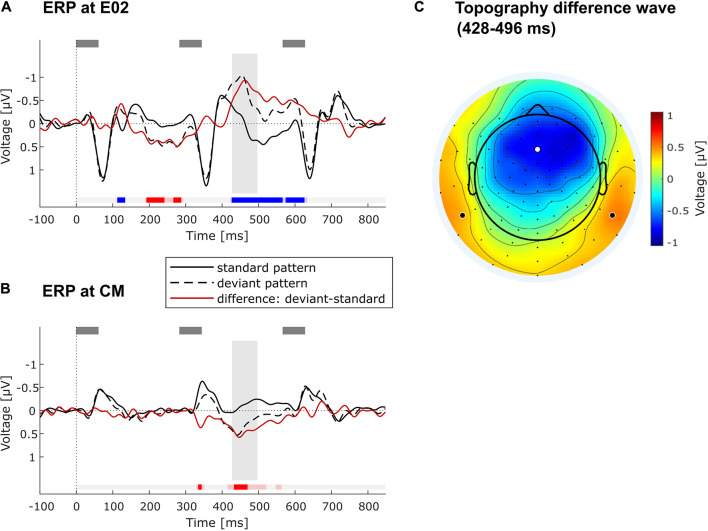
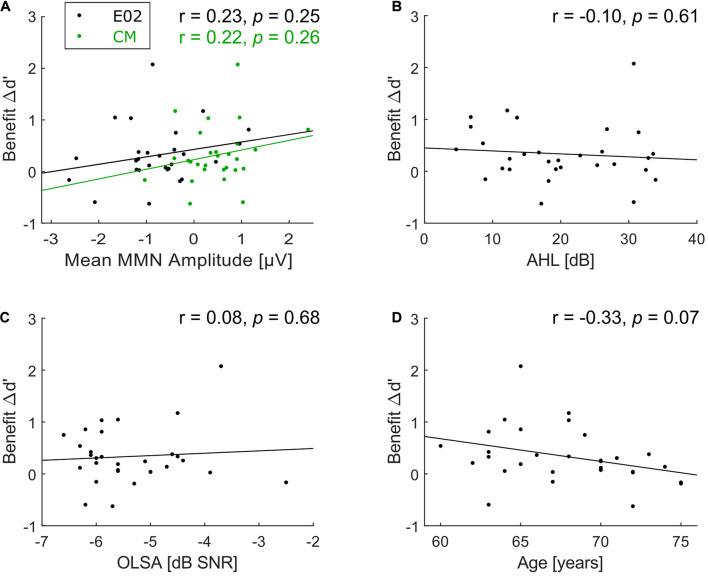
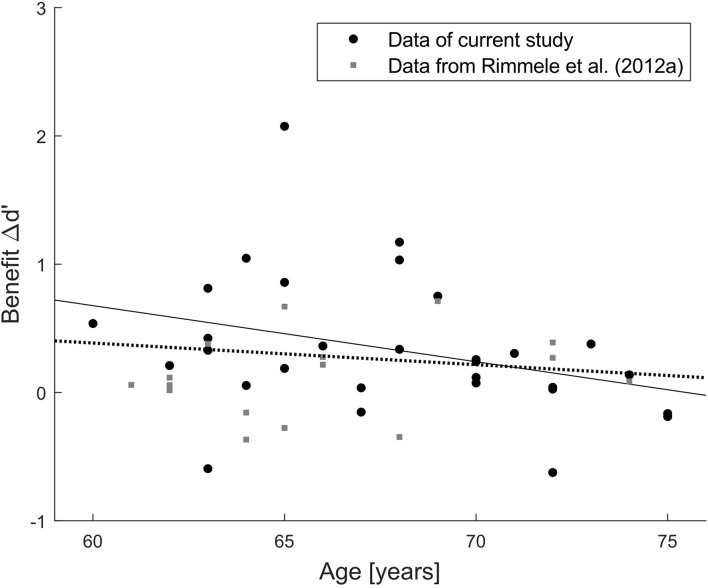
When multiple sound sources are present at the same time, auditory perception is often challenged with disentangling the resulting mixture and focusing attention on the target source. It has been repeatedly demonstrated that background (distractor) sound sources are easier to ignore when their spectrotemporal signature is predictable. Prior evidence suggests that this ability to exploit predictability for foreground-background segregation degrades with age. On a theoretical level, this has been related with an impairment in elderly adults' capabilities to detect certain types of sensory deviance in unattended sound sequences. Yet the link between those two capacities, deviance detection and predictability-based sound source segregation, has not been empirically demonstrated. Here we report on a combined behavioral-EEG study investigating the ability of elderly listeners (60-75 years of age) to use predictability as a cue for sound source segregation, as well as their sensory deviance detection capacities. Listeners performed a detection task on a target stream that can only be solved when a concurrent distractor stream is successfully ignored. We contrast two conditions whose distractor streams differ in their predictability. The ability to benefit from predictability was operationalized as performance difference between the two conditions. Results show that elderly listeners can use predictability for sound source segregation at group level, yet with a high degree of inter-individual variation in this ability. In a further, passive-listening control condition, we measured correlates of deviance detection in the event-related brain potential (ERP) elicited by occasional deviations from the same spectrotemporal pattern as used for the predictable distractor sequence during the behavioral task. ERP results confirmed neural signatures of deviance detection in terms of mismatch negativity (MMN) at group level. Correlation analyses at single-subject level provide no evidence for the hypothesis that deviance detection ability (measured by MMN amplitude) is related to the ability to benefit from predictability for sound source segregation. These results are discussed in the frameworks of sensory deviance detection and predictive coding.

Keywords: Electroencephalography (EEG); auditory scene analysis; elderly listeners; foreground-background separation; mismatch negativity (MMN); predictive coding; temporal processing.


Conflict of interest statement

The authors declare that the research was conducted in the absence of any commercial or financial relationships that could be construed as a potential conflict of interest.

Figures

FIGURE 1
FIGURE 1
Schematic illustration of the stimulus paradigm. In the first experimental part, participants were instructed to detect intensity deviants (probability in sequence 10%, deviants are 10 dB higher in level than standards) in a high-frequency stream A (red rectangles). The task-irrelevant stream B (blue rectangles) was presented in either an isochronous (SOA 283 ms) and therefore predictable low-low-mid pattern (A) or random in the chosen SOA (160, 270, or 420 ms) and frequency (either low or mid, B). The second experimental part was a passive listening condition in which just the B stream was presented (isochronous, SOA 283 ms) containing standard low-low-mid triplets which were rarely interrupted by a deviant low-mid-mid triplet with probability of 17% (C). SPL levels in stream B across all conditions (A–C) varied between 55 and 75 dB illustrated by different blue hues.
FIGURE 2
FIGURE 2
Scatterplots for characterizing the participant sample. (A) Correlation of age and peripheral hearing status, (B) correlation of age and speech-in-noise comprehension, (C) correlation of the hearing tests with one another, (D) correlation of age and deviance detection measured by MMN at frontocentral electrode position (E02, black dots) and common mastoids (CM, green dots). Note that only 28 participants were included for the latter correlation (see text for details). Significantly positive correlations indicate that higher age is associated with higher average hearing loss (A, p = 0.02) and with worse speech-in-noise comprehension (B, p < 0.01). Moreover, higher average hearing loss is associated with worse speech-in-noise comprehension (C, p < 0.01). A significant negative correlation between MMN amplitude and age only for CM shows less positive amplitudes with increasing age (D, green line, p < 0.01).
FIGURE 3
FIGURE 3
Individual performance in the target detection task. (A) Performance for each participant (N = 30) as measured by sensitivity d’ for predictable (black bars) and random conditions (gray bars). (B) Mean reaction times to detected targets in the task-relevant stream for each participant in both conditions (notation as in A). Error bars indicate the standard error in each condition within the participant. Data in both panels is sorted by performance in the predictable condition.
FIGURE 4
FIGURE 4
ERP results. (A) Grand-average ERPs at frontocentral electrode position E02 across all included participants (N = 28) elicited by standard (solid black line) and deviant triplets (dashed black line) as well as their difference wave (red line). Gray rectangles above denote the tones. Timepoint 0 refers to the onset of the second tone in low-low-mid (standard) or low-mid-mid triplet (deviant). Blue/red markings under the ERPs indicate significant negative/positive deviation of the difference wave from zero as determined in running t-test with FDR-correction of the alpha level. Faint blue/red markings show significant negative/positive deviation with alpha level p < 0.05 (without correction). The gray vertical rectangle highlights the chosen time window (428–496 ms) around the peak of the negativity in the difference wave. (B) Grand-average ERPs at common mastoids (CM) across all included participants (N = 28). All markings, rectangles and lines have the same meaning as in (A). (C) Topography of the difference wave in the chosen time window (428–496 ms), showing a frontocentral negativity with polarity inversion at the mastoids. The white dot indicates the location of E02 used for the ERP plot in (A). Bold black dots show channel locations of left and right mastoid (both were averaged for ERP plot in B).
FIGURE 5
FIGURE 5
Scatterplots of correlations with benefit. (A) Correlation between benefit Δd’ and mean MMN amplitude at frontocentral electrode position E02 (black dots) and common mastoids (CM, green dots; note that just 28 participants were included for both correlations), (B) between benefit Δd’ and average hearing loss (AHL), (C) between benefit Δd’ and speech-in-noise comprehension, and (D) between benefit Δd’ and age. No significant correlations with benefit Δd’ were found.
FIGURE 6
FIGURE 6
Post hoc joint analysis of two independent participant samples. Scatterplot of the relation between age and benefit Δd’ for performance in the predictable/isochronous minus random condition. Each dot refers to one individual data point (black dots: current study, gray squares: Exp. 2 in Rimmele et al., 2012a). Solid line indicates correlation in the current study (r = –0.33, p = 0.07, N = 30), dotted line indicates correlation in the combined data (r = –0.14, p = 0.34, N = 46).

References

    1. Alain C., Dyson B. J., Snyder J. S. (2006). “Aging and the perceptual organization of Sounds: A Change of Scene?” In Handbook of Models for Human Aging, (ed) Michael C. P. Amsterdam: Elsevier. 759–769. 10.1016/B978-012369391-4/50065-5 - DOI
    1. Alain C., Woods D. L. (1999). Age-related changes in processing auditory stimuli during visual attention: evidence for deficits in inhibitory control and sensory memory. Psychol. Aging 14 507–519. 10.1037/0882-7974.14.3.507 - DOI - PubMed
    1. Aman L., Picken S., Andreou L. V., Chait M. (2021). Sensitivity to temporal structure facilitates perceptual analysis of complex auditory scenes. Hear. Res. 400:108111. 10.1016/j.heares.2020.108111 - DOI - PMC - PubMed
    1. Andreou L. V., Kashino M., Chait M. (2011). The role of temporal regularity in auditory segregation. Hear. Res. 280 228–235. 10.1016/j.heares.2011.06.001 - DOI - PubMed
    1. Baldeweg T., Williams J. D., Gruzelier J. H. (1999). Differential changes in frontal and sub-temporal components of mismatch negativity. Int. J. Psychophysiol. 33 143–148. 10.1016/S0167-8760(99)00026-4 - DOI - PubMed

LinkOut - more resources