

Human Brain and Blood N-Glycome Profiling in Alzheimer's Disease and Alzheimer's Disease-Related Dementias
- PMID: 34776937
- PMCID: PMC8579010
- DOI: 10.3389/fnagi.2021.765259
Human Brain and Blood N-Glycome Profiling in Alzheimer's Disease and Alzheimer's Disease-Related Dementias
Abstract
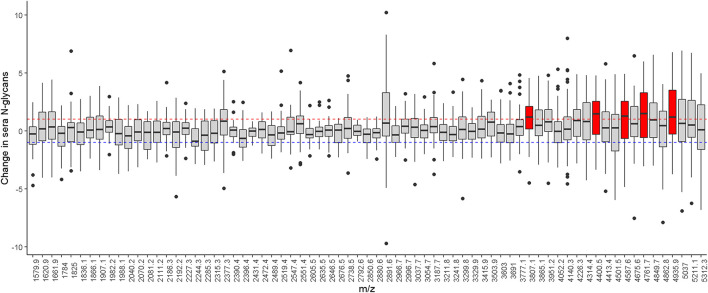
Glycosylation, the process of adding glycans (i.e., sugars) to proteins, is the most abundant post-translational modification. N-glycosylation is the most common form of glycosylation, and the N-glycan moieties play key roles in regulating protein functions and many other biological processes. Thus, identification and quantification of N-glycome (complete repertoire of all N-glycans in a sample) may provide new sources of biomarkers and shed light on health and disease. To date, little is known about the role of altered N-glycome in Alzheimer's Disease and Alzheimer's Disease-related Dementias (AD/ADRD). The current study included 45 older adults who had no cognitive impairment (NCI) at baseline, followed and examined annually, and underwent brain autopsy after death. During about 12-year follow-up, 15 developed mild cognitive impairment (MCI), 15 developed AD, and 15 remained NCI. Relative abundances of N-glycans in serum at 2 time points (baseline and proximate to death, ∼12.3 years apart) and postmortem brain tissue (dorsolateral prefrontal cortex) were quantified using MALDI-TOF-MS. Regression models were used to test the associations of N-glycans with AD/ADRD phenotypes. We detected 71 serum and 141 brain N-glycans, of which 46 were in common. Most serum N-glycans had mean fold changes less than one between baseline and proximate to death. The cross-tissue N-glycan correlations were weak. Baseline serum N-glycans were more strongly associated with AD/ADRD compared to change in serum N-glycans over time and brain N-glycans. The N-glycan associations were observed in both AD and non-AD neuropathologies. To our knowledge, this is the first comprehensive glycomic analysis in both blood and brain in relation to AD pathology. Our results suggest that altered N-glycans may serve as mechanistic biomarkers for early diagnosis and progression of AD/ADRD.
Keywords: AD/ADRD; N-glycans; cognition; glycosylation; neuropathologies.
Copyright © 2021 Yu, Huo, Yang, Palma-Gudiel, Boyle, Schneider, Bennett and Zhao.
Conflict of interest statement
The authors declare that the research was conducted in the absence of any commercial or financial relationships that could be construed as a potential conflict of interest.
Figures


Similar articles
-
Glycoblotting method allows for rapid and efficient glycome profiling of human Alzheimer's disease brain, serum and cerebrospinal fluid towards potential biomarker discovery.Biochim Biophys Acta. 2016 Aug;1860(8):1716-27. doi: 10.1016/j.bbagen.2016.03.009. Epub 2016 Mar 8. Biochim Biophys Acta. 2016. PMID: 26968461
-
Alzheimer's Disease-Related Dementias Summit 2022: National Research Priorities for the Investigation of Post-Traumatic Brain Injury Alzheimer's Disease and Related Dementias.J Neurotrauma. 2023 Aug;40(15-16):1512-1523. doi: 10.1089/neu.2022.0514. Epub 2023 Apr 25. J Neurotrauma. 2023. PMID: 36927167 Free PMC article.
-
The Cerebrospinal Fluid Free-Glycans Hex1 and HexNAc1Hex1Neu5Ac1 as Potential Biomarkers of Alzheimer's Disease.Biomolecules. 2024 Apr 24;14(5):512. doi: 10.3390/biom14050512. Biomolecules. 2024. PMID: 38785920 Free PMC article.
-
Early Stage Glycosylation Biomarkers in Alzheimer's Disease.Medicines (Basel). 2019 Sep 3;6(3):92. doi: 10.3390/medicines6030092. Medicines (Basel). 2019. PMID: 31484367 Free PMC article. Review.
-
N-glycan and Alzheimer's disease.Biochim Biophys Acta Gen Subj. 2017 Oct;1861(10):2447-2454. doi: 10.1016/j.bbagen.2017.04.012. Epub 2017 Apr 29. Biochim Biophys Acta Gen Subj. 2017. PMID: 28465241 Review.
Cited by
-
Toolbox Accelerating Glycomics (TAG): Improving Large-Scale Serum Glycomics and Refinement to Identify SALSA-Modified and Rare Glycans.Int J Mol Sci. 2022 Oct 28;23(21):13097. doi: 10.3390/ijms232113097. Int J Mol Sci. 2022. PMID: 36361885 Free PMC article.
-
The effects of immortalization on the N-glycome and proteome of CDK4-transformed lung cancer cells.Glycobiology. 2024 Apr 24;34(6):cwae030. doi: 10.1093/glycob/cwae030. Glycobiology. 2024. PMID: 38579012 Free PMC article.
-
Integration of RNAseq transcriptomics and N-glycomics reveal biosynthetic pathways and predict structure-specific N-glycan expression.Chem Sci. 2025 Apr 4;16(17):7155-7172. doi: 10.1039/d5sc00467e. eCollection 2025 Apr 30. Chem Sci. 2025. PMID: 40191131 Free PMC article.
-
New insight into protein glycosylation in the development of Alzheimer's disease.Cell Death Discov. 2023 Aug 25;9(1):314. doi: 10.1038/s41420-023-01617-5. Cell Death Discov. 2023. PMID: 37626031 Free PMC article. Review.
-
Human brain glycoform coregulation network and glycan modification alterations in Alzheimer's disease.Sci Adv. 2024 Apr 5;10(14):eadk6911. doi: 10.1126/sciadv.adk6911. Epub 2024 Apr 5. Sci Adv. 2024. PMID: 38579000 Free PMC article.
References
-
- Bennett D. A., Schneider J. A., Aggarwal N. T., Arvanitakis Z., Shah R. C., Kelly J. F., et al. (2006a). Decision rules guiding the clinical diagnosis of Alzheimer’s disease in two community-based cohort studies compared to standard practice in a clinic-based cohort study. Neuroepidemiology 27 169–176. 10.1159/000096129 - DOI - PubMed
Grants and funding
LinkOut - more resources
Full Text Sources