

Asymmetric Interplay Between K+ and Blocker and Atomistic Parameters From Physiological Experiments Quantify K+ Channel Blocker Release
- PMID: 34777005
- PMCID: PMC8586521
- DOI: 10.3389/fphys.2021.737834
Asymmetric Interplay Between K+ and Blocker and Atomistic Parameters From Physiological Experiments Quantify K+ Channel Blocker Release
Abstract
Modulating the activity of ion channels by blockers yields information on both the mode of drug action and on the biophysics of ion transport. Here we investigate the interplay between ions in the selectivity filter (SF) of K+ channels and the release kinetics of the blocker tetrapropylammonium in the model channel KcvNTS. A quantitative expression calculates blocker release rate constants directly from voltage-dependent ion occupation probabilities in the SF. The latter are obtained by a kinetic model of single-channel currents recorded in the absence of the blocker. The resulting model contains only two adjustable parameters of ion-blocker interaction and holds for both symmetric and asymmetric ionic conditions. This data-derived model is corroborated by 3D reference interaction site model (3D RISM) calculations on several model systems, which show that the K+ occupation probability is unaffected by the blocker, a direct consequence of the strength of the ion-carbonyl attraction in the SF, independent of the specific protein background. Hence, KcvNTS channel blocker release kinetics can be reduced to a small number of system-specific parameters. The pore-independent asymmetric interplay between K+ and blocker ions potentially allows for generalizing these results to similar potassium channels.
Keywords: 3D RISM; blocker kinetics; carbonyl-ion interaction; extended beta distributions; ion binding; selectivity filter; viral potassium channels.
Copyright © 2021 Gabriel, Hansen, Urban, Drexler, Winterstein, Rauh, Thiel, Kast and Schroeder.
Conflict of interest statement
The authors declare that the research was conducted in the absence of any commercial or financial relationships that could be construed as a potential conflict of interest.
Figures
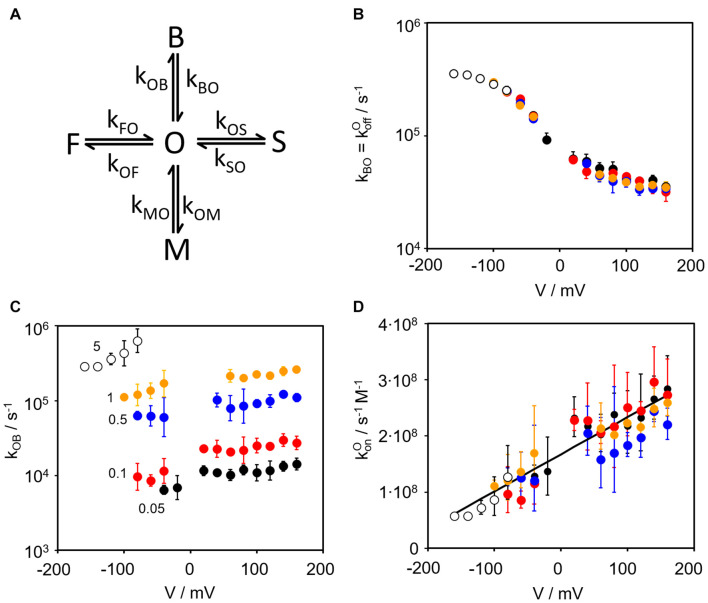
 , 0.5 mM
  , 1 mM
  , and 5 mM ο. (C) Voltage dependence of measured at the same concentrations as kBO, (D) Voltage dependence of as determined by dividing kOB by the concentration of TPrA in mol. Data points are the geometric mean of 3 to 4 individual channels, error bars represent the geometric standard deviation. Some data points around 0 mV are missing because of insufficient signal-to-noise ratio.
Similar articles
-
Binding kinetics of quaternary ammonium ions in Kcv potassium channels.Channels (Austin). 2024 Dec;18(1):2402749. doi: 10.1080/19336950.2024.2402749. Epub 2024 Oct 9. Channels (Austin). 2024. PMID: 39383513 Free PMC article.
-
Intrinsic versus extrinsic voltage sensitivity of blocker interaction with an ion channel pore.J Gen Physiol. 2010 Feb;135(2):149-67. doi: 10.1085/jgp.200910324. J Gen Physiol. 2010. PMID: 20100894 Free PMC article.
-
Kinetic modeling of ion conduction in KcsA potassium channel.J Chem Phys. 2005 May 22;122(20):204712. doi: 10.1063/1.1913502. J Chem Phys. 2005. PMID: 15945769
-
Modification of K+ channel-drug interactions by ancillary subunits.J Physiol. 2008 Feb 15;586(4):929-50. doi: 10.1113/jphysiol.2007.139279. Epub 2007 Dec 20. J Physiol. 2008. PMID: 18096604 Free PMC article. Review.
-
Emerging issues of connexin channels: biophysics fills the gap.Q Rev Biophys. 2001 Aug;34(3):325-472. doi: 10.1017/s0033583501003705. Q Rev Biophys. 2001. PMID: 11838236 Review.
Cited by
-
Binding kinetics of quaternary ammonium ions in Kcv potassium channels.Channels (Austin). 2024 Dec;18(1):2402749. doi: 10.1080/19336950.2024.2402749. Epub 2024 Oct 9. Channels (Austin). 2024. PMID: 39383513 Free PMC article.
-
Modular architecture of K+ channels: the functional plasticity of the pore module.EMBO Rep. 2025 Aug;26(15):3730-3746. doi: 10.1038/s44319-025-00519-0. Epub 2025 Jul 15. EMBO Rep. 2025. PMID: 40664719 Free PMC article. Review.
-
Structural determinants of ivabradine block of the open pore of HCN4.Proc Natl Acad Sci U S A. 2024 Jul 2;121(27):e2402259121. doi: 10.1073/pnas.2402259121. Epub 2024 Jun 25. Proc Natl Acad Sci U S A. 2024. PMID: 38917012 Free PMC article.
References
LinkOut - more resources
Full Text Sources