. 2021 Oct 27:12:745058.
doi: 10.3389/fphys.2021.745058. eCollection 2021.

Empagliflozin Induces White Adipocyte Browning and Modulates Mitochondrial Dynamics in KK Cg-Ay/J Mice and Mouse Adipocytes

Affiliations

Empagliflozin Induces White Adipocyte Browning and Modulates Mitochondrial Dynamics in KK Cg-Ay/J Mice and Mouse Adipocytes

Linxin Xu et al. Front Physiol. .

Abstract

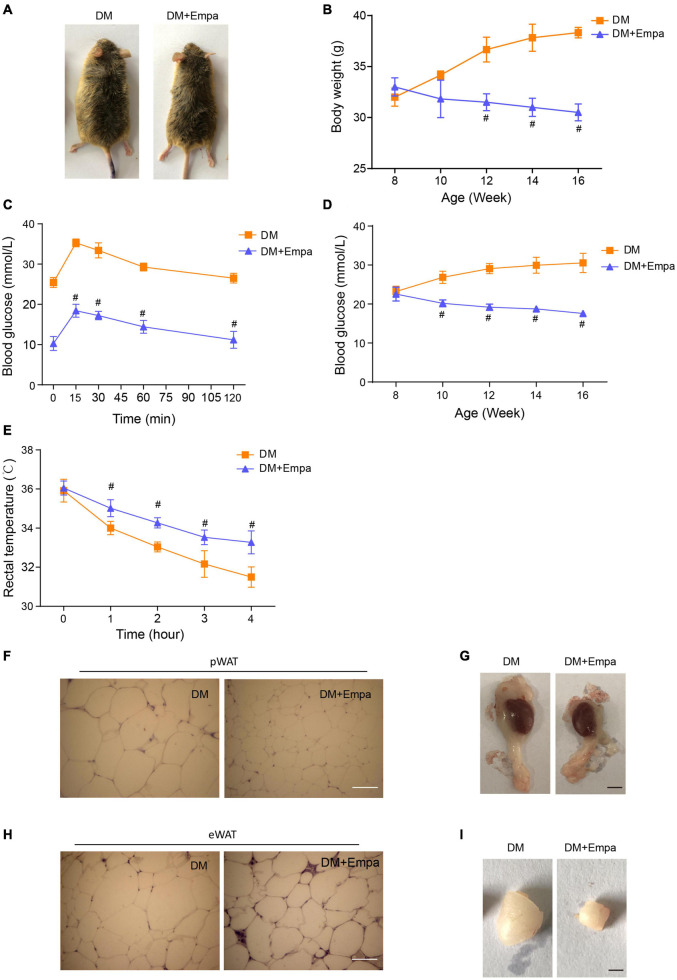
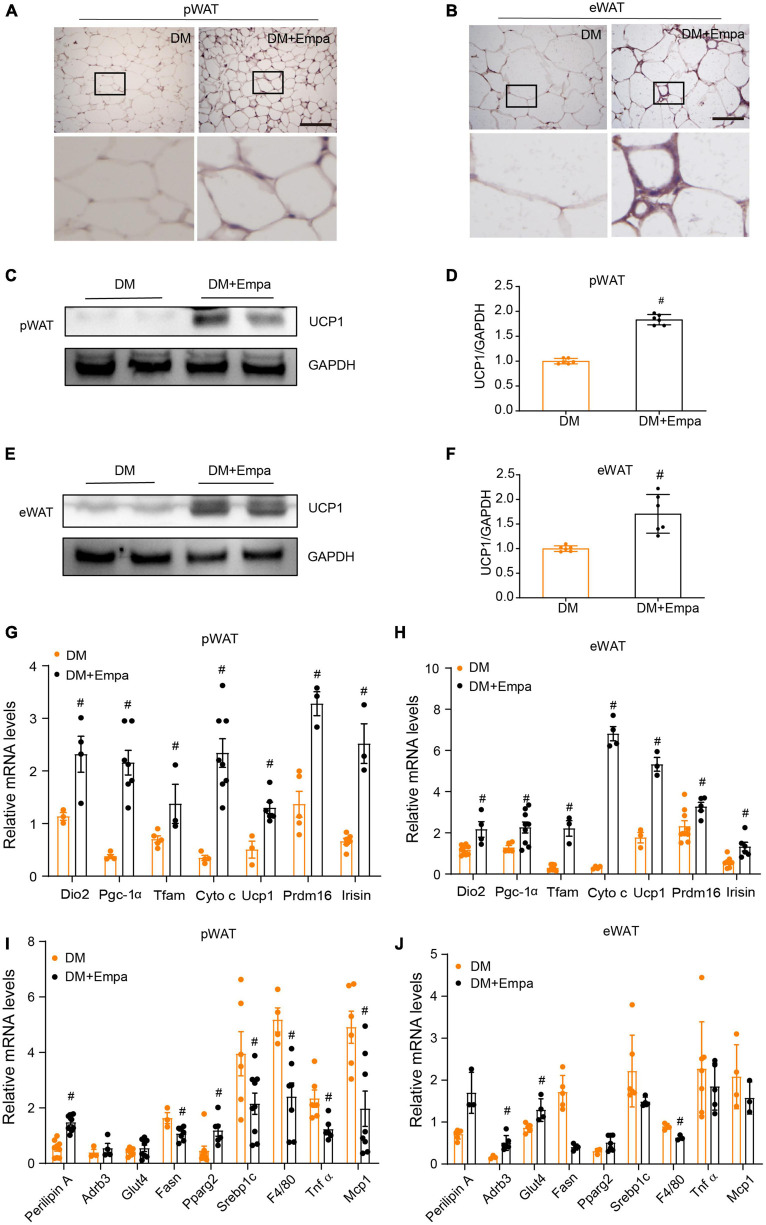
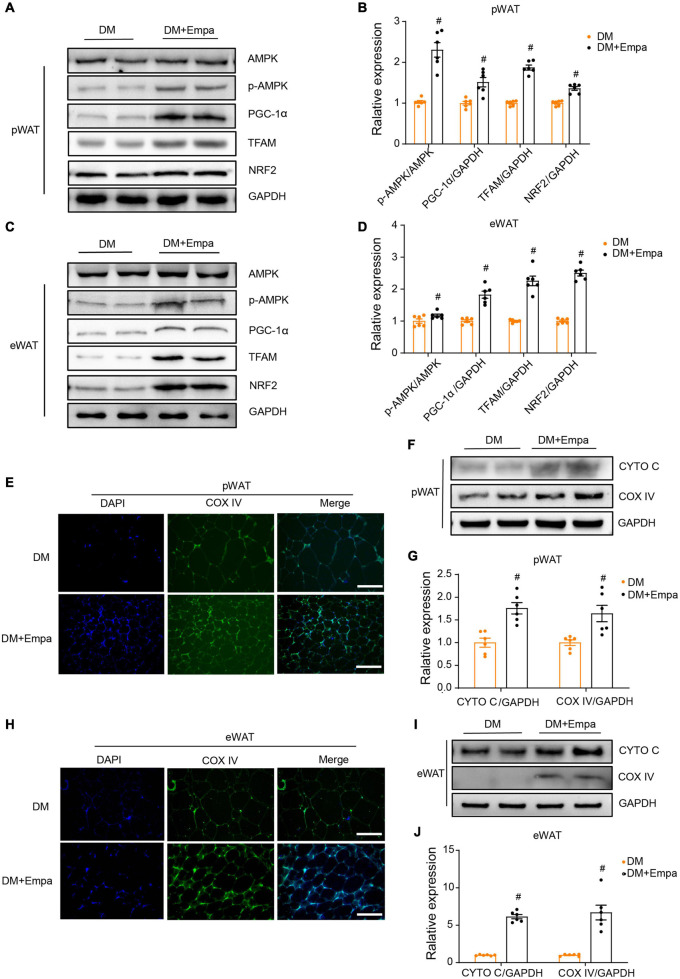
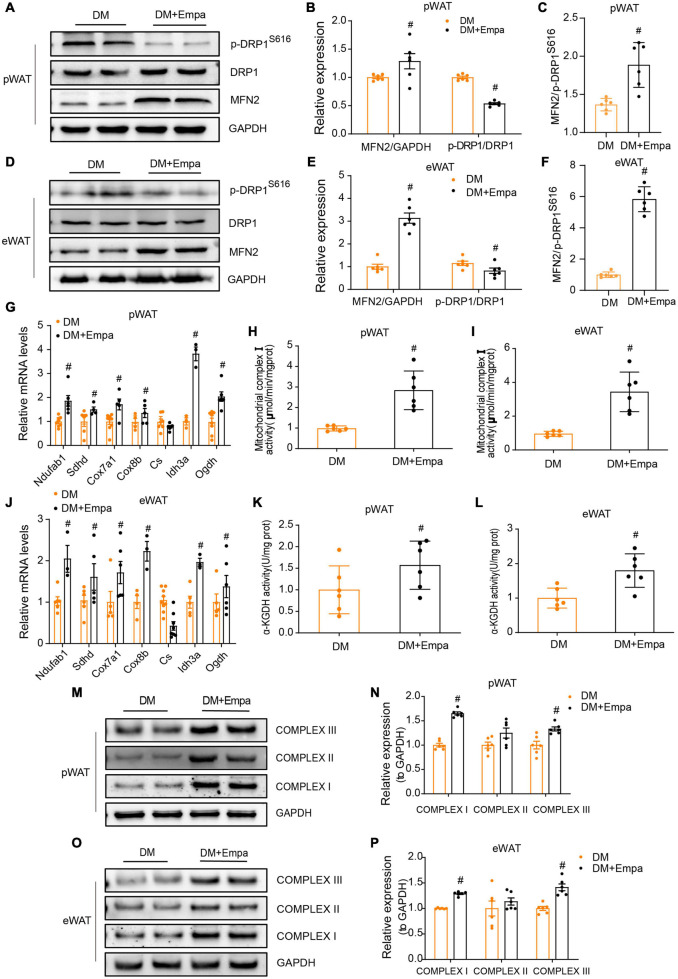
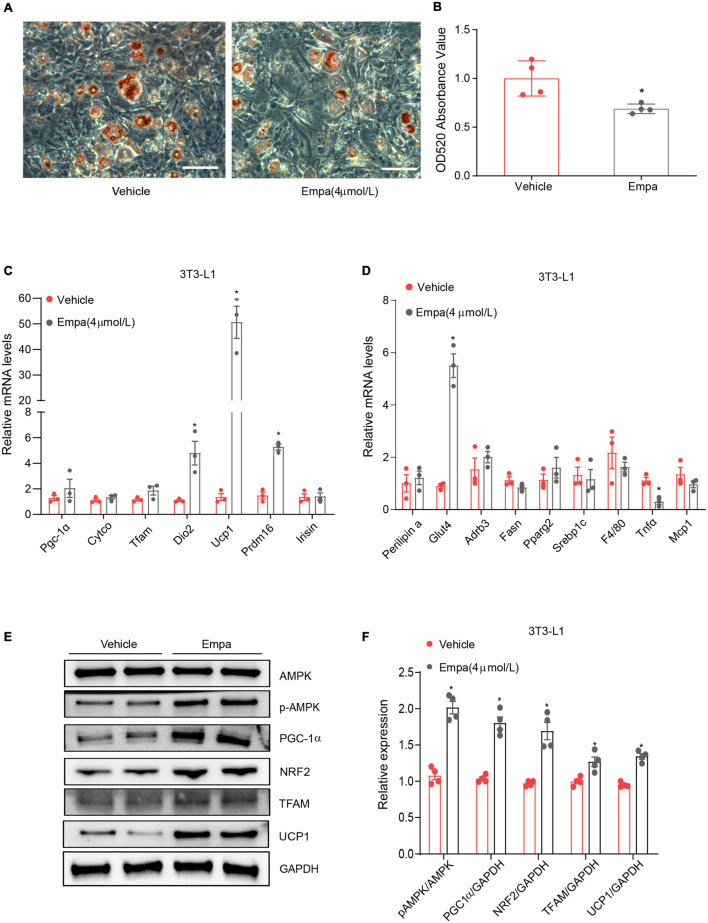
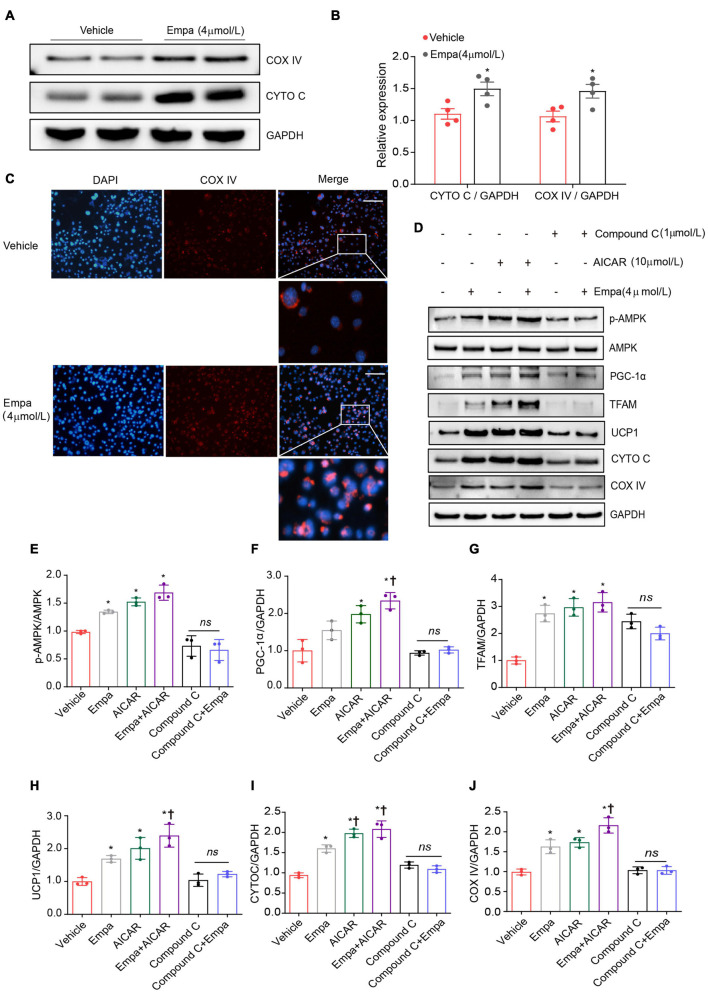
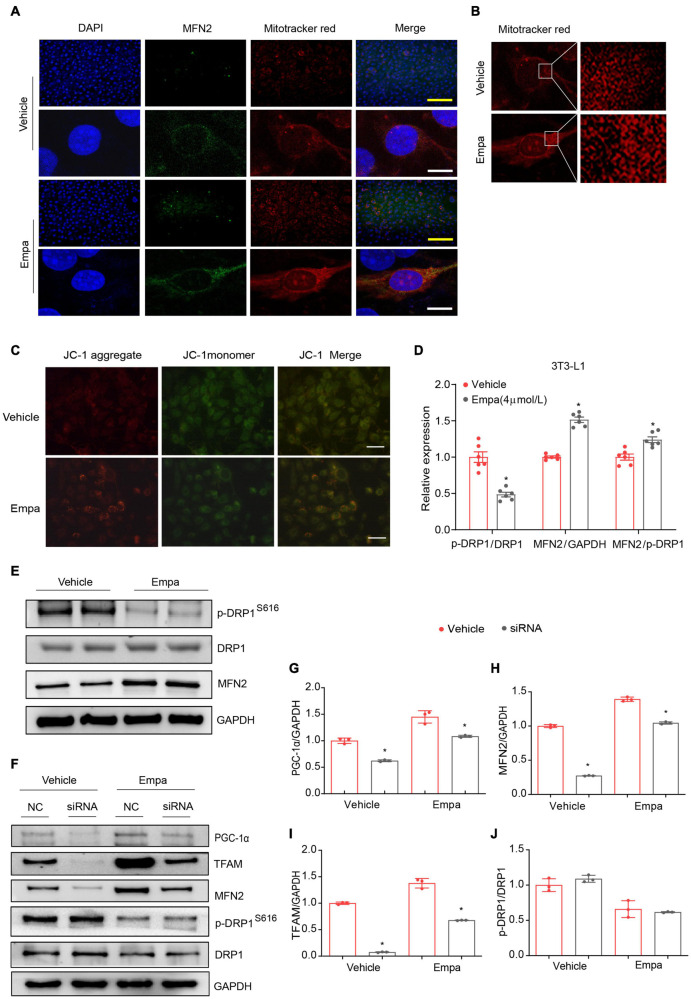
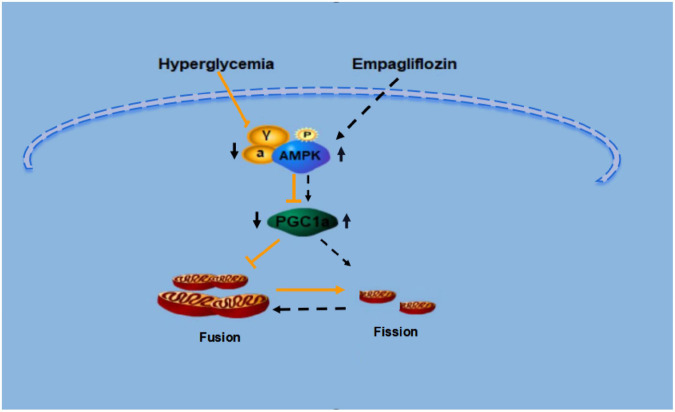
Background: White adipose tissue (WAT) browning is a promising target for obesity prevention and treatment. Empagliflozin has emerged as an agent with weight-loss potential in clinical and in vivo studies, but the mechanisms underlying its effect are not fully understood. Here, we investigated whether empagliflozin could induce WAT browning and mitochondrial alterations in KK Cg-Ay/J (KKAy) mice, and explored the mechanisms of its effects. Methods: Eight-week-old male KKAy mice were administered empagliflozin or saline for 8 weeks and compared with control C57BL/6J mice. Mature 3T3-L1 adipocytes were treated in the presence or absence of empagliflozin. Mitochondrial biosynthesis, dynamics, and function were evaluated by gene expression analyses, fluorescence microscopy, and enzymatic assays. The roles of adenosine monophosphate-activated protein kinase (AMPK) and peroxisome proliferator-activated receptor-γ coactivator-1-alpha (PGC-1α) were determined through AICAR (5-Aminoimidazole-4-carboxamide1-β-D-ribofuranoside)/Compound C and RNA interference, respectively. Results: Empagliflozin substantially reduced the bodyweight of KKAy mice. Mice treated with empagliflozin exhibited elevated cold-induced thermogenesis and higher expression levels of uncoupling protein 1 (UCP1) and other brown adipose tissue signature proteins in epididymal and perirenal WAT, which was an indication of browning in these WAT depots. At the same time, empagliflozin enhanced fusion protein mitofusin 2 (MFN2) expression, while decreasing the levels of the fission marker phosphorylated dynamin-related protein 1 (Ser616) [p-DRP1 (Ser616)] in epididymal and perirenal WAT. Empagliflozin also increased mitochondrial biogenesis and fusion, improved mitochondrial integrity and function, and promoted browning of 3T3-L1 adipocytes. Further, we found that AMPK signaling activity played an indispensable role in empagliflozin-induced browning and mitochondrial biogenesis, and that PGC-1α was required for empagliflozin-induced fusion. Whether empagliflozin activates AMPK by inhibition of SGLT2 or by independent mechanisms remains to be tested. Conclusion: Our results suggest that empagliflozin is a promising anti-obesity treatment, which can immediately induce WAT browning mitochondrial biogenesis, and regulate mitochondrial dynamics.

Keywords: browning; fusion; mitochondria; mitochondrial dynamics; sodium-glucose co-transporter-2 inhibitor; type 2 diabetes mellitus.


Conflict of interest statement

The authors declare that the research was conducted in the absence of any commercial or financial relationships that could be construed as a potential conflict of interest.

Figures

FIGURE 1
FIGURE 1
Empagliflozin treatment reduces bodyweight and promotes thermogenesis in KKAy mice. Eight-week-old male KKAy mice (n = 6 per group) were administered saline (DM) or empagliflozin (DM + Empa) for 8 weeks. (A) Representative images of mice in 2 groups after 8 weeks of treatment; and (B) bodyweights of the mice during 8 weeks of treatment. (C) Changes in blood glucose as detected by IPGTT after 8 weeks of treatment, and (D) postprandial blood glucose levels during 8 weeks of treatment. (E) Body temperature during a 4-hour cold test at 4°C. (F,H) Representative images of hematoxylin staining, and (G,I) representative images of pWAT and eWAT in mice after 8 weeks of treatment. Scale bar represents 100 μm in (F,H) and 10 mm in (G,I). Data are presented as the mean ± SEM. #P < 0.05 vs. the DM group. pWAT, perirenal white adipose tissue; eWAT, epididymal white adipose tissue. IPGTT, Intraperitoneal glucose tolerance test.
FIGURE 2
FIGURE 2
Empagliflozin increases the expression of UCP1 and brown fat-related proteins in the pWAT and eWAT of KKAy mice. Eight-week-old male KKAy mice (n = 6 per group) were treated with saline (DM) or empagliflozin (DM + Empa) for 8 weeks. (A,B) Immunohistochemical staining of UCP1 in pWAT and eWAT sections. Scale bar represents 100 μm. (C–F) Western blot and quantitation of UCP1 expression in pWAT and eWAT, with GAPDH serving as a loading control. (G–J) qRT-PCR of mRNAs of Ucp1 and genes related to mitochondrial biogenesis (Dio2, Pgc-1α, Tfam, and Cyto c), thermogenesis (Prdm16 and Irisin), lipolysis (Plin1, Adrb3, and Pparg), glucose metabolism (Glut4), lipogenesis (Fasn and Srebf1), and inflammation (MCP1, Tnfα, and F4/80) in pWAT and eWAT, with GAPDH serving as a loading control. Data are presented as the mean ± SEM. #P < 0.05 vs. the DM group. pWAT, perirenal white adipose tissue; eWAT, epididymal white adipose tissue.
FIGURE 3
FIGURE 3
Empagliflozin promotes mitochondrial biogenesis and activates the AMPK signaling pathway in the pWAT and eWAT of KKAy mice. Eight-week-old male KKAy mice (n = 6 per group) were treated with saline (DM) or empagliflozin (DM + Empa) for 8 weeks. (A–D) Western blot and quantitation of AMPK, p-AMPK, PGC-1α, TFAM, and NRF2 in pWAT and eWAT, with GAPDH serving as a loading control. (E,H) Immunofluorescence staining of COX IV (green), with nuclei stained blue with 4′,6-diamidino-2-phenylindole (DAPI). Image magnification is 100 ×. (F,G,I,J) Western blot and quantitation of CYTO C and COX IV in pWAT and eWAT, with GAPDH used as a loading control. Data are presented as the mean ± SEM. #P < 0.05 vs. the DM group. pWAT, perirenal white adipose tissue; eWAT, epididymal white adipose tissue.
FIGURE 4
FIGURE 4
Empagliflozin regulates proteins mediating mitochondrial fusion and fission, and enhances mitochondrial function in the pWAT and eWAT of KKAy mice. Eight-week-old male KKAy mice (n = 6 per group) were administered saline (DM) or empagliflozin (DM + Empa) for 8 weeks. (A–F) Western blot and quantitation of DRP1, p-DRP1 (S616), and MFN2 in pWAT and eWAT, with GAPDH used as a loading control. (G,J) qRT-PCR analysis of mRNAs of complex I (Ndufab1), II (Sdhd), III (Cox7a1), IV (Cox8b), and genes involved in the TCA cycle (Cs, Idh3a, and Ogdh) in pWAT and eWAT, with GAPDH serving as a loading control. (H,I) Measurement of complex I and (K,L) α-KGDH enzymatic activity in pWAT and eWAT, with GAPDH serving as a loading control. (M–P) Western blot and quantitation of mitochondrial respiratory chain complex I (NDUFA9), II (SDHA), and III (CYTB) in pWAT and eWAT, with GAPDH used as a loading control. Data are presented as the mean ± SEM. #P < 0.05 vs. the DM group. pWAT, perirenal white adipose tissue; eWAT, epididymal white adipose tissue.
FIGURE 5
FIGURE 5
Empagliflozin induces a brown-like phenotype and elevates mitochondrial biogenesis in 3T3-L1 adipocytes. Differentiation of 3T3-L1 preadipocytes was induced through incubation in adipocyte-inducing medium for 5 days and then treatment (Empa) with or without (Vehicle) empagliflozin (4 μmol/L) in normal culture medium. (A,B) Oil Red O staining and quantification. Scale bar represents 100 μm. (C,D) qRT-PCR analysis of mRNAs of UCP1 and genes involved in mitochondrial biogenesis (Pgc-1α, Cyto c, Tfam, and Dio2), thermogenesis (Prdm16 and Irisin), lipolysis (Fasn and Srebf1), lipogenesis (Plin1, Adrb3, and Pparg), and inflammation (MCP1, Tnfα, and F4/80), with GAPDH serving as a loading control. (E,F) Western blot and quantitation of AMPK, p-AMPK, PGC-1α, NRF2, TFAM, and UCP-1, with GAPDH used as a loading control. Data are presented as mean ± SEM. *P < 0.05 vs. Vehicle.
FIGURE 6
FIGURE 6
Upregulation of UCP1 and mitochondrial biogenesis by empagliflozin are dependent on AMPK activity. (A,B) Western blot and quantitation of COX IV and CYTO C with GAPDH as a loading control. (C) Immunostaining was used for analysis of the abundance of COX IV in empagliflozin-treated 3T3-L1 cells. COX IV was labeled red, and the nuclei of cells were stained blue. Representative images are shown. Image magnification is 200 ×. (D–J) Mature 3T3-L1 adipocytes were treated with (Empa) or without (Vehicle) empagliflozin (4 μmol/L), with or without AICAR (10 μmol/L), and with or without Compound C (1 μmol/L). Western blot and quantitation of p-AMPK, AMPK, PGC-1α, TFAM, UCP1, CYTO C, and COX IV, with GAPDH used as a loading control. Data are presented as mean ± SEM. *P < 0.05 vs. Vehicle; P < 0.05 vs. Empa.
FIGURE 7
FIGURE 7
Empagliflozin induces mitochondrial fusion via PGC-1α and increases mitochondrial membrane potential in 3T3-L1 adipocytes. Mature 3T3-L1 adipocytes were treated with (Empa) or without (Vehicle) empagliflozin (4 μmol/L). (A) Immunofluorescence staining of mitochondria with MitoTracker Red (red) and of MFN2 (green) with nuclei stained blue with 4′,6-diamidino-2-phenylindole (DAPI); and (B) mitochondria stained with MitoTracker Red under confocal microscopy. Immunofluorescence scale bar represents 10 μm, Immunoconfocal scale bar represents 200 μm. (C) Analysis of mitochondrial membrane potential with JC-1. Representative images of JC-1 aggregates (red), monomers (green), and both aggregates and monomers. Scale bar represents 100 μm. (D,E) Western blot and quantitation of p-DRP1 (S616), DRP1, and MFN2, with GAPDH used as a loading control. (F–J) Mature 3T3-L1 adipocytes were transfected with negative control small interfering RNA (siRNA; NC) or Pgc-1α siRNA (siRNA) for 24 h and then treated with (Empa) or without (Vehicle) empagliflozin (4 μmol/L) for 72 h. Western blot and quantitation of PGC-1α, TFAM, MFN2, and DRP1, with GAPDH used as a loading control. Data are presented as the mean ± SEM of 3 independent experiments. *P < 0.05 vs. NC.
FIGURE 8
FIGURE 8
Proposed model for the signaling pathway by which empagliflozin induces white adipocyte browning and modulates mitochondrial dynamics via an AMPK dependent pathway.

References

    1. Arany Z., He H., Lin J., Hoyer K., Handschin C., Toka O., et al. (2005). Transcriptional coactivator PGC-1 alpha controls the energy state and contractile function of cardiac muscle. Cell Metab. 1 259–271. 10.1016/j.cmet.2005.03.002 - DOI - PubMed
    1. Bach D., Pich S., Soriano F. X., Vega N., Baumgartner B., Oriola J., et al. (2003). Mitofusin-2 determines mitochondrial network architecture and mitochondrial metabolism. A novel regulatory mechanism altered in obesity. J. Biol. Chem. 278 17190–17197. 10.1074/jbc.M212754200 - DOI - PubMed
    1. Bartelt A., Heeren J. (2014). Adipose tissue browning and metabolic health. Nat. Rev. Endocrinol. 10 24–36. 10.1038/nrendo.2013.204 - DOI - PubMed
    1. Boutant M., Kulkarni S. S., Joffraud M., Ratajczak J., Valera-Alberni M., Combe R., et al. (2017). Mfn2 is critical for brown adipose tissue thermogenic function. EMBO J. 36 1543–1558. 10.15252/embj.201694914 - DOI - PMC - PubMed
    1. Chang C. R., Blackstone C. (2010). Dynamic regulation of mitochondrial fission through modification of the dynamin-related protein Drp1. Ann. N. Y. Acad. Sci. 1201 34–39. 10.1111/j.1749-6632.2010.05629.x - DOI - PMC - PubMed

LinkOut - more resources