. 2021 Oct 27:12:744709.
doi: 10.3389/fpsyt.2021.744709. eCollection 2021.

Prevalence of Autism Spectrum Disorder and Co-morbidities in Children and Adolescents: A Systematic Literature Review

Affiliations

Prevalence of Autism Spectrum Disorder and Co-morbidities in Children and Adolescents: A Systematic Literature Review

Clémence Bougeard et al. Front Psychiatry. .

Abstract

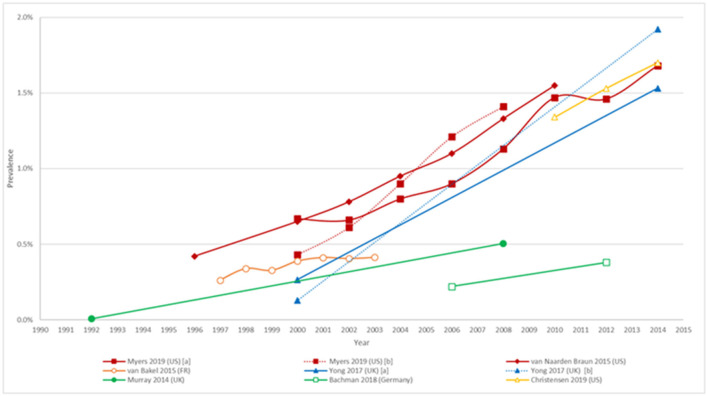
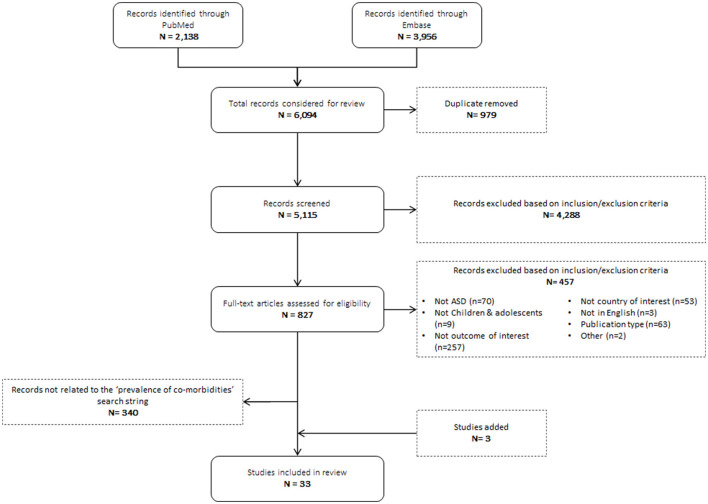
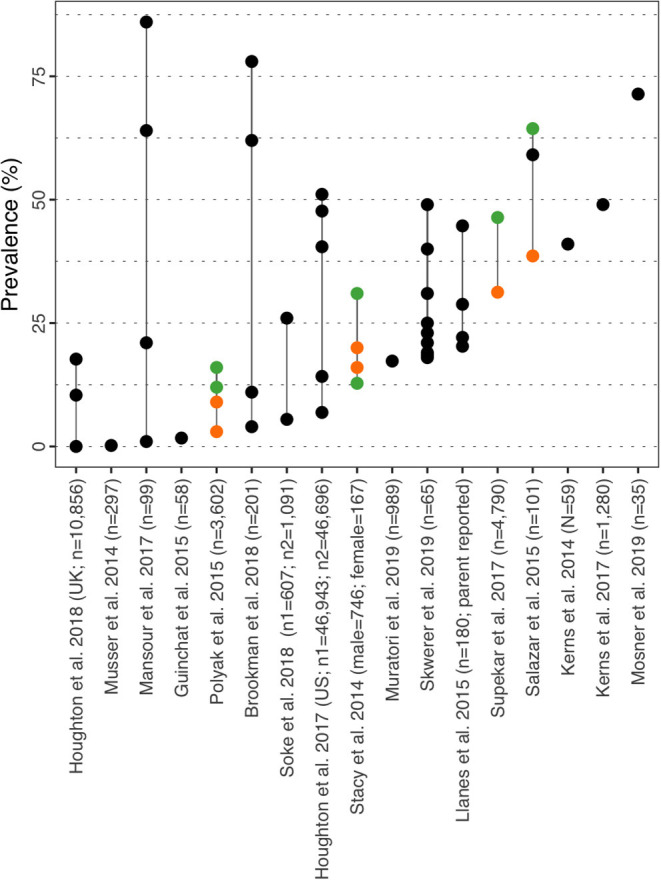
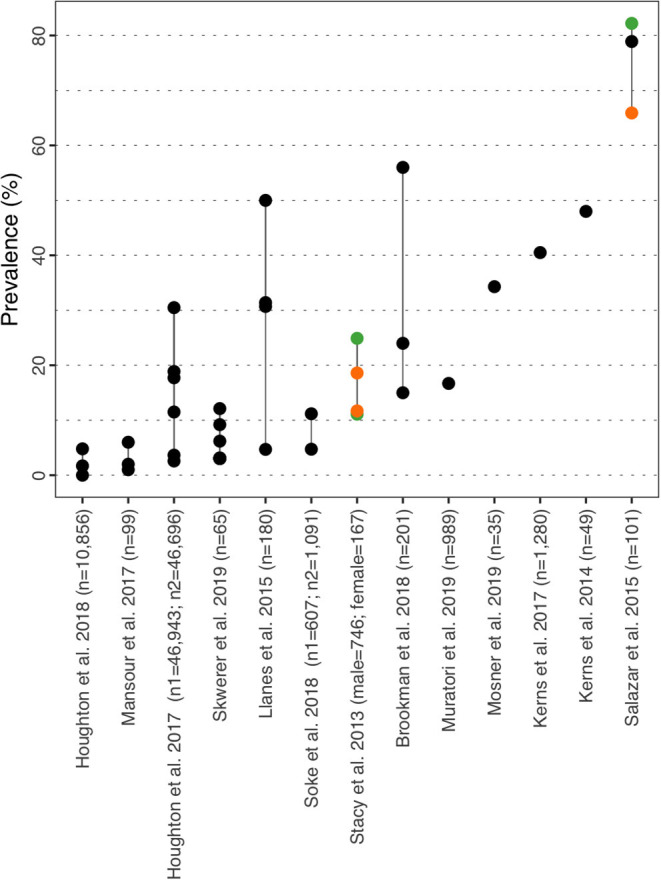
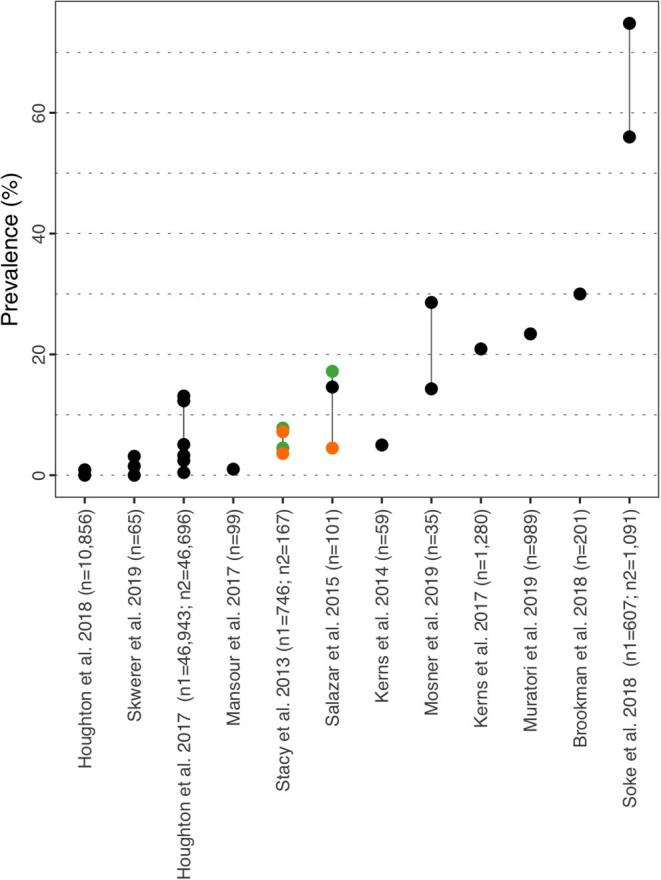
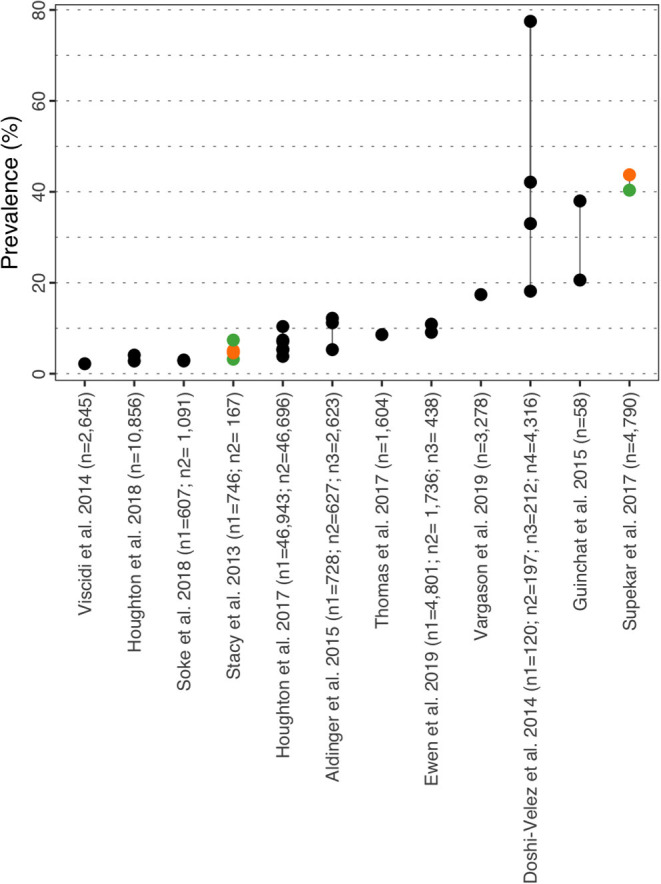
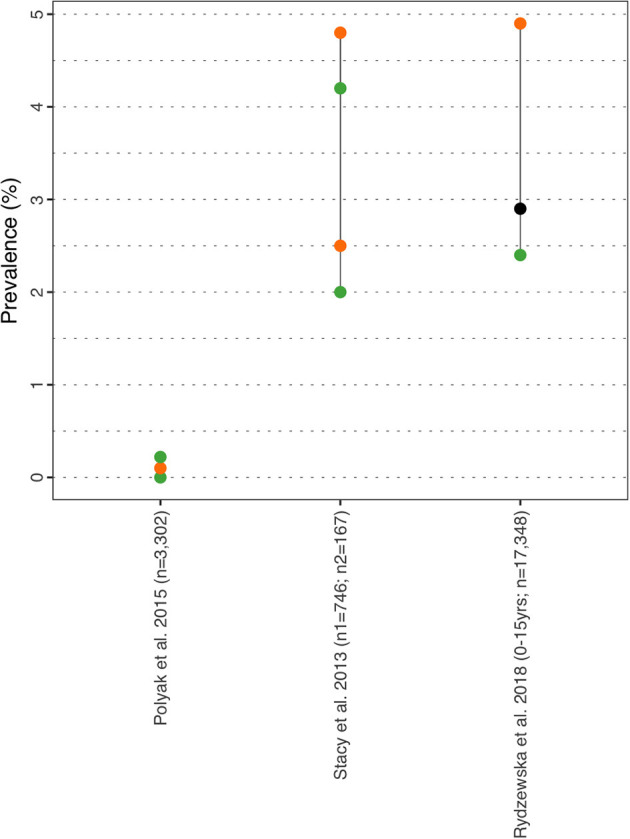
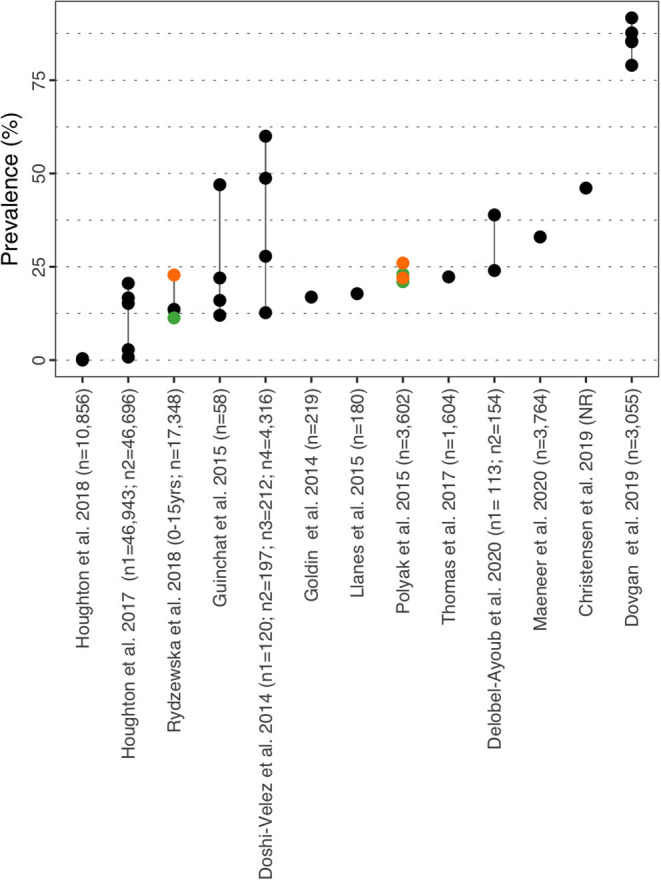
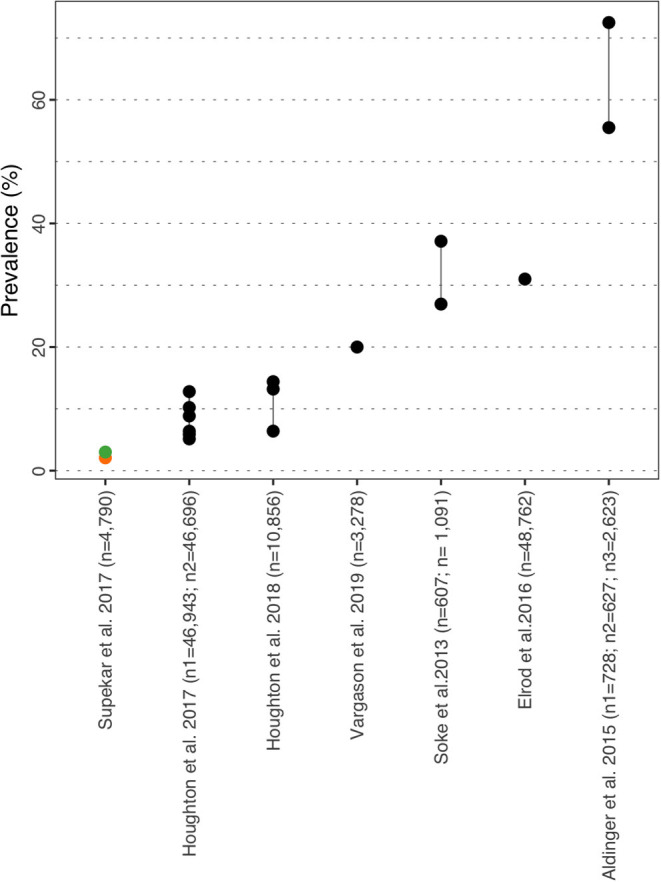
Objective: Individuals with autism spectrum disorder often present somatic and/or psychiatric co-morbid disorders. The DSM-5 allows for consideration of additional diagnoses besides ASD and may have impacted the prevalence of co-morbidities as well as being limited in capturing the true differences in prevalence observed between males and females. We describe the prevalence of ASD and frequently observed co-morbidities in children and adolescents (<18 years) in the United States and five European countries. Methods: Two systematic literature reviews were conducted in PubMed and Embase for the period 2014-2019 and focusing on the prevalence of ASD and nine co-morbidities of interest based on their frequency and/or severity: Attention Deficit Hyperactivity Disorder (ADHD), anxiety, depressive disorders, epilepsy, intellectual disability (ID), sleep disorders, sight/hearing impairment/loss, and gastro-intestinal syndromes (GI). Results: Thirteen studies on prevalence of ASD and 33 on prevalence of co-morbidities were included. Prevalence of ASD was 1.70 and 1.85% in US children aged 4 and 8 years respectively, while prevalence in Europe ranged between 0.38 and 1.55%. Additionally, current evidence is supportive of a global increase in ASD prevalence over the past years. Substantial heterogeneity in prevalence of co-morbidities was observed: ADHD (0.00-86.00%), anxiety (0.00-82.20%), depressive disorders (0.00-74.80%), epilepsy (2.80-77.50%), ID (0.00-91.70%), sleep disorders (2.08-72.50%), sight/hearing impairment/loss (0.00-14.90%/0.00-4.90%), and GI syndromes (0.00-67.80%). Studies were heterogeneous in terms of design and method to estimate prevalence. Gender appears to represent a risk factor for co-morbid ADHD (higher in males) and epilepsy/seizure (higher in females) while age is also associated with ADHD and anxiety (increasing until adolescence). Conclusion: Our results provide a descriptive review of the prevalence of ASD and its co-morbidities in children and adolescents. These insights can be valuable for clinicians and parents/guardians of autistic children. Prevalence of ASD has increased over time while co-morbidities bring additional heterogeneity to the clinical presentation, which further advocates for personalized approaches to treatment and support. Having a clear understanding of the prevalence of ASD and its co-morbidities is important to raise awareness among stakeholders.

Keywords: Autism Spectrum Disorder; autism; co-morbidities; pediatric; prevalence; review.


Conflict of interest statement

CB and RC are employees of Syneos Health. Syneos Health was contracted by Institut de Recherche Servier to conduct this study. JB received honoraria from Institut de Recherche Servier for clinical expertise. FP-B and RS are employees of Servier.

Figures

Figure 1
Figure 1
Trends in prevalence of ASD. Myers et al. (21) [a] and [b] include the results from the CDC data set and clinically diagnosed data set, respectively; Yong et al. (22) [a] and [b] include results for the age group 5 to 12 and 13 to 17, respectively. Age of the population considered: 4 year-olds: Christensen et al. (15); 7 year-olds: van Bakel (23); 8 year-olds: Myers et al. (21); van Naarden Braun (24); 5-17 year-olds: Yong et al. (22); 0-24 year-olds: Murray (25), Bachman et al. (20).
Figure 2
Figure 2
PRISMA diagram prevalence of co-morbidities in ASD.
Figure 3
Figure 3
ADHD prevalence estimates. Each point reports a prevalence estimate for the related comorbidity. Studies with more than one data point indicate the estimate of the prevalence among different subgroup of the population. See Supplementary Table 4 for the description of the population used in each study. Sample sizes are shown in brackets above each study label. Orange mark: Female population only; Green mark: Male population only; Black mark: No sex distinction.
Figure 4
Figure 4
Anxiety prevalence estimates. Each point reports a prevalence estimate for the related comorbidity. Studies with more than one data point indicate the estimate of the prevalence among different subgroup of the population. See Supplementary Table 4 for the description of the population used in each study. Sample sizes are shown in brackets above each study label. Orange mark: Female population only; Green mark: Male population only; Black mark: No sex distinction.
Figure 5
Figure 5
Depressive disorders prevalence estimates. Each point reports a prevalence estimate for the related comorbidity. Studies with more than one data point indicate the estimate of the prevalence among different subgroup of the population. See Supplementary Table 4 for the description of the population used in each study. Sample sizes are shown in brackets above each study label. Orange mark: Female population only; Green mark: Male population only; Black mark: No sex distinction.
Figure 6
Figure 6
Epilepsy prevalence estimates. Each point reports a prevalence estimate for the related comorbidity. Studies with more than one data point indicate the estimate of the prevalence among different subgroup of the population. See Supplementary Table 4 for the description of the population used in each study. Sample sizes are shown in brackets above each study label. Orange mark: Female population only; Green mark: Male population only; Black mark: No sex distinction.
Figure 7
Figure 7
GI prevalence estimates. Each point reports a prevalence estimate for the related comorbidity. Studies with more than one data point indicate the estimate of the prevalence among different subgroup of the population. See Supplementary Table 4 for the description of the population used in each study. Sample sizes are shown in brackets above each study label. Orange mark: Female population only; Green mark: Male population only; Black mark: No sex distinction.
Figure 8
Figure 8
Hearing prevalence estimates. Each point reports a prevalence estimate for the related comorbidity. Studies with more than one data point indicate the estimate of the prevalence among different subgroup of the population. See Supplementary Table 4 for the description of the population used in each study. Sample sizes are shown in brackets above each study label. Orange mark: Female population only; Green mark: Male population only; Black mark: No sex distinction.
Figure 9
Figure 9
Intellectual disability prevalence estimates. Each point reports a prevalence estimate for the related comorbidity. Studies with more than one data point indicate the estimate of the prevalence among different subgroup of the population. See Supplementary Table 4 for the description of the population used in each study. Sample sizes are shown in brackets above each study label. Orange mark: Female population only; Green mark: Male population only; Black mark: No sex distinction.
Figure 10
Figure 10
Sleep disorder prevalence estimate. Each point reports a prevalence estimate for the related comorbidity. Studies with more than one data point indicate the estimate of the prevalence among different subgroup of the population. See Supplementary Table 4 for the description of the population used in each study. Sample sizes are shown in brackets above each study label. Orange mark: Female population only; Green mark: Male population only; Black mark: No sex distinction.
Figure 11
Figure 11
Vision impairment prevalence estimate. Each point reports a prevalence estimate for the related comorbidity. Studies with more than one data point indicate the estimate of the prevalence among different subgroup of the population. See Supplementary Table 4 for the description of the population used in each study. Sample sizes are shown in brackets above each study label. Orange mark: Female population only; Green mark: Male population only; Black mark: No sex distinction.

References

    1. ASDEU . Autism Spectrum Disorders in the European Union. (2018).
    1. American Psychiatric Association . Diagnostic and Statistical Manual of Mental Disorders (DSM−5) (2021). Available online at: https://www.psychiatry.org/psychiatrists/practice/dsm.
    1. HAS . Autism Spectrum Disorder: Warning Signs, Detection, Diagnosis and Assessment in Children and Adolescents (2018). Available online at: https://www.has-sante.fr/jcms/c_468812/en/autism-spectrum-disorder-warni....
    1. Hyman SL, Levy SE, Myers SM, Council On Children With Disabilities SOD Behavioral P . Identification, evaluation, and management of children with autism spectrum disorder. Pediatrics. (2020) 145:e20193447. 10.1542/peds.2019-3447 - DOI - PubMed
    1. Chiarotti F, Venerosi A. Epidemiology of autism spectrum disorders: a review of worldwide prevalence estimates since 2014. Brain Sci. (2020) 10:274. 10.3390/brainsci10050274 - DOI - PMC - PubMed

Publication types