. 2021 Oct 29:12:774323.
doi: 10.3389/fimmu.2021.774323. eCollection 2021.

ACSL1 Inhibits ALV-J Replication by IFN-Ⅰ Signaling and PI3K/Akt Pathway

Affiliations

ACSL1 Inhibits ALV-J Replication by IFN-Ⅰ Signaling and PI3K/Akt Pathway

Qihong Zhang et al. Front Immunol. .

Abstract

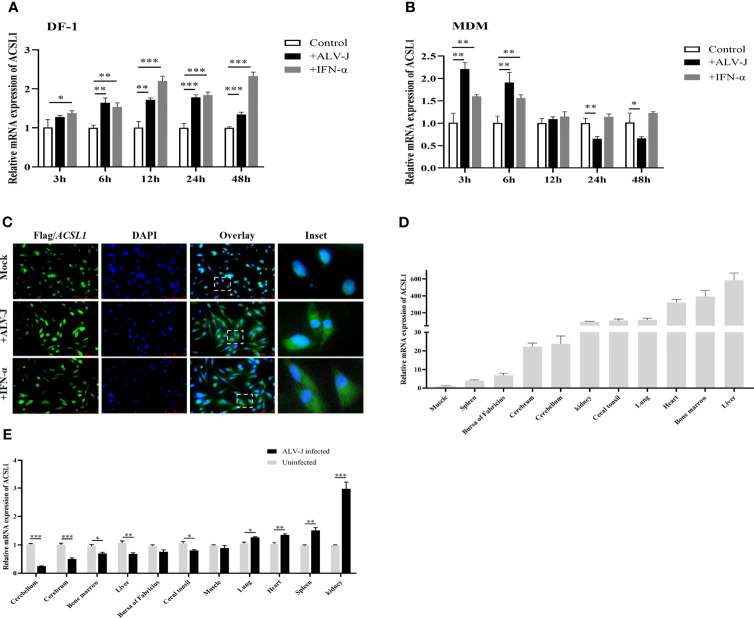
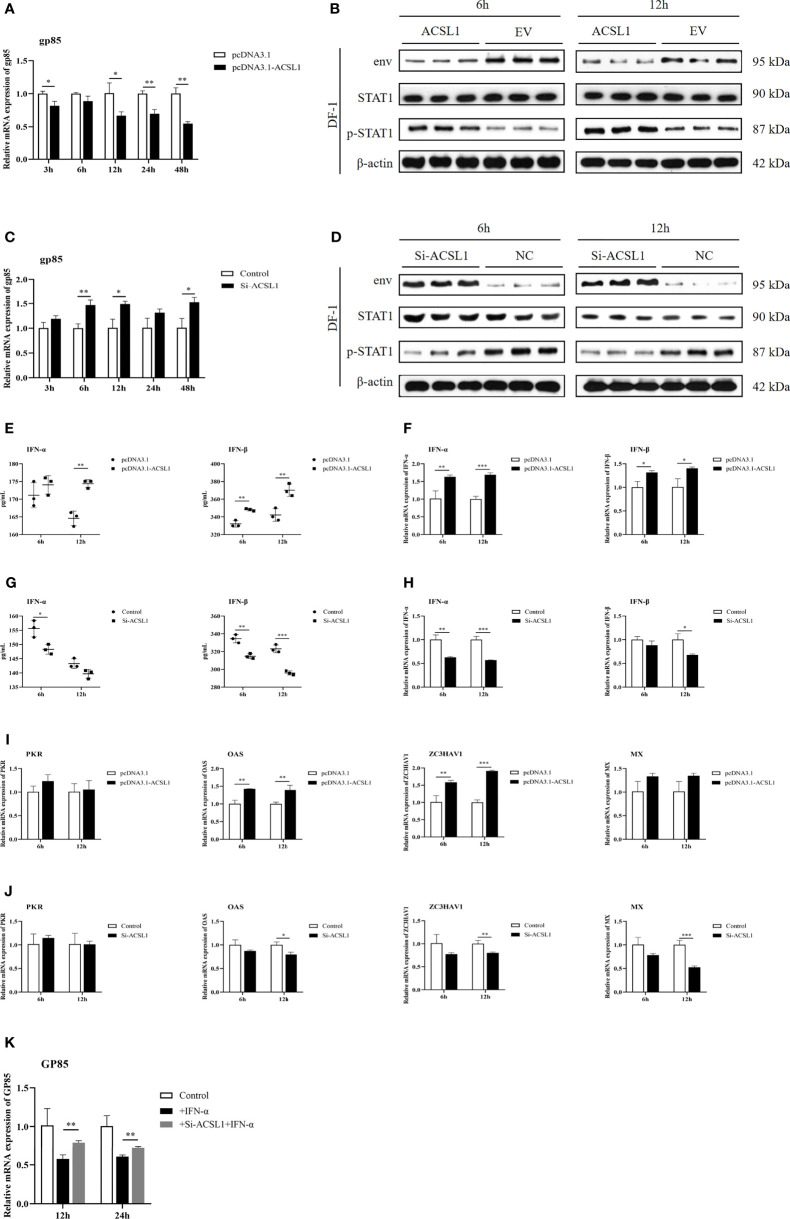
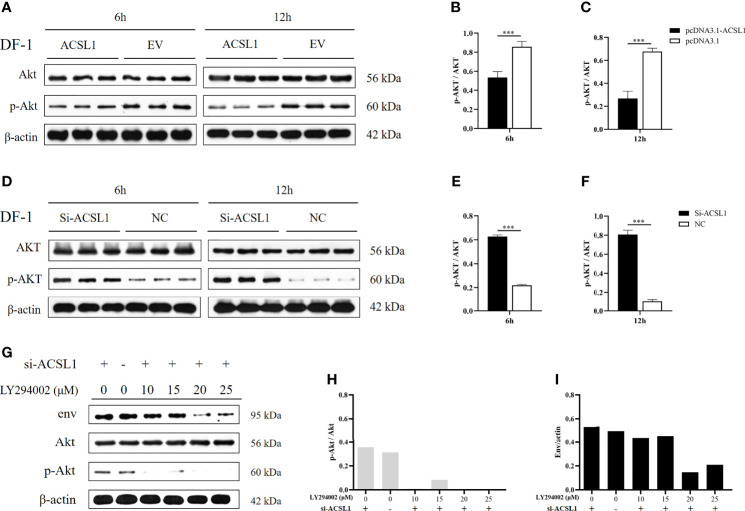
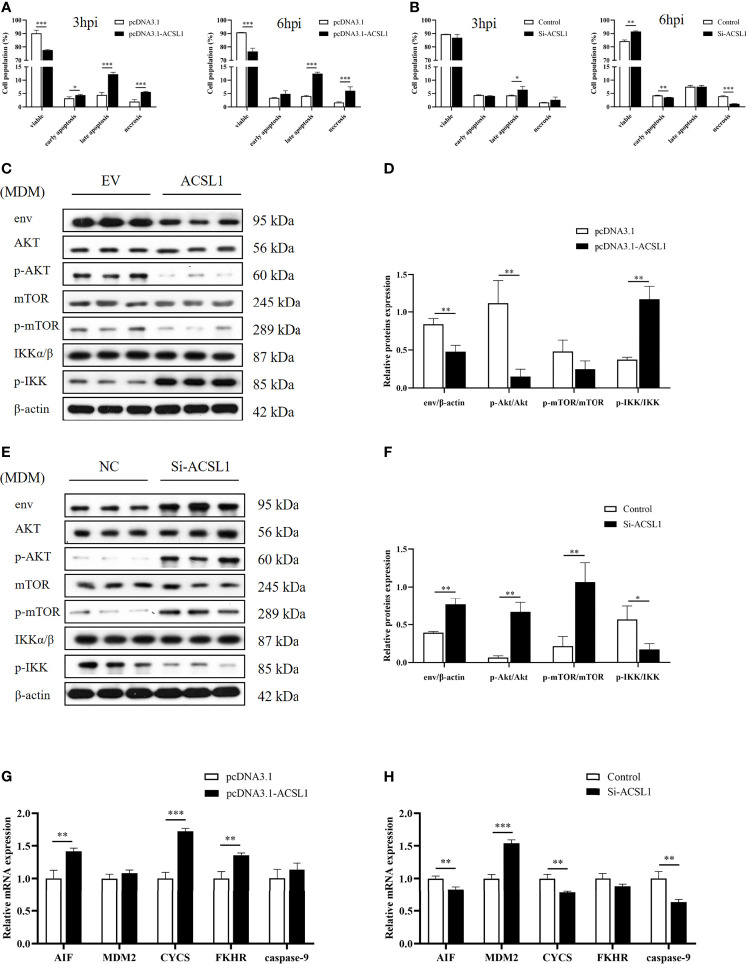
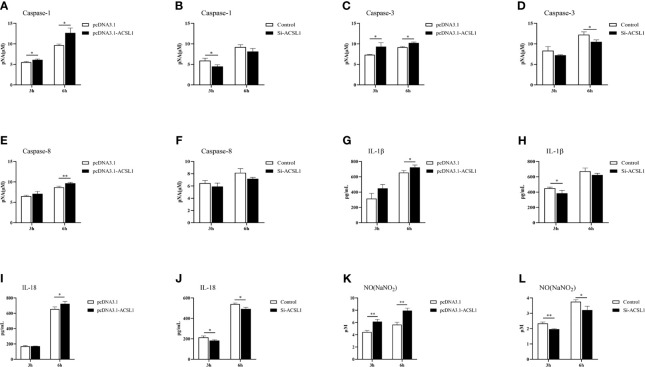
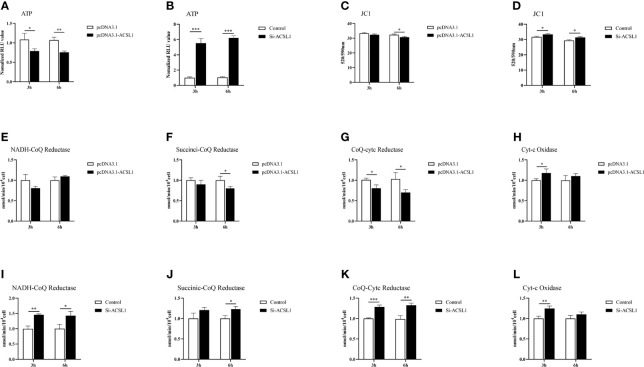
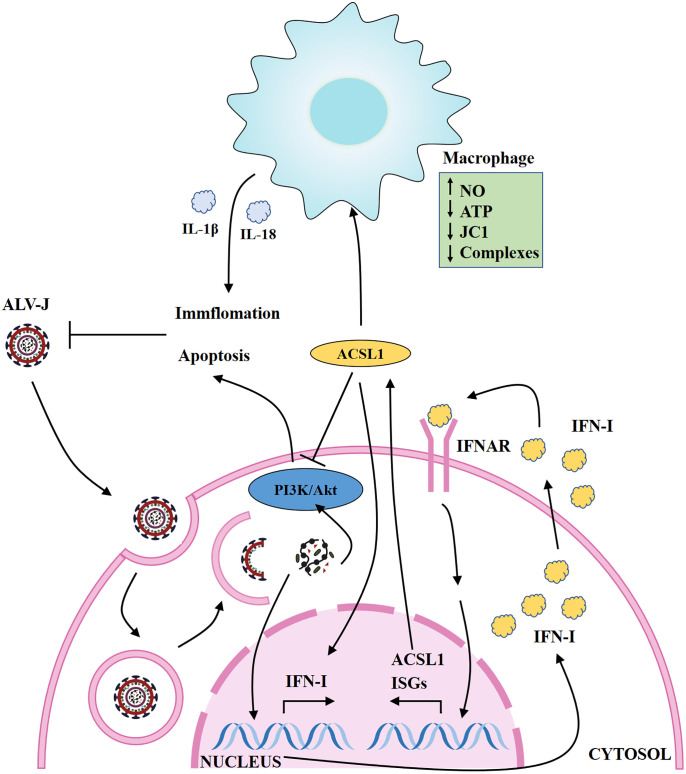
J subgroup avian leukosis virus (ALV-J) infection causes serious immunosuppression problems, leading to hematopoietic malignancy tumors in chicken. It has been demonstrated that interferon-stimulated genes (ISGs) could limit ALV-J replication; nevertheless, the underlying mechanisms remain obscure. Here, we demonstrate that Long-chain Acyl-CoA synthetase 1 (ACSL1) is an interferon (IFN)-stimulated gene that specifically restricts the replication of ALV-J due to the higher IFN-I production. More importantly, ACSL1 induces primary monocyte-derived macrophages (MDMs) to pro-inflammatory phenotypic states during ALV-J infection, and ACSL1 mediates apoptosis through the PI3K/Akt signaling pathway in ALV-J-infected primary monocyte-derived macrophages (MDMs). Overall, these results provide evidence that ACSL1 contributes to the antiviral response against ALV-J.

Keywords: ACSL1; ALV-J; IFN-Ⅰ; PI3K/Akt; apoptosis.


Conflict of interest statement

The authors declare that the research was conducted in the absence of any commercial or financial relationships that could be construed as a potential conflict of interest.

Figures

Figure 1
Figure 1
ALV-J infection induces ACSL1 expression, an IFN stimulated gene. (A, B) DF-1 cells (A) and MDMs (B) were infected with ALV-J (104 TCID50/0.1 ml) or treated with IFN-α (1,000 U/ml) for the indicated time. Relative mRNA levels of ACSL1 were analyzed by quantitative RT-PCR (qRT-PCR). (C) Flag-ACSL1 was expressed in DF-1 cells for 24 h, then the cells were infected with ALV-J (104 TCID50/0.1 ml) or treated with IFN-α (1,000 U/ml). Immunofluorescence with anti-Flag antibody was used to detect the overexpressed protein (green). Nuclear was identified by DAPI (blue). Scale bar, 75 μm. Experiments were repeated at least three times independently, with similar results obtained. (D) Distribution of ACSL1 in various specific-pathogen-free (SPF) White Leghorn chicken tissue following intraperitoneal injection of serum-free DMEM was determined using qRT-PCR analysis. (E) ACSL1 mRNA expression change in various specific-pathogen-free (SPF) White Leghorn chicken tissue following intraperitoneal injection of ALV-J (0.2 ml, 104 TCID50/0.1 ml) determined by qRT-PCR. Data shown are the means ± SEM (n=3). P values were calculated using two-tailed unpaired Student’ t-test. Differences with p < 0.05 were considered significant. *P < 0.05, **P < 0.01, ***P < 0.001.
Figure 2
Figure 2
ACSL1 inhibited ALV-J replication by enhancing IFN-I production. (A, C) ACSL1 overexpression (A) and knockdown (C) in DF-1cells for 48 h and then infected with ALV-J (104 TCID50/0.1 ml). Relative mRNA levels of gp85 were determined by qRT-PCR for the indicated time. (B, D) ACSL1 overexpression and knockdown in DF-1 cells for 48 h and then infected with ALV-J (104 TCID50/0.1 ml) for 6 and 12 h before assays. Immunoblot analysis of the levels of ALV-J envelope protein JE9 (env), STAT1, and p-STA1 from ACSL1 overexpression cells (B) or ACSL1 knockdown cells (D). (E, F) The levels of IFN-α/IFN-β were determined by qRT-PCR (E) and ELISA (F) from ACSL1 overexpression cells. (G, H) qRT-PCR (G) and ELISA (H) analysis of the expression levels of IFN-α/IFN-β from ACSL1 knockdown cells. (I, J) qRT-PCR analysis of the expression levels of ISGs, including PKR, OAS, ZC3HAV1, and Mx from ACSL1 overexpression (I) or knockdown cells (J). (K) DF-1 cells were transfected with small interfering RNA (siACSL1 or si-control) for 48 h prior to treatment with IFN-α (1,000 U/ml) for 1 h and then infected with ALV-J (104 TCID50/0.1 ml). qRT-PCR analysis of gp85 level for the indicated time. Data shown are the means ± SEM (n=3). P values were calculated using two-tailed unpaired Student’ t-test. Differences with P < 0.05 were considered significant. *P < 0.05, **P < 0.01, ***P < 0.001.
Figure 3
Figure 3
ACSL1 inhibited the activation of Akt. (A–C) Immunoblot analysis of Akt and p-Akt expression from ACSL1 overexpression cells for the indicated time (A). Statistical analysis of the relative abundance of protein between p-Akt and Akt (B, C). (D–F) Immunoblot analysis of Akt and p-Akt expression from ACSL1 knockdown cells for the indicated time (D). Statistical analysis of the relative abundance of protein between p-Akt and Akt (E, F). (G–I) LY294002 were pretreated in ACSL1 knockdown cells for 1h and then infected with ALV-J. Immunoblot analysis of env, Akt, and p-Akt expression for the 12 h (G). Statistical analysis of the relative abundance of protein between p-Akt and Akt (H), env and actin (I). The experiments were repeated three times, independently, with similar results obtained. Data shown are the means ± SEM (n=3). P values were calculated using two-tailed unpaired Student’ t-test. Differences with P < 0.05 were considered significant. ***P < 0.001.
Figure 4
Figure 4
ACSL1 induced apoptosis via PI3K/Akt signaling pathway. (A, B) ACSL1 overexpression (A) and knockdown (B) in MDMs for 48 h, followed by infection with ALV-J (104 TCID50/0.1 ml) before assays. Apoptosis analysis of MDMs for 3 and 6 hpi, using Annexin V-FITC. Statistical analysis of the data from the multiple repeated Annexin V-FITC experiments. (C, D) Immunoblot analysis of the levels of env, Akt, p-Akt, mTOR, p-mTOR, IKKα/β, and p-IKK expression in MDMs transfected with ACSL1 expression plasmids or empty vector control for 48 h followed by ALV-J infection for 3 h. (E, F) Immunoblot analysis of the levels of env, Akt, p-Akt, mTOR, p-mTOR, IKKα/β, and p-IKK expression in MDMs transfected with siACSL1 or control siRNA for 48 h followed by ALV-J infection for 3 h. (G, H) qRT-PCR analysis of apoptosis-related genes (AIF, CYCS, FKHR, MDM2, and caspase-9) in ACSL1 overexpressed cells (G) or ACSL1 knockdown cells (H) followed by ALV-J infection for 3 h. Data shown are the means ± SEM (n=3). P values were calculated using two-tailed unpaired Student’s t-test. Differences with P < 0.05 were considered significant. *P < 0.05, **P < 0.01, ***P < 0.001.
Figure 5
Figure 5
ACSL1 promoted inflammation in MDMs. (A–F) Caspase-1, caspase-3, and caspase-8 activity assay kits were used to analyze caspase-1 (A, B), caspase-3 (C, D), and caspase-8 (E, F) enzyme activities in ACSL1 overexpressed cells or ACSL1 knockdown cells followed by ALV-J infection for 3 and 6 h. (G–J) The supernatants were harvested to examine the levels of IL-1β (G, H) and IL-18 (I, J) by ELISA. (K, L) The supernatants were harvested to examine the concentration of NO by NO commercial kit. Data shown are the means ± SEM (n=3). P values were calculated using two-tailed unpaired Student’s t-test. Differences with P < 0.05 were considered significant. *P < 0.05, **P < 0.01.
Figure 6
Figure 6
ACSL1 induces MDMs to pro-inflammatory phenotypic states. (A, B) The levels of ATP were detected by Enhanced ATP assay kit. (C–D) The levels of mitochondrial membrane potential JC1 were detected by Enhanced mitochondrial membrane potential assay kit with JC-1. (E–L) Mitochondrial respiratory chain complexes activity detection kit was used to analyze mitochondrial respiratory chain enzyme activities. Data shown are the means ± SEM (n=3). P values were calculated using two-tailed unpaired Student’s t-test. Differences with P < 0.05 were considered significant. *P < 0.05, **P < 0.01, ***P < 0.001.
Figure 7
Figure 7
Schematic map of ACSL1 regulating ALV-J replication. ACSL1 positively regulates type IFN-I production, induces apoptosis via the PI3K/Akt signaling pathway, and promotes inflammation, which in turn inhibits ALV-J replication. IFNAR, interferon receptors; ISGs, interferon stimulate genes.

References

    1. Gao YL, Qin LT, Pan W, Wang YQ, Qi XL, Gao HL, et al. . Avian Leukosis Virus Subgroup J in Layer Chickens, China. Emerg Infect Dis (2010) 16:1637–45. doi: 10.3201/eid1610.100780 - DOI - PMC - PubMed
    1. Ye J, Fan Z, Shang J, Tian X, Yang J, Chen H, et al. . ALV-J GP37 Molecular Analysis Reveals Novel Virus-Adapted Sites and Three Tyrosine-Based Env Species. PloS One (2015) 10:e122887. doi: 10.1371/journal.pone.0122887 - DOI - PMC - PubMed
    1. Li Y, Fu J, Cui S, Meng F, Cui Z, Fan J, et al. . Gp85 Genetic Diversity of Avian Leukosis Virus Subgroup J Among Different Individual Chickens From a Native Flock. Poult. Sci (2017) 96:1100–7. doi: 10.3382/ps/pew407 - DOI - PubMed
    1. Lin W, Li X, Dai Z, Zhang X, Chang S, Zhao P, et al. . Molecular Epidemiology of J-Subgroup Avian Leukosis Virus Isolated From Meat-Type Chickens in Southern China Between 2013 and 2014. Arch Virol (2016) 161:3039–46. doi: 10.1007/s00705-016-3003-8 - DOI - PubMed
    1. Liao Z, Zhang X, Song C, Lin W, Xie Q. ALV-J Inhibits Autophagy Through the GADD45β/MEKK4/P38MAPK Signaling Pathway and Mediates Apoptosis Following Autophagy. Cell Death Dis (2020) 11:684. doi: 10.1038/s41419-020-02841-y - DOI - PMC - PubMed

Publication types