Identification of Potential Novel Prognosis-Related Genes Through Transcriptome Sequencing, Bioinformatics Analysis, and Clinical Validation in Acute Myeloid Leukemia
- PMID: 34777462
- PMCID: PMC8585857
- DOI: 10.3389/fgene.2021.723001
Identification of Potential Novel Prognosis-Related Genes Through Transcriptome Sequencing, Bioinformatics Analysis, and Clinical Validation in Acute Myeloid Leukemia
Abstract
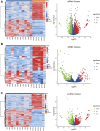
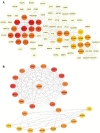
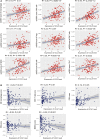
Background: Acute Myeloid Leukemia (AML) is a complex and heterogeneous hematologic malignancy. However, the function of prognosis-related signature genes in AML remains unclear. Methods: In the current study, transcriptome sequencing was performed on 15 clinical samples, differentially expressed RNAs were identified using R software. The potential interactions network was constructed by using the common genes between target genes of differentially expressed miRNAs with transcriptome sequencing results. Functional and pathway enrichment analysis was performed to identify candidate gene-mediated aberrant signaling pathways. Hub genes were identified by the cytohubba plugin in Cytoscape software, which then expanded the potential interactions regulatory module for hub genes. TCGA-LAML clinical data were used for the prognostic analysis of the hub genes in the regulatory network, and GVSA analysis was used to identify the immune signature of prognosis-related hub genes. qRT-PCR was used to verify the expression of hub genes in independent clinical samples. Results: We obtained 1,610 differentially expressed lncRNAs, 233 differentially expressed miRNAs, and 2,217 differentially expressed mRNAs from transcriptome sequencing. The potential interactions network is constructed by 12 lncRNAs, 25 miRNAs, and 692 mRNAs. Subsequently, a sub-network including 15 miRNAs as well as 12 lncRNAs was created based on the expanded regulatory modules of 25 key genes. The prognostic analysis results show that CCL5 and lncRNA UCA1 was a significant impact on the prognosis of AML. Besides, we found three potential interactions networks such as lncRNA UCA1/hsa-miR-16-5p/COL4A5, lncRNA UCA1/hsa-miR-16-5p/SPARC, and lncRNA SNORA27/hsa-miR-17-5p/CCL5 may play an important role in AML. Furthermore, the evaluation of the immune infiltration shows that CCL5 is positively correlated with various immune signatures, and lncRNA UCA1 is negatively correlated with the immune signatures. Finally, the result of qRT-PCR showed that CCL5 is down-regulated and lncRNA UCA1 is up-regulated in AML samples separately. Conclusions: In conclusion, we propose that CCL5 and lncRNA UCA1 could be recognized biomarkers for predicting survival prognosis based on constructing competing endogenous RNAs in AML, which will provide us novel insight into developing novel prognostic, diagnostic, and therapeutic for AML.
Keywords: Acute Myeloid Leukemia; Competing endogenous RNA; bioinformatics; prognosis-related genes; transcriptome sequencing (RNA-seq).
Copyright © 2021 Wang, Uddin, Hao, Chen, Xiang, Xiong and Wu.
Conflict of interest statement
The authors declare that the research was conducted in the absence of any commercial or financial relationships that could be construed as a potential conflict of interest.
Figures


Similar articles
-
Identification of circRNA-lncRNA-miRNA-mRNA Competitive Endogenous RNA Network as Novel Prognostic Markers for Acute Myeloid Leukemia.Genes (Basel). 2020 Jul 31;11(8):868. doi: 10.3390/genes11080868. Genes (Basel). 2020. PMID: 32751923 Free PMC article.
-
Identification of immunity-related lncRNAs and construction of a ceRNA network of potential prognostic biomarkers in acute myeloid leukemia.Front Genet. 2023 Jun 14;14:1203345. doi: 10.3389/fgene.2023.1203345. eCollection 2023. Front Genet. 2023. PMID: 37388937 Free PMC article.
-
Integrative Analysis of Three Novel Competing Endogenous RNA Biomarkers with a Prognostic Value in Lung Adenocarcinoma.Biomed Res Int. 2020 Aug 4;2020:2837906. doi: 10.1155/2020/2837906. eCollection 2020. Biomed Res Int. 2020. PMID: 32802839 Free PMC article.
-
[Construction and analysis of competitive endogenous RNA regulatory network related to gastric cancer].Zhonghua Zhong Liu Za Zhi. 2020 Feb 23;42(2):115-121. doi: 10.3760/cma.j.issn.0253-3766.2020.02.006. Zhonghua Zhong Liu Za Zhi. 2020. PMID: 32135645 Chinese.
-
Transcriptome analysis identified a novel 3-LncRNA regulatory network of transthyretin attenuating glucose induced hRECs dysfunction in diabetic retinopathy.BMC Med Genomics. 2019 Oct 15;12(1):134. doi: 10.1186/s12920-019-0596-2. BMC Med Genomics. 2019. PMID: 31615521 Free PMC article.
Cited by
-
Prognostic role of chemokine-related genes in acute myeloid leukemia.PeerJ. 2024 Aug 9;12:e17862. doi: 10.7717/peerj.17862. eCollection 2024. PeerJ. 2024. PMID: 39135956 Free PMC article.
-
Effects of Hypomethylating Agents on Gene Modulation in the Leukemic Microenvironment and Disease Trajectory in a Mouse Model of AML.bioRxiv [Preprint]. 2024 Dec 5:2024.12.01.626276. doi: 10.1101/2024.12.01.626276. bioRxiv. 2024. PMID: 39677768 Free PMC article. Preprint.
-
Transcriptomic analysis of non-leukemic cell subsets in azacytidine-responsive AML highlights pathways associated with adhesion, platelet aggregation, and angiogenesis in mice and humans.Mol Med. 2025 May 13;31(1):185. doi: 10.1186/s10020-025-01233-2. Mol Med. 2025. PMID: 40360989 Free PMC article.
-
Clinical Aspects and Significance of β-Chemokines, γ-Chemokines, and δ-Chemokines in Molecular Cancer Processes in Acute Myeloid Leukemia (AML) and Myelodysplastic Neoplasms (MDS).Cancers (Basel). 2024 Sep 24;16(19):3246. doi: 10.3390/cancers16193246. Cancers (Basel). 2024. PMID: 39409868 Free PMC article. Review.
-
Comprehensive analysis of cuproptosis-associated LncRNAs predictive value and related CeRNA network in acute myeloid leukemia.Heliyon. 2023 Nov 25;9(12):e22532. doi: 10.1016/j.heliyon.2023.e22532. eCollection 2023 Dec. Heliyon. 2023. PMID: 38058427 Free PMC article.
References
-
- Anderlini P., Luna M., Kantarjian H. M., O'Brien S., Pierce S., Keating M. J., et al. (1996). Causes of Initial Remission Induction Failure in Patients with Acute Myeloid Leukemia and Myelodysplastic Syndromes. Leukemia 10, 600–608. - PubMed
LinkOut - more resources
Full Text Sources
Miscellaneous

