. 2021 Oct 29:12:728791.
doi: 10.3389/fgene.2021.728791. eCollection 2021.

RNA Biological Characteristics at the Peak of Cell Death in Different Hereditary Retinal Degeneration Mutants

Affiliations

RNA Biological Characteristics at the Peak of Cell Death in Different Hereditary Retinal Degeneration Mutants

Chunling Wei et al. Front Genet. .

Abstract

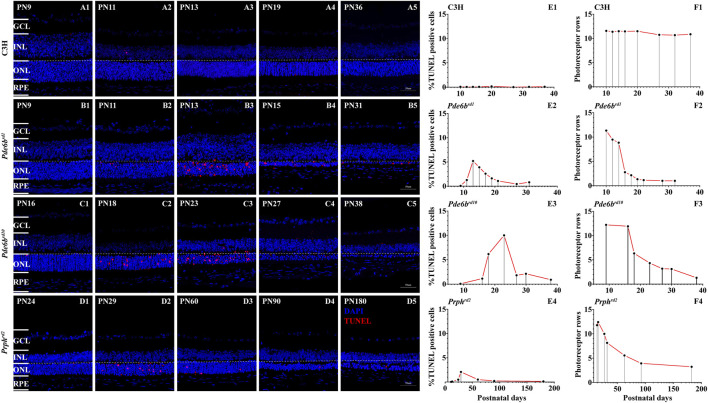
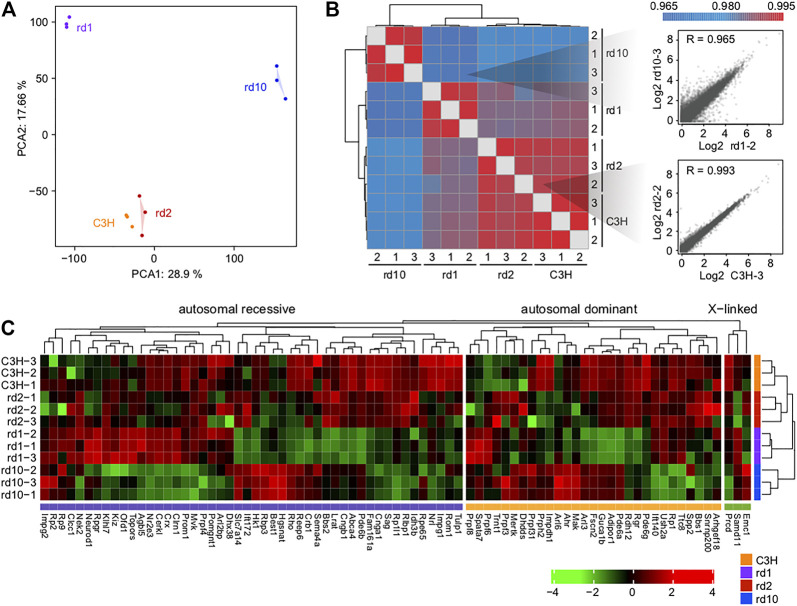
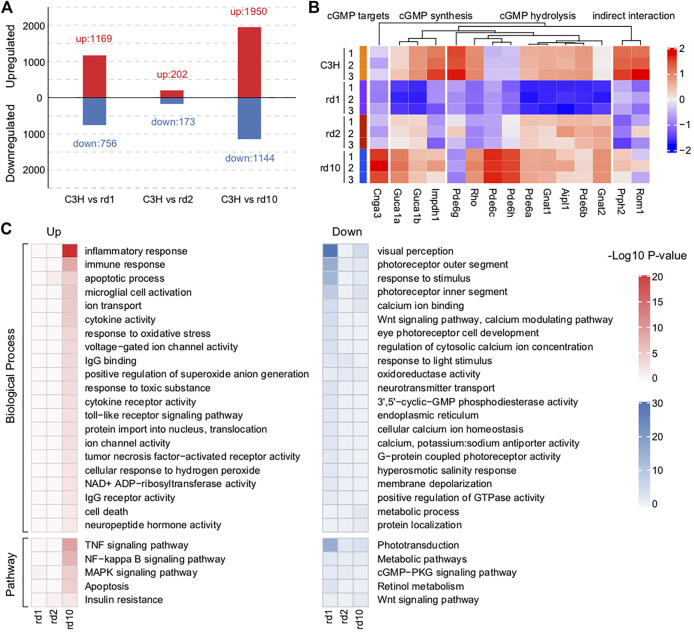
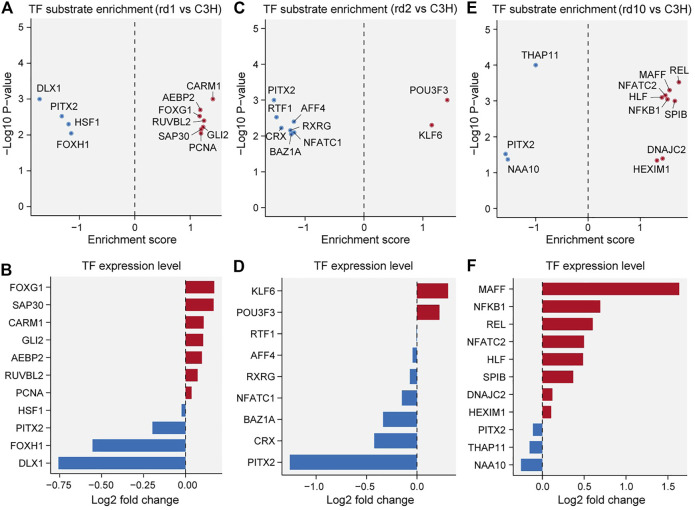
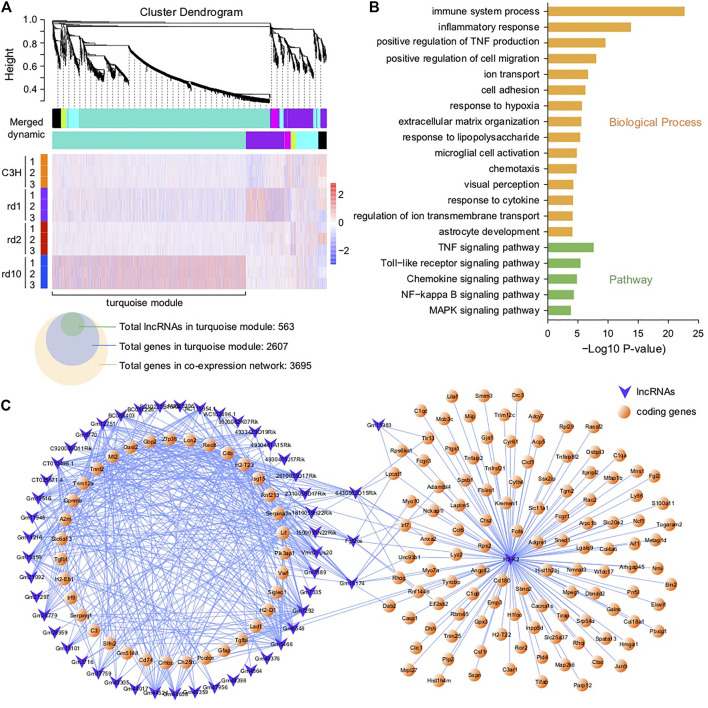
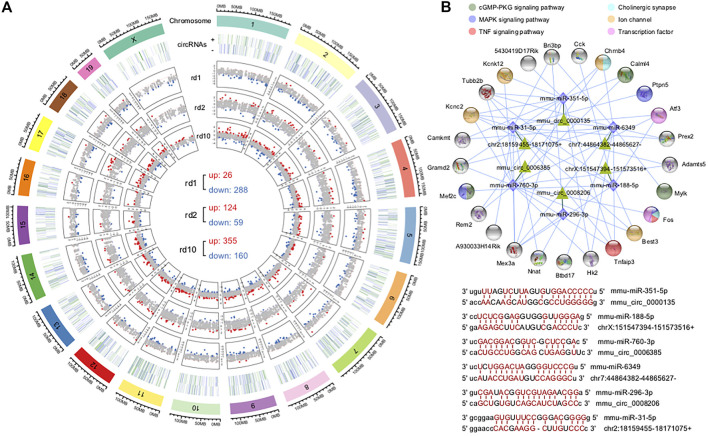
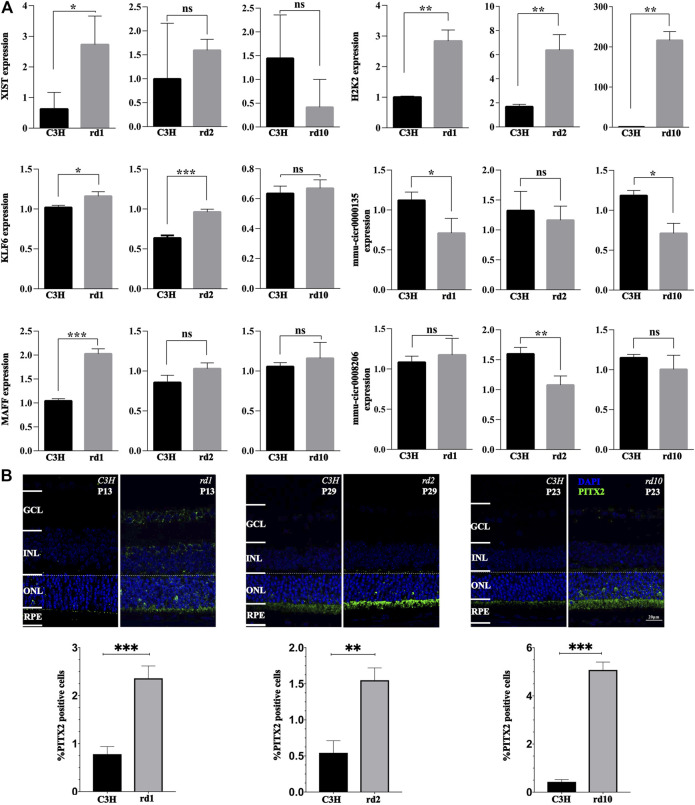
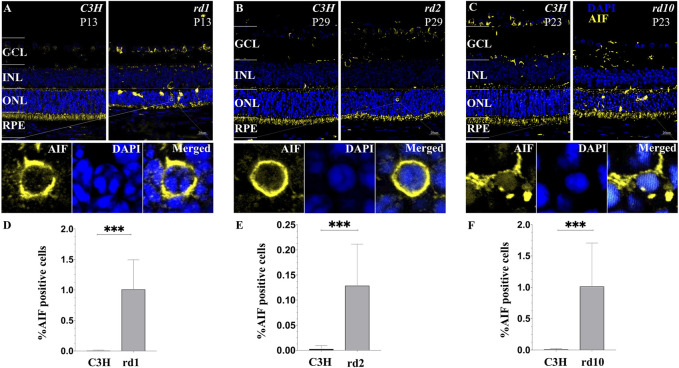
Purpose: The present work investigated changes in the gene expression, molecular mechanisms, and pathogenesis of inherited retinal degeneration (RD) in three different disease models, to identify predictive biomarkers for their varied phenotypes and to provide a better scientific basis for their diagnosis, treatment, and prevention. Methods: Differentially expressed genes (DEGs) between retinal tissue from RD mouse models obtained during the photoreceptor cell death peak period (Pde6b rd1 at post-natal (PN) day 13, Pde6b rd10 at PN23, Prph rd2 at PN29) and retinal tissue from C3H wild-type mice were identified using Illumina high-throughput RNA-sequencing. Co-expression gene modules were identified using a combination of GO and KEGG enrichment analyses and gene co-expression network analysis. CircRNA-miRNA-mRNA network interactions were studied by genome-wide circRNA screening. Results: Pde6b rd1 , Pde6b rd10 , and Prph rd2 mice had 1,926, 3,096, and 375 DEGs, respectively. Genes related to ion channels, stress, inflammatory processes, tumor necrosis factor (TNF) production, and microglial cell activation were up-regulated, while genes related to endoplasmic reticulum regulation, metabolism, and homeostasis were down-regulated. Differential expression of transcription factors and non-coding RNAs generally implicated in other human diseases was detected (e.g., glaucoma, diabetic retinopathy, and inherited retinal degeneration). CircRNA-miRNA-mRNA network analysis indicated that these factors may be involved in photoreceptor cell death. Moreover, excessive cGMP accumulation causes photoreceptor cell death, and cGMP-related genes were generally affected by different pathogenic gene mutations. Conclusion: We screened genes and pathways related to photoreceptor cell death. Additionally, up-stream regulatory factors, such as transcription factors and non-coding RNA and their interaction networks were analyzed. Furthermore, RNAs involved in RD were functionally annotated. Overall, this study lays a foundation for future studies on photoreceptor cell death mechanisms.

Keywords: RNA-seq; biogenic analysis; cGMP-related genes; inherited retinal degeneration (IRD); photoreceptor cell death.


Conflict of interest statement

The authors declare that the research was conducted in the absence of any commercial or financial relationships that could be construed as a potential conflict of interest.

Figures

FIGURE 1
FIGURE 1
TUNEL assay and cell death in RD mutants. The number of TUNEL positive cells in the three different RD mutants ONL was strongly increased when compared with wt (A1–D5). Quantification of photoreceptor cell death and photoreceptor rows during the first 40 postnatal days in C3H wild-type, Pde6b rd1 , Pde6b rd10 mutants and 180 days in Prph rd2 (A–F). Increased numbers of TUNEL positive cells, showing a peak at PN13 in Pde6b rd1 , PN23 in Pde6b rd10 , PN29 in Prph rd2 was observed (B1–D5). Quantification of photoreceptor rows during the first 40 postnatal days in Pde6b rd1 , Pde6b rd10 , C3H and 180 days in Prph rd2 . In Pde6b rd1 , photoreceptor rows showed the highest number at PN9 (13 ONL cell rows remaining), declining thereafter. In the other two mutants the photoreceptor rows showed the highest number at PN9 in Pde6b rd10 (12 ONL cell rows remaining) and PN13 in Prph rd2 , declining thereafter. In the RD models, dying cells and photoreceptor cells rows were detectable as late at PN40 in Pde6b rd1 and Pde6b rd10 (B5, C5), at PN180 in Prph rd2 (D5). The values shown originate from three RD mutants from at least three different specimens. Scale bar represents 50 µm.
FIGURE 2
FIGURE 2
Overall transcriptomic profiles of the three mice models. (A) Principal component analysis and (B) Pearson correlation coefficients showing the similarity and reproducibility among different biological replicates; (C) The expression levels of inherited retinal disease-associated genes in control and RD mice. Note that rd10 retina expresses Pde6b mRNA, albeit for a catalytically inactive protein.
FIGURE 3
FIGURE 3
Impaired functions related to phototransduction found in RD mice retina. (A) The numbers of differentially expressed genes (DEGs) between C3H mice and each RD model. A total of 1925 DEGs (1,169 up-regulated and 756 down-regulated), 375 DEGs (202 up-regulated and 173 down-regulated), and 3,094 DEGs (1950 up-regulated and 1,144 down-regulated) were respectively identified between Pde6b rd1 and C3H mice, between Prph rd2 and C3H mice, and between Pde6b rd10 and C3H mice. (B) Changes in the expression of key genes related to cGMP synthesis, hydrolysis, and targets in RD mice versus that in C3H mice. Genes involved in cGMP synthesis and hydrolysis were generally differentially expressed, especially in the PDE6 mutant Pde6b rd1 and Pde6b rd10 mice. (C) Functional enrichment analysis of the identified DEGs based on p < 0.05. These up-regulated DEGs mainly were enriched ion channel activity, inflammatory process, immune response, TNF signaling pathway, MAPK signaling pathway, and microglial cell activation. The down-regulated DEGs were related to visual perception, Wnt signaling pathway, calcium modulating pathway, positive regulation of GTPase activity, cGMP-PKG signaling pathway and retinal metabolism.
FIGURE 4
FIGURE 4
Transcriptional factor (TF) substrate enrichment analysis in the three RD models versus C3H mice. (A, C, E) TF substrate enrichment score and significance in Pde6b rd1 (B), Prph rd2 (D), and Pde6b rd10 (F) mice; PITX2 were all down-regulated in RD mice compared with the C3H mice. (B, D, F) Log2 fold changes of the indicated TF expression levels in Pde6b rd1 (B), Prph rd2 (D), and Pde6b rd10 (F) mice. FOXG1, KLF6, and MAFF were up-regulated in RD mice; while DLX1 and NAA10 were down-regulated in RD mice.
FIGURE 5
FIGURE 5
Co-expression network analysis of DE lncRNAs and coding genes. (A) Co-expression modules of DEGs and their expression profile in all samples; A total of 563 DE-lncRNAs and 2,607 genes were found in turquoise module, and 3,695 genes in the co-expression network. (B) Functional enrichment analysis of DEGs in the turquoise module; The genes in the networks were significantly enriched in immune system process, inflammatory response, positive regulation of TNF production, TNF signaling pathway, Toll-like receptor signaling pathway, chemokine signaling pathway, and MAPK signaling pathway. (C) Network connections of lncRNAs with coding genes in the turquoise module—only topological overlap matrices with >0.69 similarity are displayed.
FIGURE 6
FIGURE 6
Identification of differentially expressed circRNAs and construction of ceRNA networks. (A) Chromosome distribution of circRNAs in mouse retina and their fold changes in the three RD models; There were 314 DE circRNAs (26 up-regulated and 288 down-regulated), 183 DE-circRNAs (124 up-regulated and 59 down-regulated) and 515 DE-cicrRNAs (355 up-regulated and 160 down-regulated) in Pde6b rd1 , Prph rd2 , and Pde6b rd10 . (B) The circRNA-miRNA-mRNA interaction network constructed using the common DE circRNAs and DEGs of the three RD mouse models; representative circRNA-miRNA interaction sites predicted by miRanda. These DE circRNAs were enriched in cGMP-PKG signaling pathway, MAPK signaling pathway, TNF signaling pathway, ion channel, transcription factor and cholinergic synapse.
FIGURE 7
FIGURE 7
Validation of gene expression changes via qPCR and immunofluorescence. (A) The relative levels of XIST, H2K2, MAFF, KLF6, mmu-circ0000135, and mmu-circ0008206 in different groups at different times determined by real-time quantitative PCR. (B) PITX2 expression in C3H wild-type, rd1, rd2, and rd10 retina at time-points corresponding to the peak of retinal degeneration as assessed by immunofluorescence. Quantification in bar graphs displays the percentage of PITX2 positive cells in the outer nuclear layer (ONL). Significance levels indicated by asterisks: * = p < 0.05, ** = p < 0.01, *** = p < 0.001.
FIGURE 8
FIGURE 8
Translocation of AIF in various models of RD photoreceptors. (A–C) Confocal microscopy of RD retinal sections stained with AIF (yellow fluorescence) and the nuclear dye DAPI (blue). Cells that demonstrate a clear AIF staining of the nucleus were regarded as positive for AIF translocation. (D–F) Note that C3H wild-type control lack any detectable AIF redistribution to the nucleus. The values shown originate from three RD mutants from at least three different specimens. Quantification in bar graphs displays the percentage of AIF positive cells in the outer nuclear layer (ONL). Significance levels indicated by asterisks: * = p < 0.05, ** = p < 0.01, *** = p < 0.001.

References

    1. A L., Zou T., He J., Chen X., Sun D., Fan X., et al. (2019). Rescue of Retinal Degeneration in Rd1 Mice by Intravitreally Injected Metformin. Front. Mol. Neurosci. 12, 102. 10.3389/fnmol.2019.00102 - DOI - PMC - PubMed
    1. Akiba R., Matsuyama T., Takahashi M., Mandai M. (2020). Toward Establishment of Regenerative Cell Therapy for Retinitis Pigmentosa Using iPS Cell Derived Retinal Sheet. Folia Pharmacol. Jpn. 155, 93–98. 10.1254/fpj.19124 - DOI - PubMed
    1. Amaral P. P., Dinger M. E., Mattick J. S. (2013). Non-coding RNAs in Homeostasis, Disease and Stress Responses: an Evolutionary Perspective. Brief. Funct. Genomics 12, 254–278. 10.1093/bfgp/elt016 - DOI - PubMed
    1. Arango-Gonzalez B., Trifunović D., Sahaboglu A., Kranz K., Michalakis S., Farinelli P., et al. (2014). Identification of a Common Non-apoptotic Cell Death Mechanism in Hereditary Retinal Degeneration. PLoS One 9, e112142. 10.1371/journal.pone.0112142 - DOI - PMC - PubMed
    1. Badugu R., Garcia M., Bondada V., Joshi A., Geddes J. W. (2008). N Terminus of Calpain 1 Is a Mitochondrial Targeting Sequence. J. Biol. Chem. 283, 3409–3417. 10.1074/jbc.m706851200 - DOI - PubMed