. 2021 Aug 10;14(5):459-469.
doi: 10.1007/s12195-021-00688-7. eCollection 2021 Oct.

Vesicle-Based Sensors for Extracellular Potassium Detection

Affiliations

Vesicle-Based Sensors for Extracellular Potassium Detection

Margrethe A Boyd et al. Cell Mol Bioeng. .

Abstract

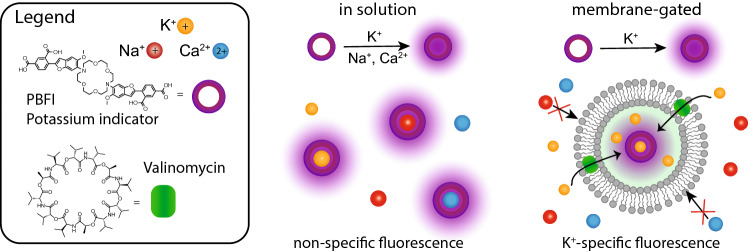
Introduction: The design of sensors that can detect biological ions in situ remains challenging. While many fluorescent indicators exist that can provide a fast, easy readout, they are often nonspecific, particularly to ions with similar charge states. To address this issue, we developed a vesicle-based sensor that harnesses membrane channels to gate access of potassium (K+) ions to an encapsulated fluorescent indicator.

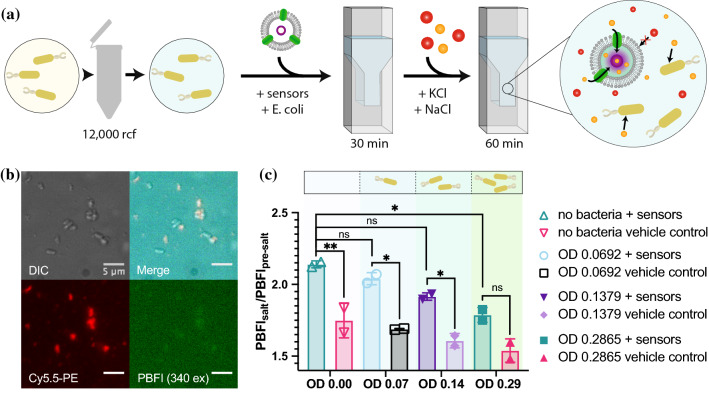
Methods: We assembled phospholipid vesicles that incorporated valinomycin, a K+ specific membrane transporter, and that encapsulated benzofuran isophthalate (PBFI), a K+ sensitive dye that nonspecifically fluoresces in the presence of other ions, like sodium (Na+). The specificity, kinetics, and reversibility of encapsulated PBFI fluorescence was determined in a plate reader and fluorimeter. The sensors were then added to E. coli bacterial cultures to evaluate K+ levels in media as a function of cell density.

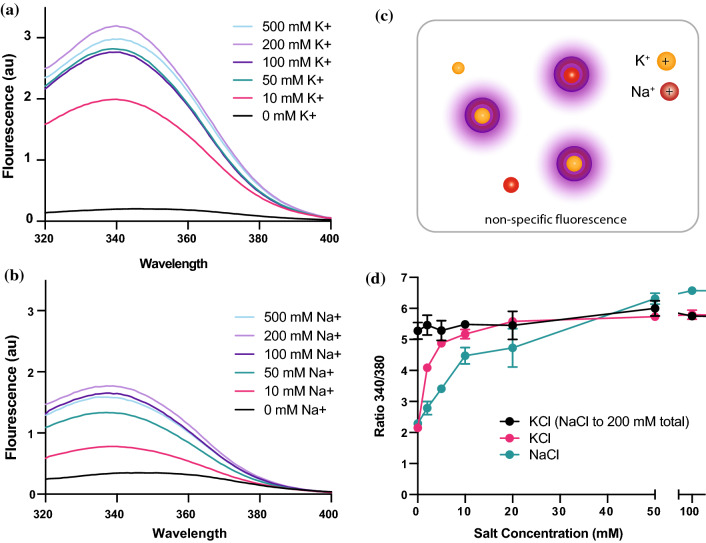
Results: Vesicle sensors significantly improved specificity of K+ detection in the presence of a competing monovalent ion, sodium (Na+), and a divalent cation, calcium (Ca2+), relative to controls where the dye was free in solution. The sensor was able to report both increases and decreases in K+ concentration. Finally, we observed our vesicle sensors could detect changes in K+ concentration in bacterial cultures.

Conclusion: Our data present a new platform for extracellular ion detection that harnesses ion-specific membrane transporters to improve the specificity of ion detection. By changing the membrane transporter and encapsulated sensor, our approach should be broadly useful for designing biological sensors that detect an array of biological analytes in traditionally hard-to-monitor environments.

Supplementary information: The online version contains supplementary material available at 10.1007/s12195-021-00688-7.

Keywords: Biosensing; Fluorescence; Ionophore; Liposome; Membrane.


Figures

Figure 1
Figure 1
Design of the vesicle-based K+ nanosensor. PBFI, a commonly used indicator of K+ ions, fluoresces in the presence of K+ as well as other ions, such as Na+ and Ca2+. In solution, PBFI fluorescence due to K+ binding is indistinguishable from PBFI fluorescence due to Na+ and Ca2+ binding. Membrane gating provides a route to selectively exclude ions from binding to PBFI. By encapsulating PBFI in lipid vesicles that contain valinomycin, a cyclic peptide that selectively transports K+ ions across bilayer membranes, K+ can diffuse in and out of the vesicle. Once inside the vesicle nanosensor, K+ can bind PBFI to generate an optically detectable fluorescence shift. By contrast, Na+ and Ca2+ ions are excluded from the vesicle interior and their presence will not be reported.
Figure 2
Figure 2
Spectral characterization of the PBFI indicator. (a) Emission spectra of PBFI in solution as a function of K+ concentration and (b) Na+ concentration. (c) A schematic of these studies shows that, in solution, a variety of ions are expected to interact with PBFI and shift the fluorescence of the indicator. (d) The fluorescence intensity ratio of PBFI emission at 505 nm when excited at 340 and 380 nm is reported as a function of salt concentration for KCl and/or NaCl. This reported 340/380 intensity ratio is standard to assess K+ concentrations when using PBFI. N = 3, error bars represent standard deviation.
Figure 3
Figure 3
Encapsulation of PBFI with valinomycin as a membrane gate improves specificity to K+. (a) Schematic illustrating how membrane gating with valinomycin results in K+-specific access to encapsulated PBFI dye. (b) Vesicles with either 0.1 mol% or 0.2 mol% valinomycin exhibit a significant increase in PBFI ratio as K+ concentration increases compared to respective control vesicles, even when Na+ is present at a total salt concentration of 100 mM (p ≤ 0.0001, [K+] > 0 mM). Vesicles without ionophore or with DMSO only (vehicle controls) do not exhibit a response, indicating that increases in PBFI ratio are due to cross-membrane transport of K+ by valinomycin. (c) Vesicles with valinomycin exhibit significant increases in PBFI ratio as K+ concentration increases compared to respective control vesicles (p ≤ 0.0001, [K+] > 0 mM), which do not exhibit a significant response. (d) Vesicles with and without valinomycin do not exhibit significant changes in fluorescence as Na+ concentrations increase up to 50 mM (samples are not significantly different when [Na+] < 75 mM), with slight nonspecific leakage leading to increased PBFI fluorescence at high Na+ concentrations compared to respective controls. Samples are significantly different (p ≤ 0.05) when [Na+] = 100 mM. (e) Fluorescence ratios reported as a percentage of the maximum KCl signal observed for either PBFI encapsulated in vesicles, PBFI released into solution through vesicle lysis, or free PBFI in solution. In the absence of intact membranes, PBFI reports a higher fluorescence ratio in the presence of NaCl and CaCl2 in addition to KCl. N = 3, error bars represent standard deviation. ****p ≤ 0.0001, **p ≤ 0.01, *p ≤ 0.05, nonsignificant (ns) p > 0.05; p-values generated using a Two-Way ANOVA and Tukey’s Multiple Comparisons Test.
Figure 4
Figure 4
Response of vesicle sensors to changing salt conditions over time. (a) PBFI fluorescence in vesicles with valinomycin in the membrane increases over time following 50 mM KCl addition to surrounding buffer. Fluorescence does not change in corresponding vehicle controls, indicating that increasing PBFI ratios in vesicles are due to valinomycin-specific transport of K+. 0.2% valinomycin vesicles exhibit a significantly higher PBFI ratio than vehicle controls within 10 minutes (p ≤ 0.05), and high PBFI ratios in TritonX-lysed controls indicate that valinomycin-containing vesicles remained intact. (b) PBFI ratios in valinomycin-containing vesicles fitted to a one-phase association model (equation shown on graph). After lysis with TritonX, an increase in PBFI ratio indicates that vesicles remained intact following KCl addition. (c) Schematic of reversibility assays. Four populations of vesicles were generated: with and without valinomycin and with and without 100 mM KCl. Each population was purified through two columns, resulting in eight final salt conditions. Numerals correspond to results in (d) and yellow circles represent potassium. (d) Vesicles incubated without KCl (black) show a significant increase in PBFI ratio when purified through SEC columns with 100 mM KCl in the running buffer, while vesicles incubated with 100 mM KCl (pink) show a significant reduction in PBFI ratio when purified through SEC columns without salt in the running buffer. Vesicles with and without pre-incubation in KCl show significantly higher PBFI ratios when purified with KCl in the running buffer compared to salt-free buffer. Vehicle control vesicles both with (purple) and without pre-incubation (green) show no significant difference in fluorescence following purification. N = 3, error bars represent standard deviation. ****p ≤ 0.0001, ***p ≤ 0.001, **p ≤ 0.01, *p ≤ 0.05, nonsignificant (ns) p > 0.05; p-values generated using a Two-Way ANOVA and Tukey’s Multiple Comparisons Test.
Figure 5
Figure 5
Vesicles detect variations in [K+] in the presence of increasing concentrations of bacteria. (a) Schematic of bacterial studies with nanosensors. First, bacteria grown in MSgg media are spun down and resuspended in equiosmolar Tris. Bacteria diluted to varying final optical densities are added to a fluorimeter cuvette with 1 mM nanosensors. Following a 30 min incubation in the absence of salt, 50 mM KCl and 150 mM NaCl are added to cuvettes. Nanosensor fluorescence was assessed via fluorimeter after 1 h incubation following salt addition. (b) Nanosensors imaged after 1 hour of co-incubation with bacteria show distinct fluorescence of Cy5.5-PE, a membrane dye, and faint localization of PBFI measured at the 340 nm excitation wavelength. Nanosensors can be observed to be intact and in solution surrounding bacterial cells. (c) Change in nanosensor fluorescence following salt addition decreases as the concentration of bacteria increases, indicating potassium uptake by bacteria. Nanosensors in the absence of bacteria exhibit a significantly higher change in fluorescence compared to nanosensors incubated with bacteria at an optical density of 0.2865. Similarly, a significant difference was observed between sensor and vehicle control conditions in the absence of bacteria, while significance between these conditions decreases as bacterial optical density increases. No significant differences were observed between any vehicle control conditions (pink, black, light purple and pink bars; ns p > 0.05), not shown. N = 2, error bars represent standard deviation. **p ≤ 0.01, *p ≤ 0.05, nonsignificant (ns) p > 0.05; p values generated using a Two-Way ANOVA and Tukey’s Multiple Comparisons Test.

References

    1. Bazzigaluppi P, Dufour S, Carlen PL. Wide field fluorescent imaging of extracellular spatiotemporal potassium dynamics in vivo. Neuroimage. 2015;104:110–116. doi: 10.1016/j.neuroimage.2014.10.012. - DOI - PubMed
    1. Bischof H, et al. Novel genetically encoded fluorescent probes enable real-Time detection of potassium in vitro and in vivo. Nat. Commun. 2017;8:1–12. doi: 10.1038/s41467-016-0009-6. - DOI - PMC - PubMed
    1. Boyd MA, Kamat NP. Designing artificial cells towards a new generation of biosensors. Trends Biotechnol, In Press; 2020. - PubMed
    1. Boyd MA, Kamat NP. Visualizing Tension and Growth in Model Membranes Using Optical Dyes . Biophys J. 2018;115:1307–1315. doi: 10.1016/j.bpj.2018.08.021. - DOI - PMC - PubMed
    1. Cayley S, Record MT. Roles of cytoplasmic osmolytes, water, and crowding in the response of escherichia coli to osmotic stress: biophysical basis of osmoprotection by glycine betaine. Biochemistry. 2003;42:12596–12609. doi: 10.1021/bi0347297. - DOI - PubMed

LinkOut - more resources