

Identification of Biomarkers Related to Immune Cell Infiltration with Gene Coexpression Network in Myocardial Infarction
- PMID: 34777632
- PMCID: PMC8589498
- DOI: 10.1155/2021/2227067
Identification of Biomarkers Related to Immune Cell Infiltration with Gene Coexpression Network in Myocardial Infarction
Abstract
Background: There is evidence that the immune system plays a key critical role in the pathogenesis of myocardial infarction (MI). However, the exact mechanisms associated with immunity have not been systematically uncovered.
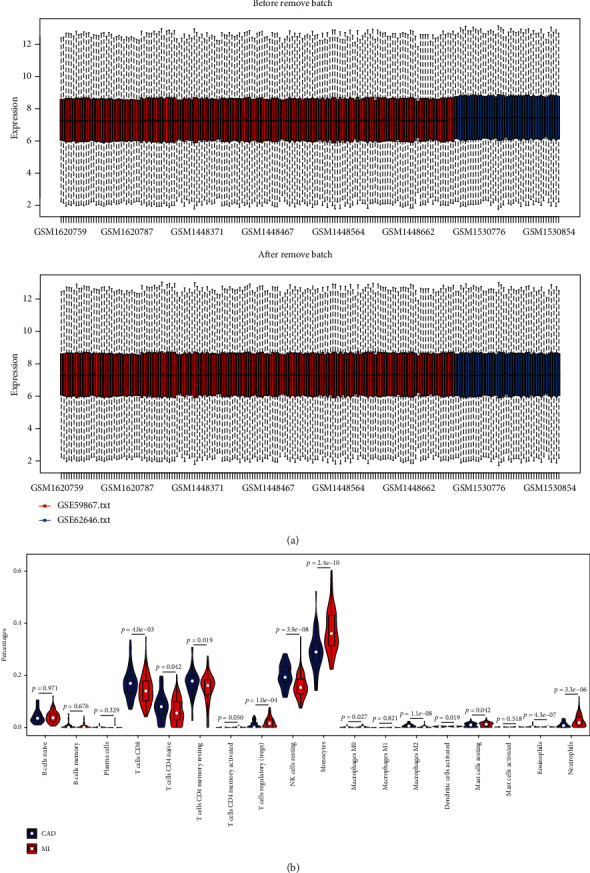
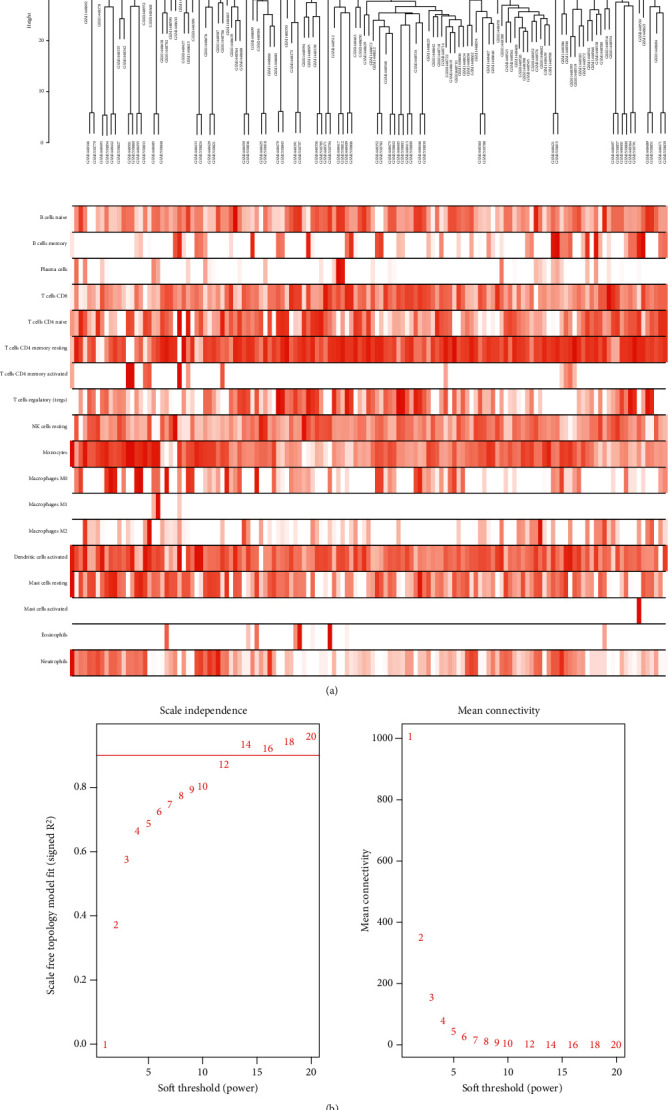
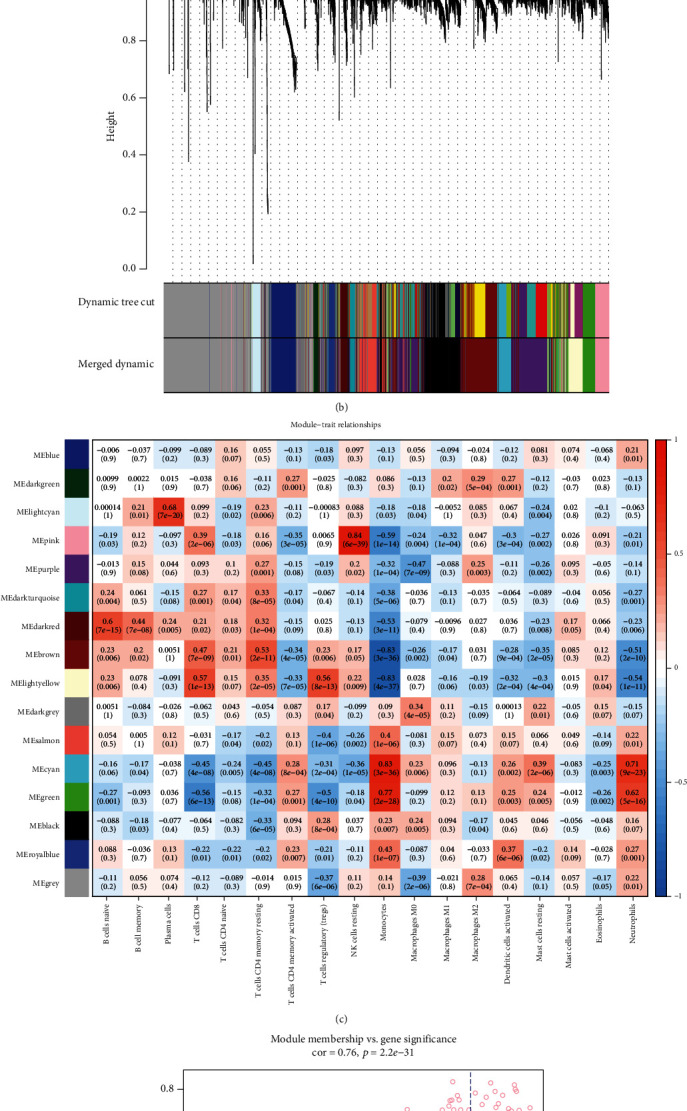
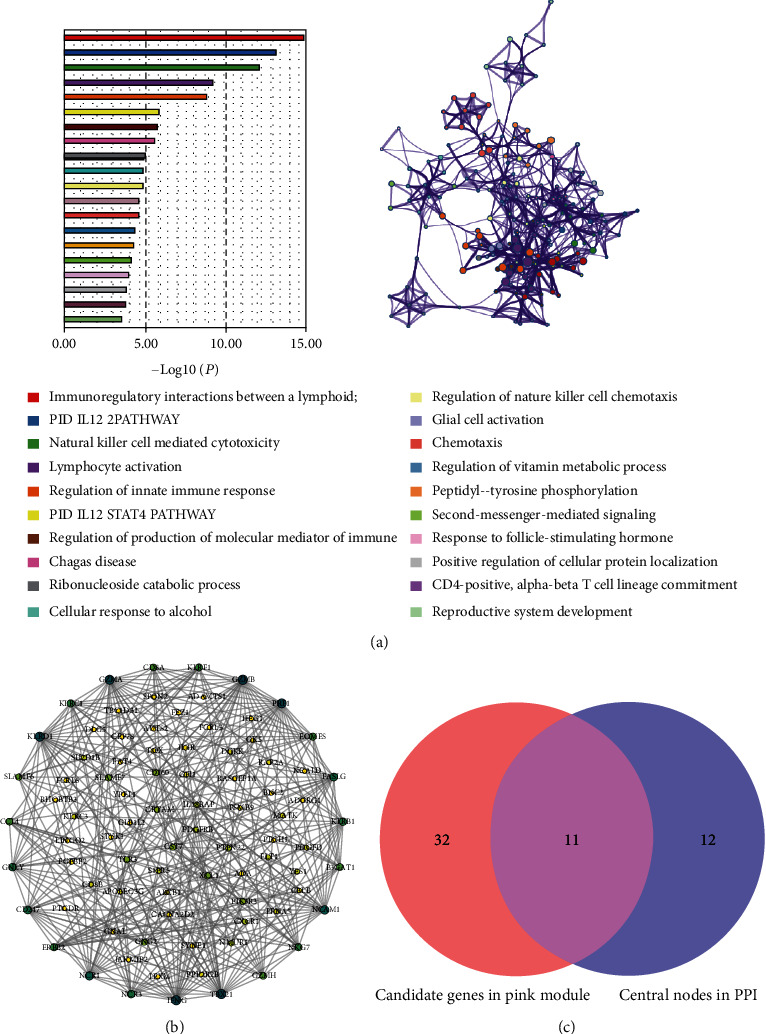
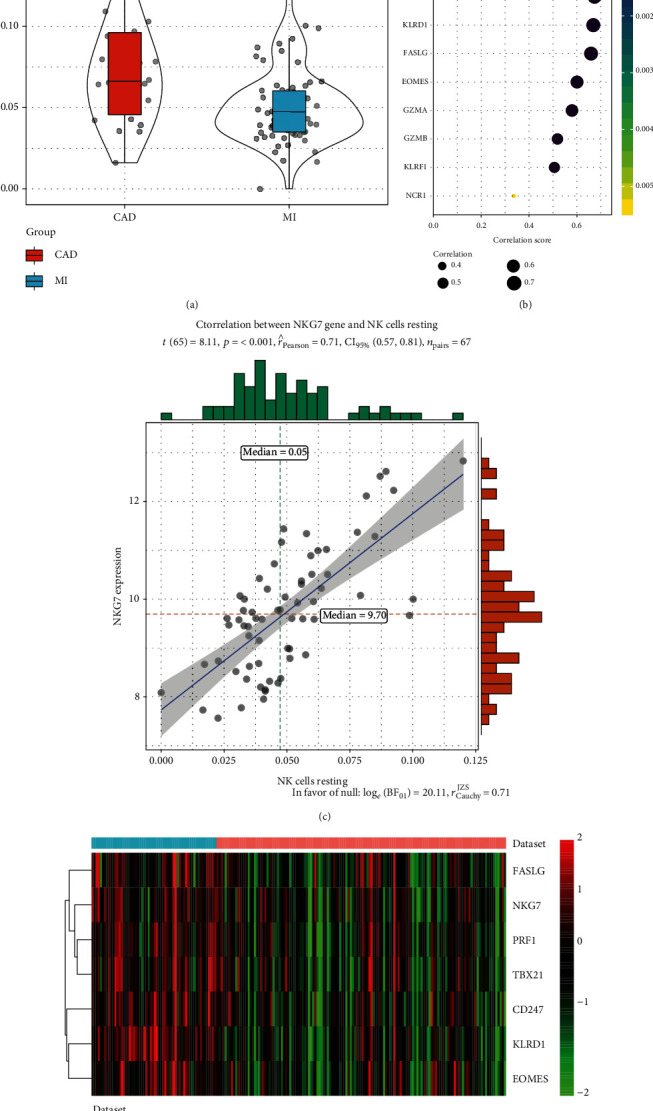
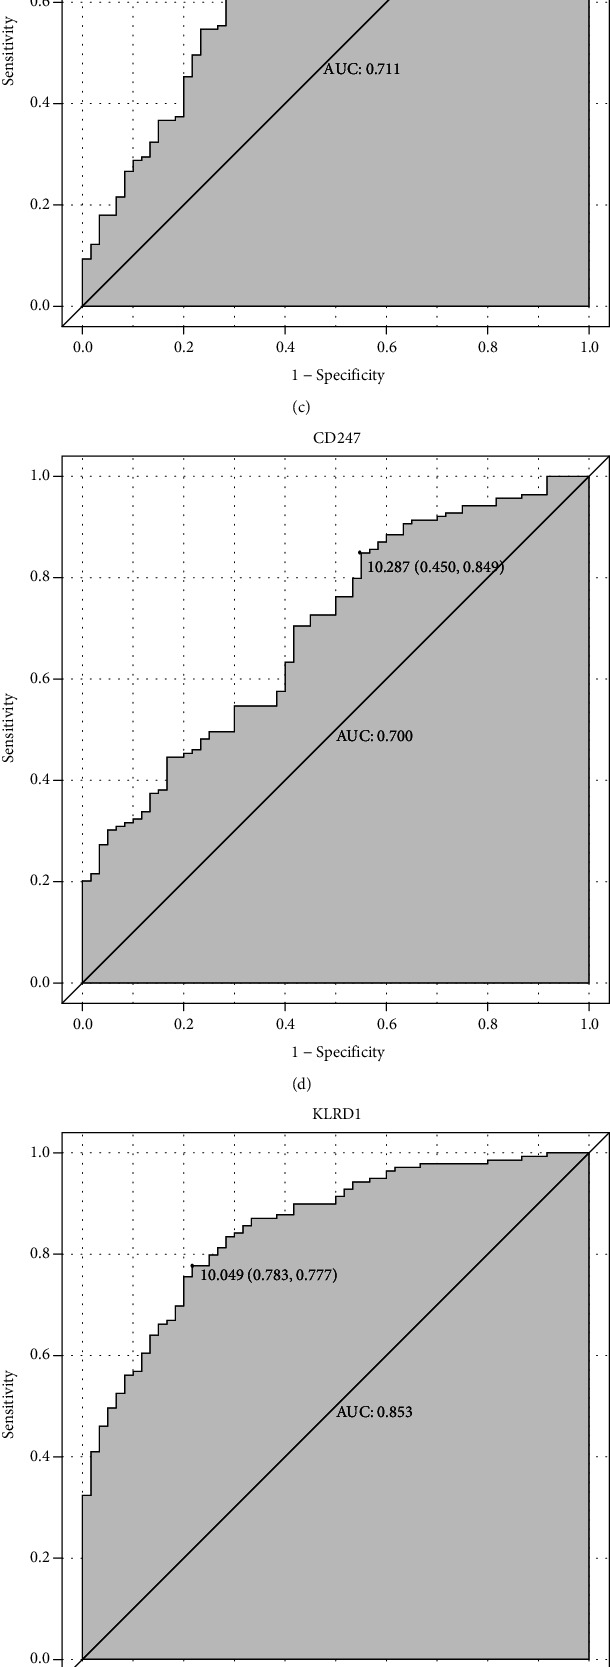
Methods: This study used the weighted gene coexpression network analysis (WGCNA) and the CIBERSORT algorithm to analyze the MI expression data from the Gene Expression Omnibus database and then identify the module associated with immune cell infiltration. In addition, we built the coexpression network and protein-protein interactions network analysis to identify the hub genes. Furthermore, the relationship between hub genes and NK cell resting was validated by using another dataset GSE123342. Finally, receiver operating characteristic (ROC) curve analyses were used to assess the diagnostic value of verified hub genes.
Results: Monocytes and neutrophils were markedly increased, and T cell CD8, T cell CD4 naive, T cell CD4 memory resting, and NK cell resting were significantly decreased in MI groups compared with stable coronary artery disease (CAD) groups. The WGCNA results showed that the pink model had the highest correlation with the NK cell resting infiltration level. We identified 11 hub genes whose expression correlated to the NK cell resting infiltration level, among which, 7 hub genes (NKG7, TBX21, PRF1, CD247, KLRD1, FASLG, and EOMES) were successfully validated in GSE123342. And these 7 genes had diagnostic value to distinguish MI and stable CAD.
Conclusions: NKG7, TBX21, PRF1, CD247, KLRD1, FASLG, and EOMES may be a diagnostic biomarker and therapeutic target associated with NK cell resting infiltration in MI.
Copyright © 2021 Lei Zhang et al.
Conflict of interest statement
The authors declare that they have no conflict of interest.
Figures
Similar articles
-
Bioinformatics-based Analysis and Verification of Chromatin Regulators and the Mechanism of Immune Infiltration Associated with Myocardial Infarction.Curr Med Chem. 2025;32(1):188-209. doi: 10.2174/0109298673265089231117054348. Curr Med Chem. 2025. PMID: 39354722
-
Systems biology-based analysis exploring shared biomarkers and pathogenesis of myocardial infarction combined with osteoarthritis.Front Immunol. 2024 Jul 17;15:1398990. doi: 10.3389/fimmu.2024.1398990. eCollection 2024. Front Immunol. 2024. PMID: 39086489 Free PMC article.
-
Identification of hub glycolysis-related genes in acute myocardial infarction and their correlation with immune infiltration using bioinformatics analysis.BMC Cardiovasc Disord. 2024 Jul 10;24(1):349. doi: 10.1186/s12872-024-03989-7. BMC Cardiovasc Disord. 2024. PMID: 38987688 Free PMC article.
-
Identification of Biomarkers Associated With CD8+ T Cells in Coronary Artery Disease and Their Pan-Cancer Analysis.Front Immunol. 2022 Jun 21;13:876616. doi: 10.3389/fimmu.2022.876616. eCollection 2022. Front Immunol. 2022. PMID: 35799780 Free PMC article.
-
Identification of gene expression profiles in myocardial infarction: a systematic review and meta-analysis.BMC Med Genomics. 2018 Nov 27;11(1):109. doi: 10.1186/s12920-018-0427-x. BMC Med Genomics. 2018. PMID: 30482209 Free PMC article.
Cited by
-
FASLG as a Key Member of Necroptosis Participats in Acute Myocardial Infarction by Regulating Immune Infiltration.Cardiol Res. 2024 Aug;15(4):262-274. doi: 10.14740/cr1652. Epub 2024 Jul 30. Cardiol Res. 2024. PMID: 39205966 Free PMC article.
-
Identification of an 11 immune-related gene signature as the novel biomarker for acute myocardial infarction diagnosis.Genes Immun. 2022 Nov;23(7):209-217. doi: 10.1038/s41435-022-00183-7. Epub 2022 Oct 1. Genes Immun. 2022. PMID: 36182975
-
Bioinformatics and Experimental Validation of Diagnostic Marker Genes for Myocardial Infarction and Analysis of Their Immune Cell Infiltration.Biochem Genet. 2025 Aug 19. doi: 10.1007/s10528-025-11211-2. Online ahead of print. Biochem Genet. 2025. PMID: 40828202
-
Identification of a novel hypermethylation marker, ZSCAN18, and construction of a diagnostic model in cervical cancer.Clin Transl Oncol. 2025 Aug;27(8):3346-3363. doi: 10.1007/s12094-025-03864-7. Epub 2025 Feb 19. Clin Transl Oncol. 2025. PMID: 39969762
-
Machine Learning in Identifying Marker Genes for Congenital Heart Diseases of Different Cardiac Cell Types.Life (Basel). 2024 Aug 19;14(8):1032. doi: 10.3390/life14081032. Life (Basel). 2024. PMID: 39202774 Free PMC article.
References
MeSH terms
Substances
LinkOut - more resources
Full Text Sources
Medical
Research Materials
Miscellaneous
