

Construction of the circRNA-miRNA-mRNA Regulatory Network of an Abdominal Aortic Aneurysm to Explore Its Potential Pathogenesis
- PMID: 34777635
- PMCID: PMC8589483
- DOI: 10.1155/2021/9916881
Construction of the circRNA-miRNA-mRNA Regulatory Network of an Abdominal Aortic Aneurysm to Explore Its Potential Pathogenesis
Abstract
Background: Abdominal aortic aneurysm (AAA) is a progressive cardiovascular disease, which is a permanent and localized dilatation of the abdominal aorta with potentially fatal consequence of aortic rupture. Dysregulation of circRNAs is correlated with the development of various pathological events in cardiovascular diseases. However, the function of circRNAs in abdominal aortic aneurysm (AAA) is unknown and remains to be explored. This study is aimed at determining the regulatory mechanisms of circRNAs in AAAs. This study was aimed at exploring the underlying molecular mechanisms of abdominal aortic aneurysms based on the competing endogenous RNA (ceRNA) regulatory hypothesis of circRNA, miRNA, and mRNA.
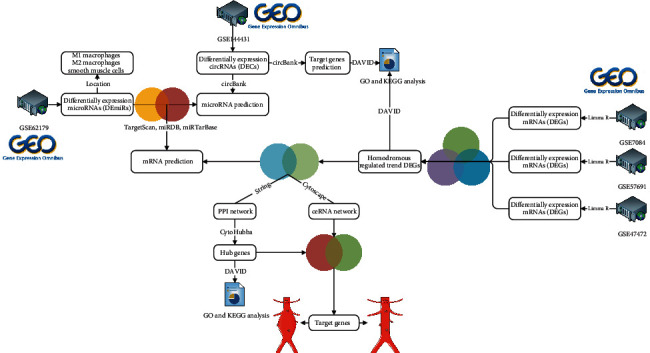
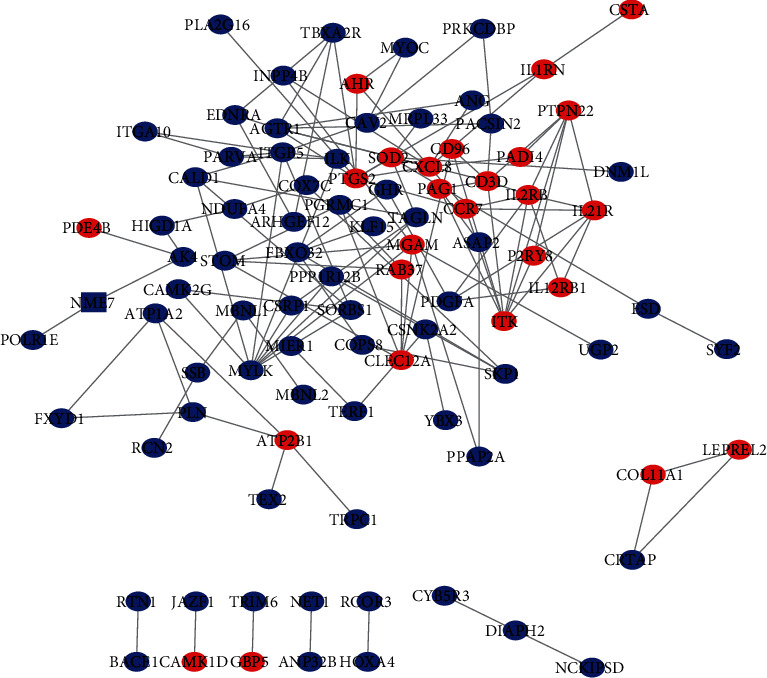
Methods: The expression profiles of circRNAs (GSE144431), miRNAs (GSE62179), and mRNAs (GSE7084, GSE57691, and GSE47472) in human tissue sample from the aneurysm group and normal group were obtained from the Gene Expression Omnibus database, respectively. The circRNA-miRNA-mRNA network was constructed by using Cytoscape 3.7.2 software; then, the protein-protein interaction (PPI) network was constructed by using the STRING database, and the hub genes were identified by using the cytoHubba plug-in. The circRNA-miRNA-hub gene regulatory subnetwork was formed to understand the regulatory axis of hub genes in AAAs.
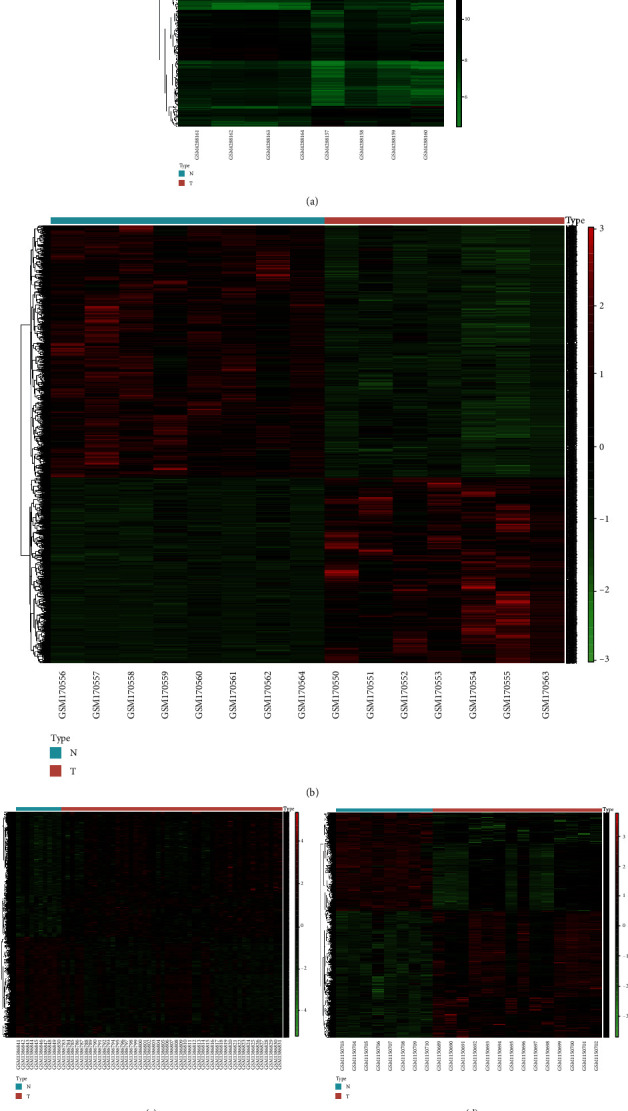
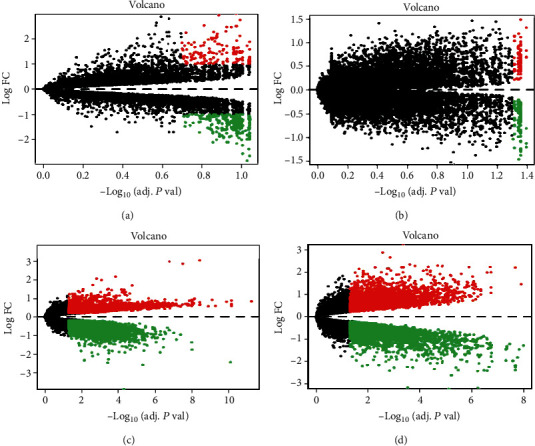
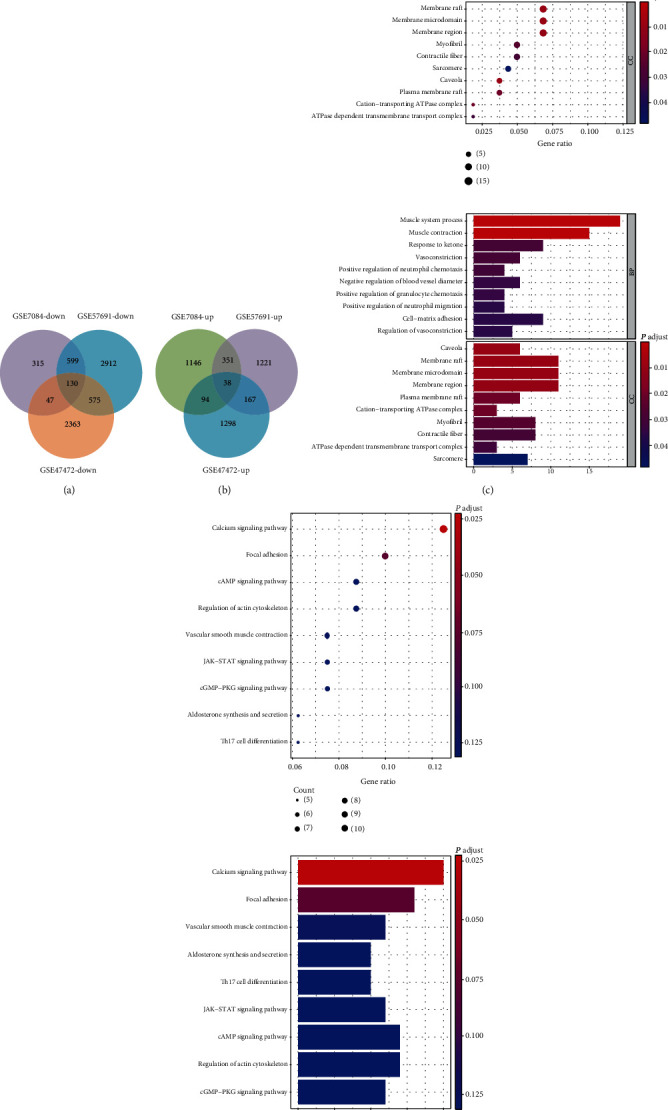
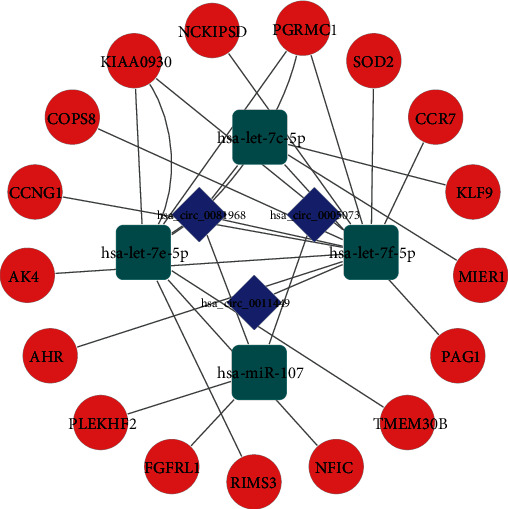
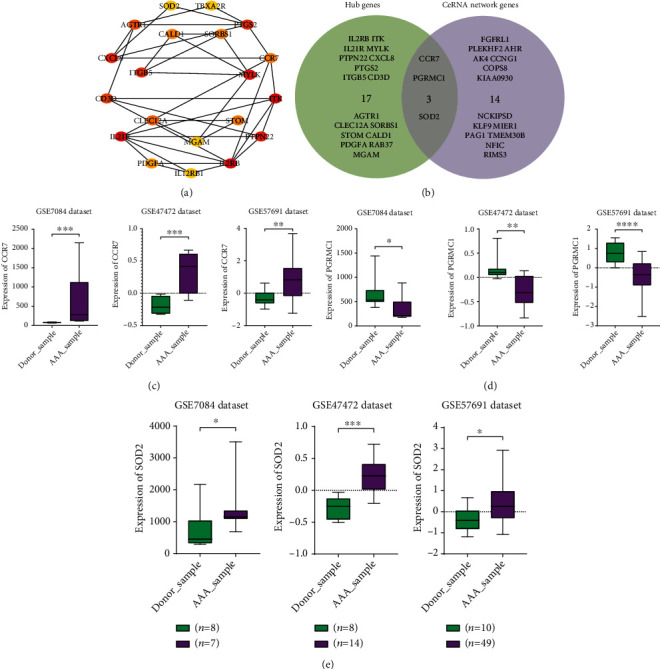
Results: The present study identified 40 differentially expressed circRNAs (DECs) in the GSE144431, 90 differentially expressed miRNAs (DEmiRs) in the GSE62179, and 168 differentially expressed mRNAs (DEGs) with the same direction regulation (130 downregulated and 38 upregulated) in the GSE7084, GSE57691, and GSE47472 datasets identified regarding AAAs. The miRNA response elements (MREs) of three DECs were then predicted. Four overlapping miRNAs were obtained by intersecting the predicted miRNA and DEmiRs. Then, 17 overlapping mRNAs were obtained by intersecting the predicted target mRNAs of 4 miRNAs with 168 DEGs. Furthermore, the circRNA-miRNA-mRNA network was constructed through 3 circRNAs, 4 miRNAs, and 17 mRNAs, and three hub genes (SOD2, CCR7, and PGRMC1) were identified. Simultaneously, functional enrichment and pathway analysis were performed within genes in the circRNA-miRNA-mRNA network. Three of them (SOD2, CCR7, and PGRMC1) were suggested to be crucial based on functional enrichment, protein-protein interaction, and ceRNA network analysis. Furthermore, the expression of SOD2 and CCR7 may be regulated by hsa_circ_0011449/hsa_circ_0081968/hsa-let-7f-5p; the expression of PGRMC1 may be regulated by hsa_circ_0011449/hsa_circ_0081968-hsa-let-7f-5p/hsa-let-7e-5p.
Conclusion: In conclusion, the ceRNA interaction axis we identified may be an important target for the treatment of abdominal aortic aneurysms. This study provided further understanding of the potential pathogenesis from the perspective of the circRNA-related competitive endogenous RNA network in AAAs.
Copyright © 2021 Hao Zhang et al.
Conflict of interest statement
The authors declare that there is no conflict of interest regarding the publication of this paper.
Figures
References
-
- Upchurch G. R., Jr., Schaub T. A. Abdominal aortic aneurysm. American Family Physician . 2006;73:1198–1204. - PubMed
MeSH terms
Substances
LinkOut - more resources
Full Text Sources
