

Genetically-targeted photorelease of endocannabinoids enables optical control of GPR55 in pancreatic β-cells
- PMID: 34777770
- PMCID: PMC8528030
- DOI: 10.1039/d1sc02527a
Genetically-targeted photorelease of endocannabinoids enables optical control of GPR55 in pancreatic β-cells
Abstract
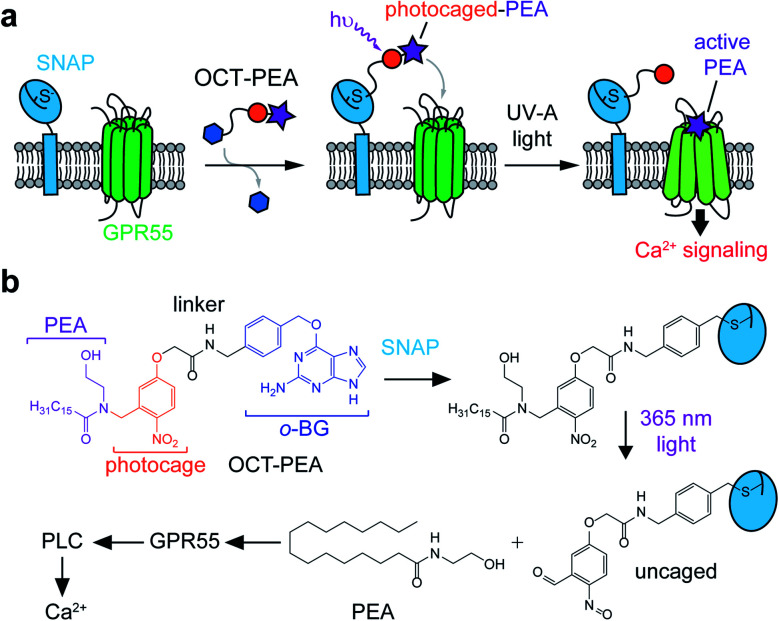
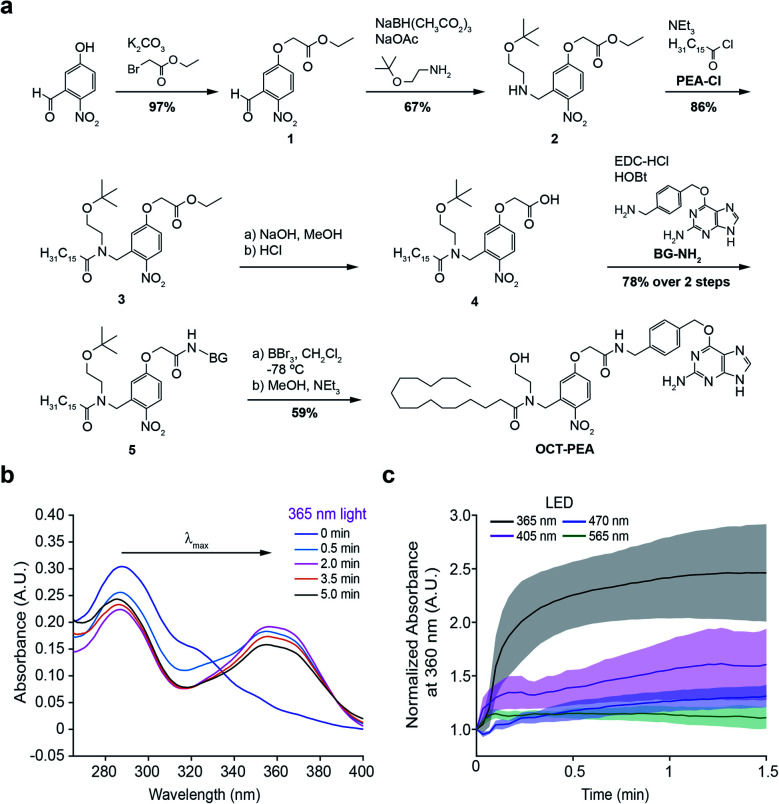
Fatty acid amides (FAAs) are a family of second-messenger lipids that target cannabinoid receptors, and are known mediators of glucose-stimulated insulin secretion from pancreatic β-cells. Due to the diversity observed in FAA structure and pharmacology, coupled with the expression of at least 3 different cannabinoid G protein-coupled receptors in primary and model β-cells, our understanding of their role is limited by our inability to control their actions in time and space. To investigate the mechanisms by which FAAs regulate β-cell excitability, we developed the Optically-Cleavable Targeted (OCT)-ligand approach, which combines the spatial resolution of self-labeling protein (SNAP-) tags with the temporal control of photocaged ligands. By linking a photocaged FAA to an o-benzylguanine (BG) motif, FAA signalling can be directed towards genetically-defined cellular membranes. We designed a probe to release palmitoylethanolamide (PEA), a GPR55 agonist known to stimulate glucose-stimulated insulin secretion (GSIS). When applied to β-cells, OCT-PEA revealed that plasma membrane GPR55 stimulates β-cell Ca2+ activity via phospholipase C. Moving forward, the OCT-ligand approach can be translated to other ligands and receptors, and will open up new experimental possibilities in targeted pharmacology.
This journal is © The Royal Society of Chemistry.
Conflict of interest statement
There are no conflicts to declare.
Figures
Similar articles
-
Evaluation of the insulin releasing and antihyperglycaemic activities of GPR55 lipid agonists using clonal beta-cells, isolated pancreatic islets and mice.Br J Pharmacol. 2013 Nov;170(5):978-90. doi: 10.1111/bph.12356. Br J Pharmacol. 2013. PMID: 23992544 Free PMC article.
-
The cannabinoid ligands SR141716A and AM251 enhance human and mouse islet function via GPR55-independent signalling.Cell Mol Life Sci. 2020 Nov;77(22):4709-4723. doi: 10.1007/s00018-019-03433-6. Epub 2020 Jan 10. Cell Mol Life Sci. 2020. PMID: 31925452 Free PMC article.
-
CRISPR/Cas9 gene editing demonstrates metabolic importance of GPR55 in the modulation of GIP release and pancreatic beta cell function.Peptides. 2020 Mar;125:170251. doi: 10.1016/j.peptides.2019.170251. Epub 2020 Jan 7. Peptides. 2020. PMID: 31923454
-
GPR119 and GPR55 as Receptors for Fatty Acid Ethanolamides, Oleoylethanolamide and Palmitoylethanolamide.Int J Mol Sci. 2021 Jan 21;22(3):1034. doi: 10.3390/ijms22031034. Int J Mol Sci. 2021. PMID: 33494185 Free PMC article. Review.
-
Skeletal lipidomics: regulation of bone metabolism by fatty acid amide family.Br J Pharmacol. 2011 Aug;163(7):1441-6. doi: 10.1111/j.1476-5381.2011.01474.x. Br J Pharmacol. 2011. PMID: 21557736 Free PMC article. Review.
Cited by
-
Chemical Probes to Control and Visualize Lipid Metabolism in the Brain.Acc Chem Res. 2022 Nov 15;55(22):3205-3217. doi: 10.1021/acs.accounts.2c00521. Epub 2022 Oct 25. Acc Chem Res. 2022. PMID: 36283077 Free PMC article. Review.
-
Projection-targeted photopharmacology reveals distinct anxiolytic roles for presynaptic mGluR2 in prefrontal- and insula-amygdala synapses.Neuron. 2025 Mar 19;113(6):912-930.e6. doi: 10.1016/j.neuron.2025.01.002. Epub 2025 Jan 28. Neuron. 2025. PMID: 39879977
-
The Road to Quantitative Lipid Biochemistry in Living Cells.Acc Chem Res. 2023 Apr 4;56(7):810-820. doi: 10.1021/acs.accounts.2c00804. Epub 2023 Mar 21. Acc Chem Res. 2023. PMID: 36943016 Free PMC article.
-
Optical Approaches for Investigating Neuromodulation and G Protein-Coupled Receptor Signaling.Pharmacol Rev. 2023 Nov;75(6):1119-1139. doi: 10.1124/pharmrev.122.000584. Epub 2023 Jul 10. Pharmacol Rev. 2023. PMID: 37429736 Free PMC article. Review.
-
Chemical Tools for Lipid Cell Biology.Acc Chem Res. 2023 May 16;56(10):1168-1177. doi: 10.1021/acs.accounts.2c00851. Epub 2023 Apr 28. Acc Chem Res. 2023. PMID: 37116885 Free PMC article.
References
-
- Pertwee R. G. Pharmacol. Ther. 1997;74:129–180. - PubMed
LinkOut - more resources
Full Text Sources
Research Materials
Miscellaneous