. 2021 Nov 5;11(21):13530-13542.
doi: 10.1021/acscatal.1c03465. Epub 2021 Oct 25.

Processive Enzymes Kept on a Leash: How Cellulase Activity in Multienzyme Complexes Directs Nanoscale Deconstruction of Cellulose

Affiliations

Processive Enzymes Kept on a Leash: How Cellulase Activity in Multienzyme Complexes Directs Nanoscale Deconstruction of Cellulose

Krisztina Zajki-Zechmeister et al. ACS Catal. .

Abstract

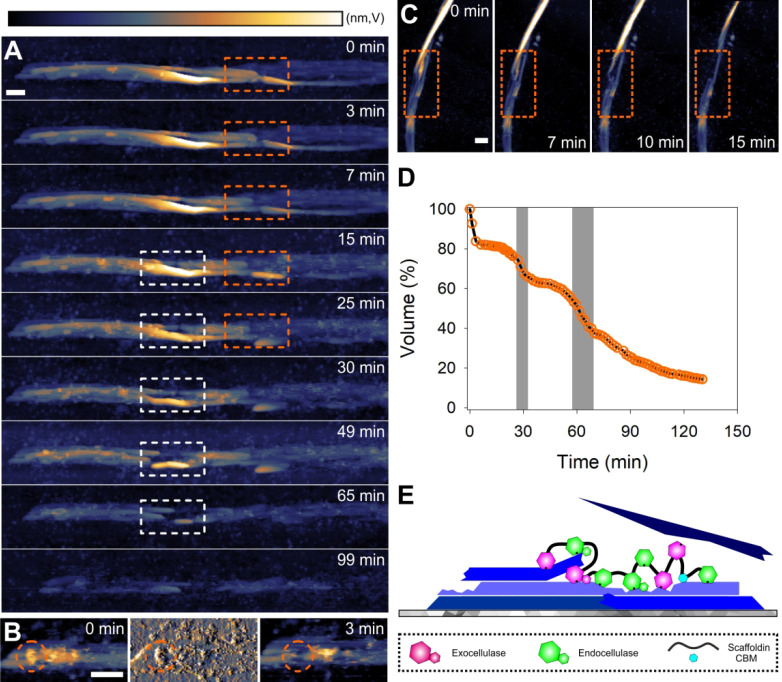
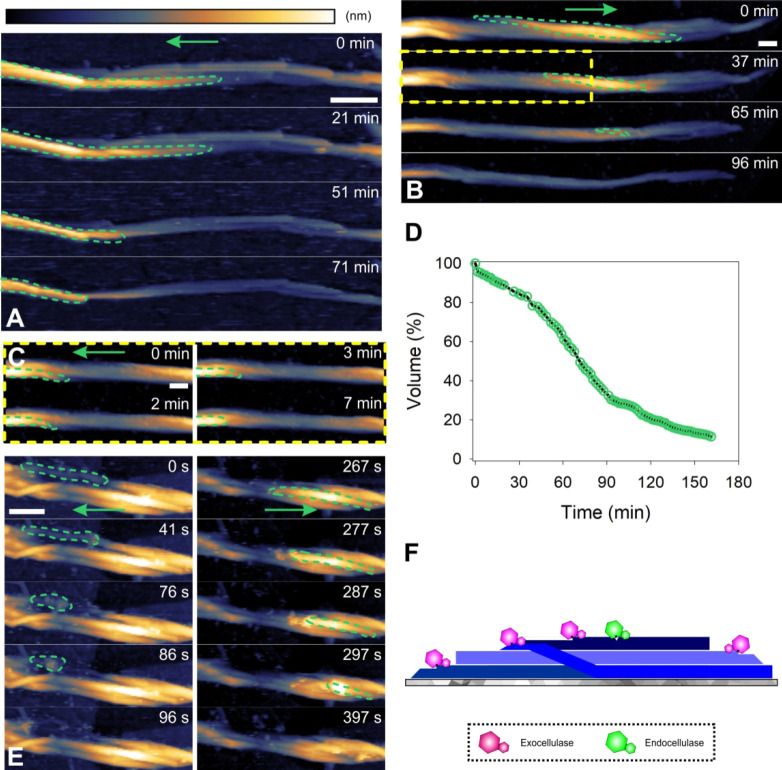
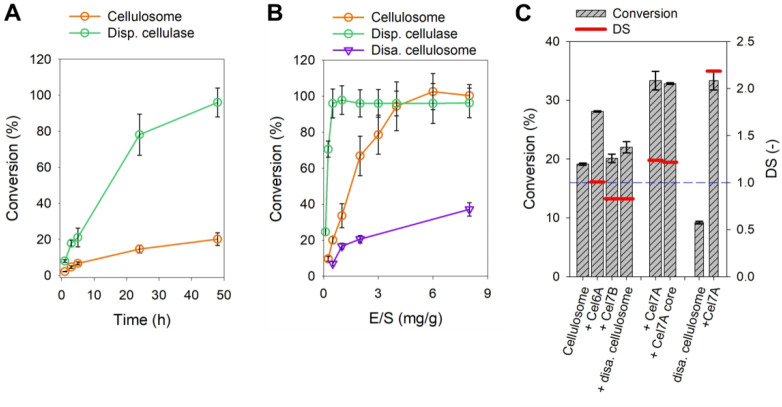
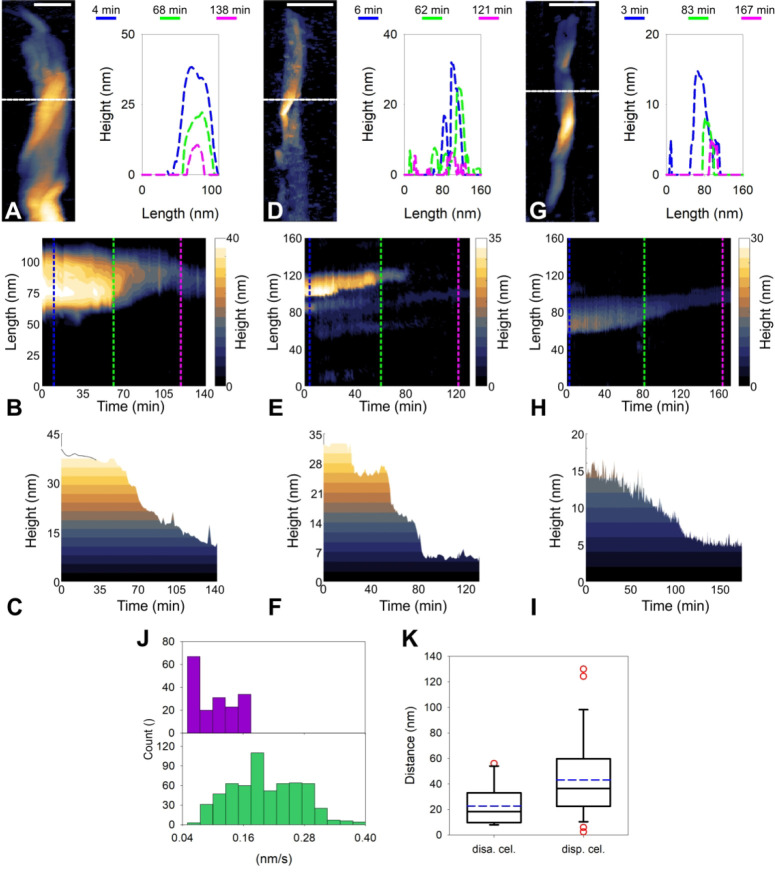
Biological deconstruction of polymer materials gains efficiency from the spatiotemporally coordinated action of enzymes with synergetic function in polymer chain depolymerization. To perpetuate enzyme synergy on a solid substrate undergoing deconstruction, the overall attack must alternate between focusing the individual enzymes locally and dissipating them again to other surface sites. Natural cellulases working as multienzyme complexes assembled on a scaffold protein (the cellulosome) maximize the effect of local concentration yet restrain the dispersion of individual enzymes. Here, with evidence from real-time atomic force microscopy to track nanoscale deconstruction of single cellulose fibers, we show that the cellulosome forces the fiber degradation into the transversal direction, to produce smaller fragments from multiple local attacks ("cuts"). Noncomplexed enzymes, as in fungal cellulases or obtained by dissociating the cellulosome, release the confining force so that fiber degradation proceeds laterally, observed as directed ablation of surface fibrils and leading to whole fiber "thinning". Processive cellulases that are enabled to freely disperse evoke the lateral degradation and determine its efficiency. Our results suggest that among natural cellulases, the dispersed enzymes are more generally and globally effective in depolymerization, while the cellulosome represents a specialized, fiber-fragmenting machinery.


Conflict of interest statement

The authors declare no competing financial interest.

Figures

Figure 1
Figure 1
AFM characterization of bacterial cellulose. (A, B) AFM height image of (A) multiple fibers adsorbed on HOPG and (B) an isolated fiber bundle showing multiple twists (encircled in green) and an unwound region (encircled in white). An expanded view on the highlighted areas (colored rectangles) in panel A is shown in panel E. (C, D) AFM height (left) and phase images (right) of a close-up region of the fiber to reveal the fibrillar substructure. In panel C, some fibrils exhibit dislocations (lower-left blue arrow) or end internally (upper-right blue arrow). In panel D, a regular pattern of structural defects (less well-ordered regions of the cellulose, seen as darker areas in the phase images) is identified. These defects occur even in the absence of a discernible feature in the height channel (pink circle). Their regular spacing suggests structural connection with the fiber twist. (E) Peak force tapping also confirmed a somewhat regular alternating appearance of nanodomains with higher/lower deformation under force load. The upper left image is a zoomed and rescaled height image (taken from panel A) to allow an easier viewing. Note that calibration for peak force was performed on HOPG. (F) Schematic representation of a fiber adsorbed on HOPG. Scale bars are 250 nm (A, B) and 100 nm (C, D, E). The false color scales used throughout the images are shown in panel A. Height (nm), phase (deg), and deformation (nm) ranges were 42 nm (A), 45 nm (B), 80 nm/16° (C), 15 nm/24° (D), 10 nm/3 nm deformation (E, upper panel), and 15 nm deformation (E, lower panel).
Figure 2
Figure 2
Cellulose fiber deconstruction by the cellulosome. (A) Time-lapse AFM height images taken from Movie S1 showing fiber deconstruction by the cellulosome to proceed via localized cuts into fibrils (framed in orange and white) that destabilize the overall fiber architecture and lead to whole fiber fragmentation. (B) AFM height (left, right) and amplitude (center) images taken from Movie S1 showing a single cellulosome (circled in orange) adsorbed on a cellulose fibril. After its dissociation, the cellulosome leaves behind a cavity (also circled in orange) due to the material removed underneath. (C) Time-lapse AFM height images taken from Movie S2 showing that fibrils attacked by cellulosomes can become “mobile” due to release from the fibril composite (indicated by a distorted shape, orange rectangle) and are subsequently removed by the AFM tip, with details shown in Movie S2. (D) Time course of volume loss during fiber degradation by the cellulosome (prominent steps are highlighted in gray). (E) Schematic representation of cellulosomal fiber deconstruction. Scale bars are 50 nm. The false color scale used throughout the images is shown in panel A. Height (nm) and amplitude (V) ranges were 30 nm (A), 15 nm/5 V (B), and 40 nm (C).
Figure 3
Figure 3
Cellulose fiber deconstruction by dispersed cellulases. (A, B, C) Time-lapse AFM height images taken from Movies S3 (A) and S4 (B, C) showing fiber deconstruction (green frame) by free cellulases to proceed via longitudinal thinning, due to directed ablation of surface fibrils (indicated with arrows). An expanded view on the highlighted area (yellow rectangle) in panel B is shown in panel C. Different fibrils from the same fiber in panels B and C are degraded in opposite direction. (D) Time course of volume loss during fiber degradation by dispersed cellulases. (E) The pattern, that individual fibrils are degraded unidirectionally but different fibrils can be degraded in opposite direction of the fiber’s length axis, remains in experiments with purified enzymes (Cel7A, Cel7B) but lacking the alternate cellobiohydrolase Cel6A. (F) Schematic representation of fiber deconstruction by dispersed cellulases. Scale bars are 50 nm. The false color scale used throughout the images is shown in panel A. Height (nm) range was 42 nm (A, B), 18 nm (C), and 18 nm (E).
Figure 4
Figure 4
Cellulose fiber deconstruction by a noncomplexed (disassembled) cellulosome. (A, B, C) Time-lapse AFM height images taken from Movies S5 (A, B) and S6 (C) showing fiber deconstruction (purple frames/arrows) by disassembled cellulosomal cellulases to proceed similar as observed for naturally dispersed cellulases. Degradation occurs via ablation of surface fibrils (A, B) by mostly isolated enzymes (white arrow) and thinning/ablation (C). (D) Time course of volume loss during fiber degradation by the disassembled cellulosome. Note that the shown graph starts at about 60 min after an instable fiber on top is torn away (see Movie S6). The full time course is shown in the inset, and the presented time period is underlaid in gray. Scale bars are 100 nm. The false color scales used throughout the images is shown in panel A. Height (nm) range was 12 nm (A, C) and 14 nm (B).
Figure 5
Figure 5
Cellulose hydrolysis by dispersed and complexed cellulases. The conversion was calculated on the basis of the amount of liberated glucose. If not stated otherwise, substrate concentration, temperature, and enzyme loading were 1.0 g/L, 55 °C, and 0.5 mg/g, respectively. (A) Hydrolysis time course of bacterial cellulose using either complexed (cellulosome) or dispersed cellulases. (B) Conversion after 48 h using various loadings of cellulosome, dispersed cellulases, and disassembled cellulosomes. (C) Synergy between the cellulosome and individual dispersed cellulases after 24 h. The cellulosome was present at 1.0 μg/mL and supplemented with either Cel6A (0.5 μg/mL), Cel7B (0.5 μg/mL), disassembled cellulosome (0.4 μg/mL), Cel7A (0.5 μg/mL), or the Cel7A core protein (1.0 μg/mL). The disassembled cellulosome (0.8 μg/mL) was supplemented with Cel7A (0.5 μg/mL).
Figure 6
Figure 6
Local degradation efficiency of dispersed and complexed cellulases. Local deconstruction as performed by dispersed cellulases (A, B, C), the cellulosome (D, E, F), and disassembled cellulosomes (G, H, I). (A, D, G) AFM height images were used to select a pixel row (white dashed line) and track the height profiles over time (left). Exemplary height profiles are shown at the beginning, in the middle, and toward the end of the respective degradation process in the corresponding panels (right). (B, E, H) The height progression over time is plotted in a top down perspective allowing a continuous tracking of the time-dependent local changes in fiber height, width, and surface structure. (C, F, I) The maximal height values per pixel row (taken from B, E, H) and time point were used to construct these plots and calculate the mean height per time step size for every pixel row resulted in a distribution of degradation speeds as shown in panel J. (J) Mean degradation velocity measured for dispersed cellulases (green bars) and the disassembled cellulosome (purple bars), respectively. (K) Average processive distance by the disassembled cellulosomes (N = 14) and dispersed cellulases (N = 30). Median and mean are shown as solid black and dashed blue lines, respectively. Scale bars are 100 nm (A, D, G).

Similar articles

Cited by

References

    1. Ragauskas A. J.; Williams C. K.; Davison B. H.; Britovsek G.; Cairney J.; Eckert C. A.; Frederick W. J. Jr; Hallett J. P.; Leak D. J.; Liotta C. L.; Mielenz J. R.; Murphy R.; Templer R.; Tschaplinski T. The path forward for biofuels and biomaterials. Science 2006, 311, 484–489. 10.1126/science.1114736. - DOI - PubMed
    1. Liao Y.; Koelewijn S. F.; van den Bossche G.; van Aelst J.; van den Bosch S.; Renders T.; Navare K.; Nicolaï T.; van Aelst K.; Maesen M.; Matsushima H.; Thevelein J. M.; van Acker K.; Lagrain B.; Verboekend D.; Sels B. F. A sustainable wood biorefinery for low-carbon footprint chemicals production. Science 2020, 367, 1385–1390. 10.1126/science.aau1567. - DOI - PubMed
    1. Alonso D. M.; Hakim S. H.; Zhou S.; Won W.; Hosseinaei O.; Tao J.; Garcia-Negron V.; Motagamwala A. H.; Mellmer M. A.; Huang K.; Houtman C. J.; Labbé N.; Harper D. P.; Maravelias C. T.; Runge T.; Dumesic J. A. Increasing the revenue from lignocellulosic biomass: maximizing feedstock utilization. Sci. Adv. 2017, 3, e160330110.1126/sciadv.1603301. - DOI - PMC - PubMed
    1. Shahab R. L.; Brethauer S.; Davey M. P.; Smith A. G.; Vignolini S.; Luterbacher J. S.; Studer M. H. A heterogeneous microbial consortium producing short-chain fatty acids from lignocellulose. Science 2020, 369, eabb1214.10.1126/science.abb1214. - DOI - PubMed
    1. Chundawat S. P. S.; Beckham G. T.; Himmel M. E.; Dale B. E. Deconstruction of lignocellulosic biomass to fuels and chemicals. Annu. Rev. Chem. Biomol. Eng. 2011, 2, 121–145. 10.1146/annurev-chembioeng-061010-114205. - DOI - PubMed