

Intestinal Microbiota and Gene Expression Reveal Similarity and Dissimilarity Between Immune-Mediated Colitis and Ulcerative Colitis
- PMID: 34778085
- PMCID: PMC8578892
- DOI: 10.3389/fonc.2021.763468
Intestinal Microbiota and Gene Expression Reveal Similarity and Dissimilarity Between Immune-Mediated Colitis and Ulcerative Colitis
Abstract
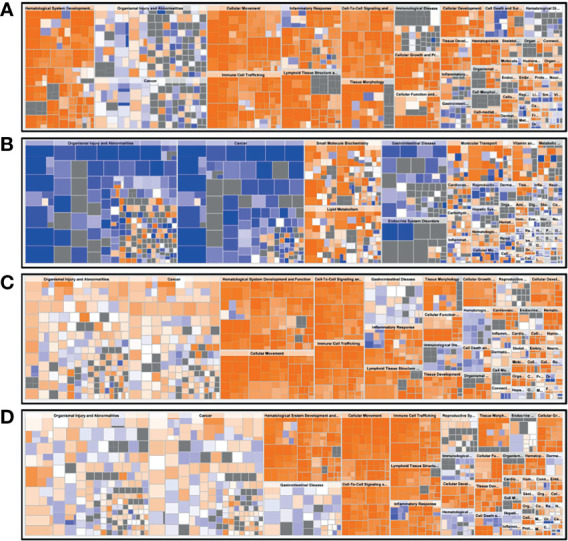
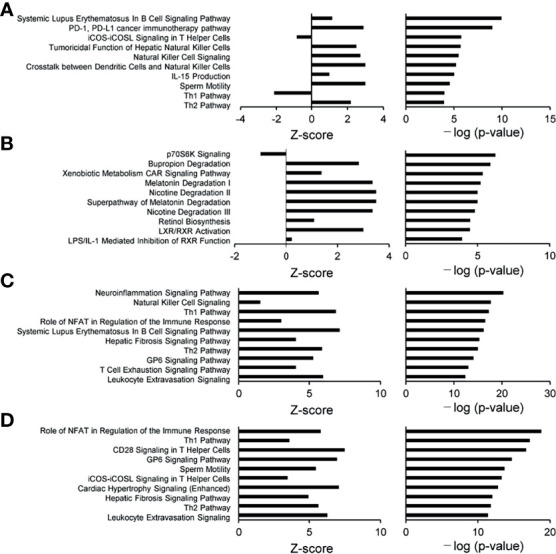
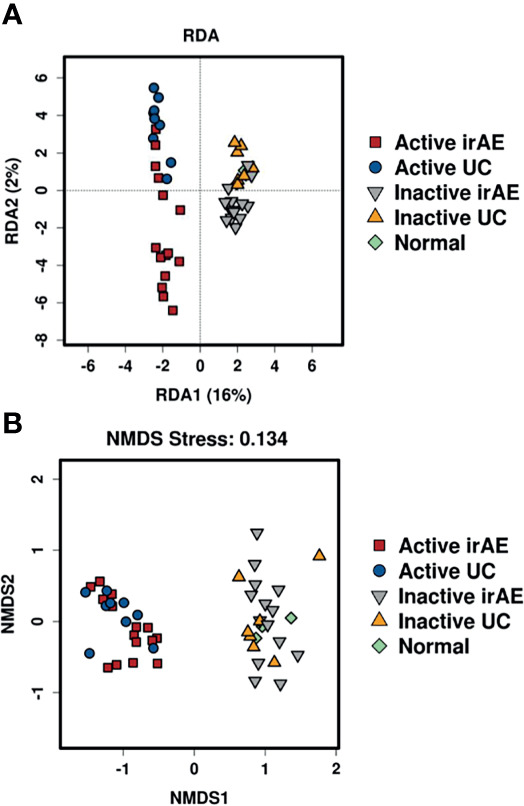
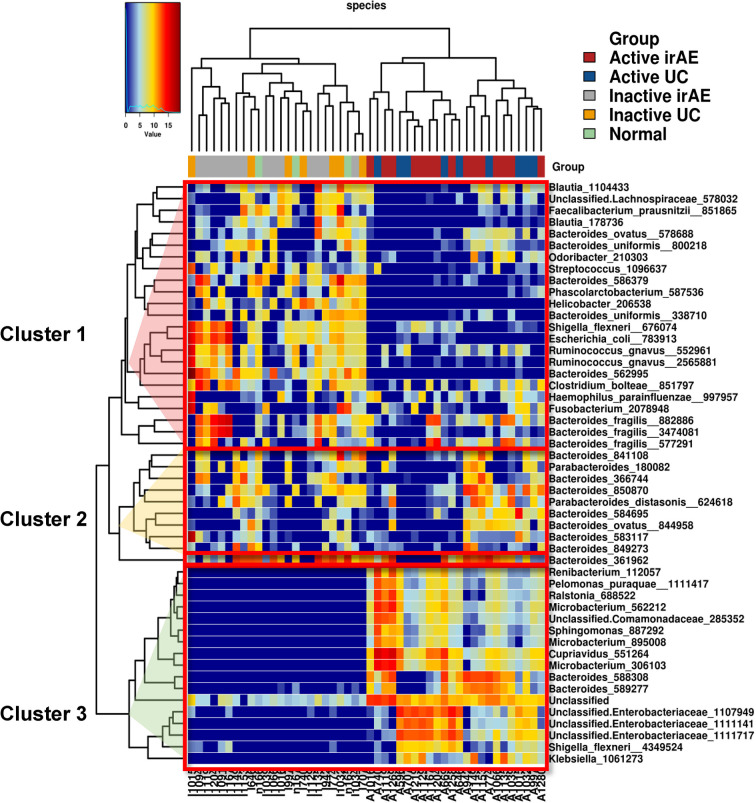
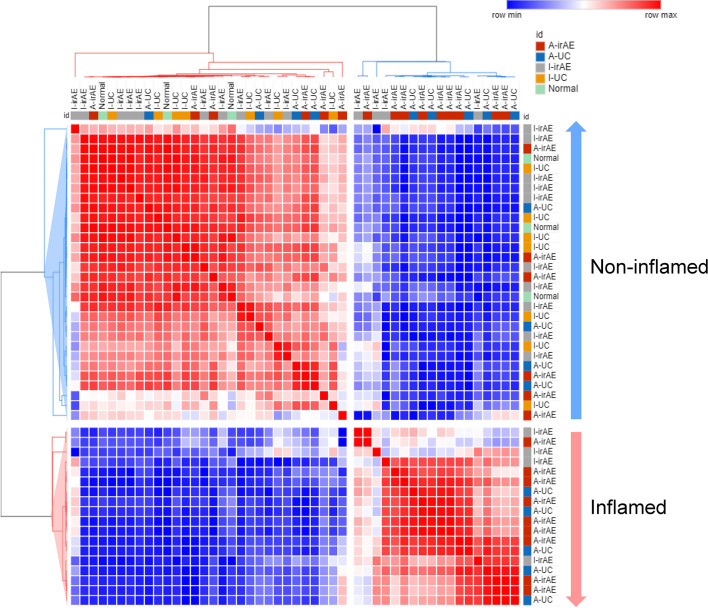
Immune checkpoint inhibitors (ICIs) have become the standard of care for several cancers. However, ICI therapy has also been associated with various immune-related adverse events (irAEs). Clinical manifestations of immune-related colitis resemble those of inflammatory bowel diseases such as ulcerative colitis (UC). The composition of the bowel microflora is thought to influence the development of inflammatory bowel disease and irAE colitis. We profiled the gene expressions and microbe compositions of colonic mucosa from patients with solid cancers receiving anti-PD-L1 antibody treatment; we then compared the expression profiles associated with irAE colitis with those associated with UC. The pathway enrichment analysis revealed functional similarities between inflamed regions of irAE colitis and UC. The common enriched pathways included leukocyte extravasation and immune responses, whereas non-inflamed mucosa from patients with irAE colitis was distinct from patients with UC and was characterized by the recruitment of immune cells. A similarity between the microbiota profiles was also identified. A decreased abundance of Bacteroides species was observed in inflamed regions from both irAE colitis and UC based on a microbiota composition analysis of 16S rDNA sequencing. Pathways associated with molecule transport systems, including fatty acids, were enriched in inflamed and non-inflamed irAE colitis and inflamed UC, similar to Piphillin-inferred KEGG pathways. While UC is characterized by local regions of inflammation, ICI treatment extends to non-inflammatory regions of the colonial mucosa where immune cells are reconstituted. This analysis of the similarity and heterogeneity of irAE colitis and UC provides important information for the management of irAE colitis.
Keywords: gene expression; immune-checkpoint inhibitor; immune-related adverse event; microbiota; pathway enrichment analysis; ulcerative colitis.
Copyright © 2021 Sakai, Sakurai, De Velasco, Nagai, Chikugo, Ueshima, Kura, Takahama, Hayashi, Nakagawa, Kudo and Nishio.
Conflict of interest statement
KS reports personal fees from Roche Diagnostics, Bio‐Rad, SRL Diagnostics, AstraZeneca, Chugai Pharmaceutical outside the submitted work. KU has received personal fees and honoraria from Eisai. HH reported grants from the Japan Agency for Medical Research and Development during the conduct of the study and grants and personal fees from AstraZeneca, Boehringer Ingelheim Japan Inc, Chugai Pharmaceutical, Ono Pharmaceutical, and Bristol-Myers Squibb and personal fees from Eli Lilly Japan, Kyorin Pharmaceutical, Merck Biopharma, MSD, Novartis, Pfizer Japan, Shanghai Haihe Biopharma, and Taiho Pharmaceutical outside the submitted work. KNa reports grants from Novartis, Boehringer Ingelheim, Pfizer, Takeda, SymBio Pharmaceuticals, Kyorin Pharmaceutical, CareNet, Nichi-Iko Pharmaceutical, Daiichi-Sankyo, Hisamitsu Pharmaceutical, Yodosha, Clinical Trial, Medicus Shuppan Publishers, Ayumi Pharmaceutical, Nikkei Business Publications, Thermo Fisher Scientific, Nanzando, Medical Review, Yomiuri Telecasting, Reno Medical, MSD, Eli Lilly, Bristol-Myers Squibb, Taiho Pharmaceutical, Ono Pharmaceutical, Chugai Pharmaceutical, AstraZeneca, Astellas, and grants from Novartis, Boehringer Ingelheim, Pfizer, Takeda, SymBio Pharmaceuticals, Daiichi-Sankyo, Merck Serono, ICON, Parexel International, IQVIA Services, A2 Healthcare, AbbVie, EP-CRSU, Linical, Otsuka Pharmaceutical, EPS, Quintiles, CMIC Shift Zero, Eisai, Kissei Pharmaceutical, Kyowa Hakko Kirin, Bayer, inVentiv Health, Gritstone Oncology, GlaxoSmithKline, Covance, MSD, Eli Lilly, Bristol-Myers Squibb, Taiho Pharmaceutical, Ono Pharmaceutical, Chugai Pharmaceutical, AstraZeneca, Astellas outside the submitted work. MK received fees for advisory role from Eisai, Ono, MSD, Bristol-Myers Squibb, and Roche, lecture fees from Eisai, Bayer, MSD, Bristol-Myers Squibb, Eli Lilly, and EA Pharma, and research funding from Gilead Sciences, Taiho, Sumitomo Dainippon Pharma, Takeda, Otsuka, EA Pharma, Abbvie, and Eisai. KNi reports personal fees from Otsuka Pharmaceutical, Life Technologies Japan, Boehringer Ingelheim, Eli Lilly, Chugai Pharmaceutical, Eisai, Pfizer, Novartis, MSD, Ono Pharmaceutical, Bristol‐Myers Squibb, SymBio Pharmaceuticals Limited, Solasia Pharma, Yakult Honsha, Roche Diagnostics, AstraZeneca, Sanofi, Guardant Health, Takeda, Kobayashi Pharmaceutical, and grants from Otsuka Pharmaceutical, Life Technologies Japan, Boehringer Ingelheim, Eli Lilly, Ignyta, Astellas outside the submitted work. The remaining authors declare that the research was conducted in the absence of any commercial or financial relationships that could be construed as a potential conflict of interest.
Figures
References
-
- Motzer RJ, Escudier B, George S, Hammers HJ, Srinivas S, Tykodi SS, et al. Nivolumab Versus Everolimus in Patients With Advanced Renal Cell Carcinoma: Updated Results With Long-Term Follow-Up of the Randomized, Open-Label, Phase 3 CheckMate 025 Trial. Cancer (2020) 126(18):4156–67. doi: 10.1002/cncr.33033 - DOI - PMC - PubMed
LinkOut - more resources
Full Text Sources
Research Materials