. 2021 Oct 29:9:744969.
doi: 10.3389/fcell.2021.744969. eCollection 2021.

Preclinical Application of Conditional Reprogramming Culture System for Laryngeal and Hypopharyngeal Carcinoma

Affiliations

Preclinical Application of Conditional Reprogramming Culture System for Laryngeal and Hypopharyngeal Carcinoma

Yanbo Dong et al. Front Cell Dev Biol. .

Abstract

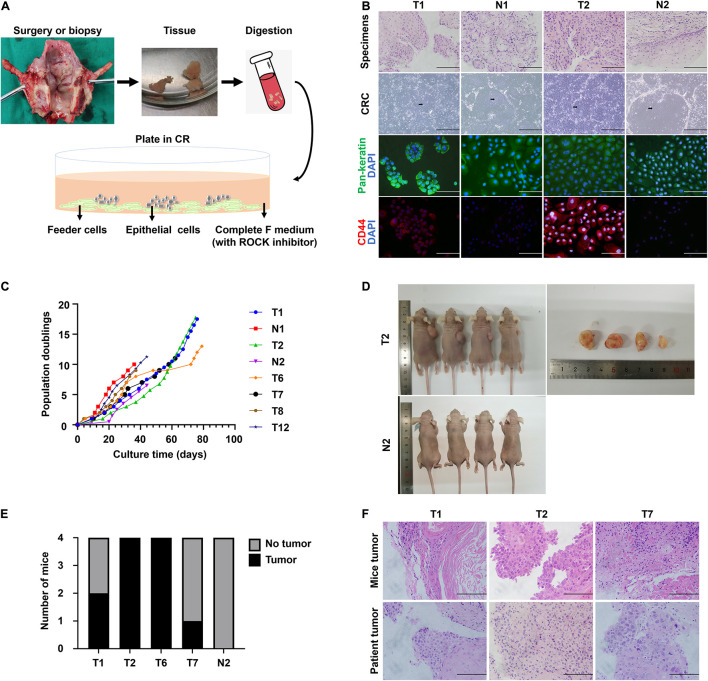
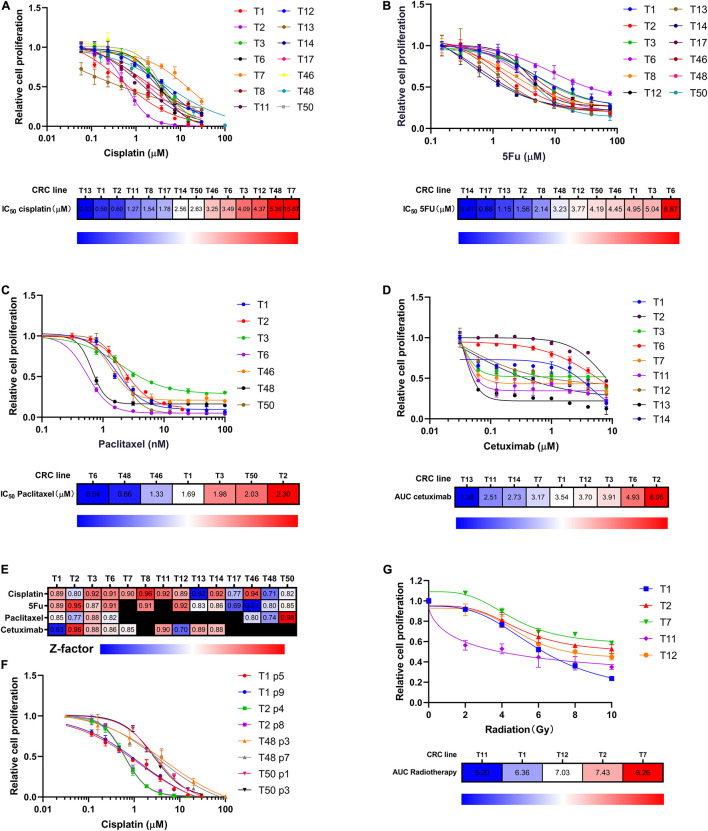
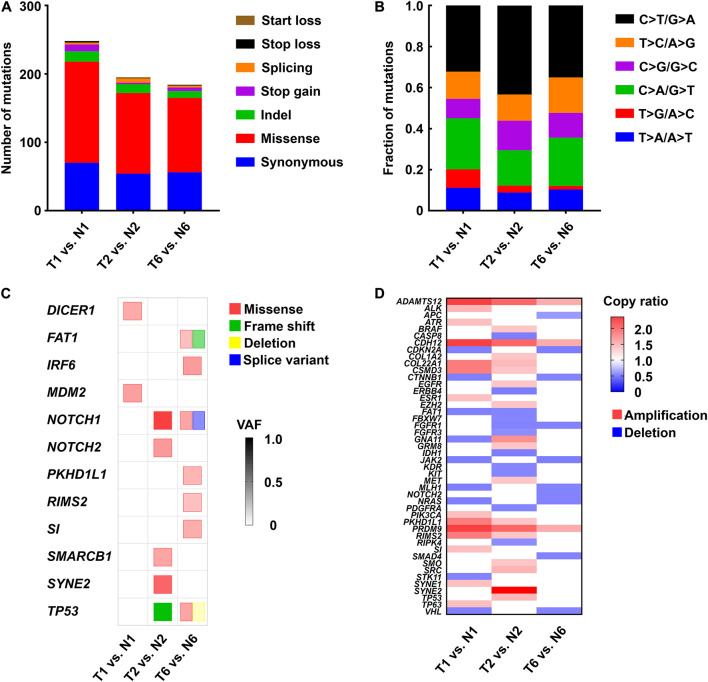
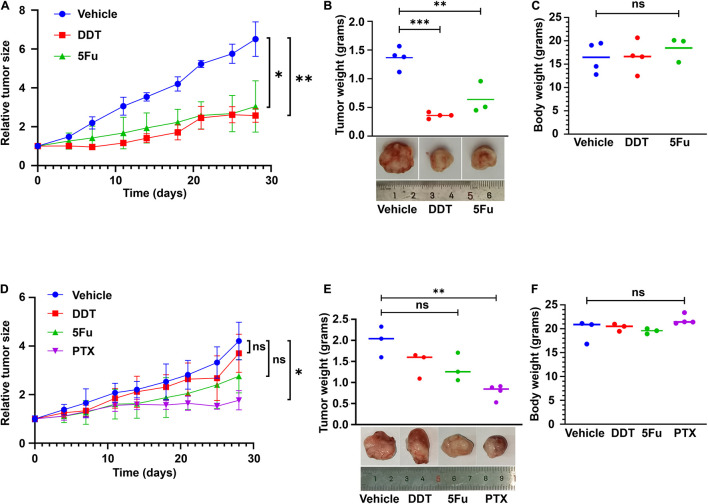
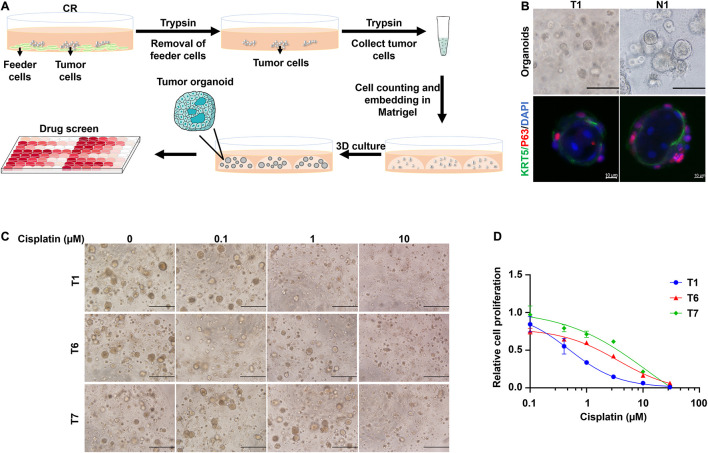
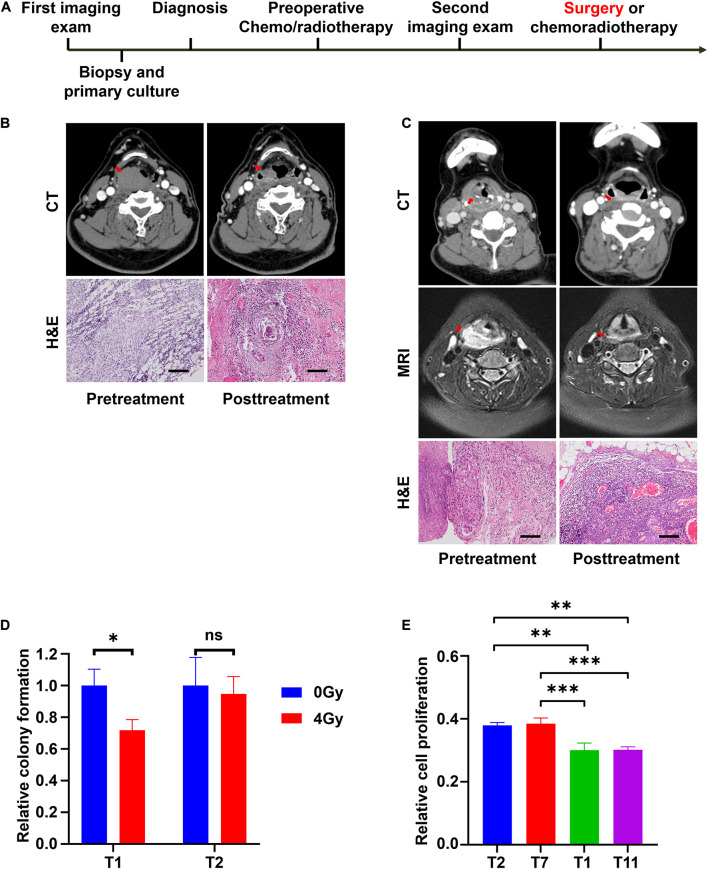
Management of laryngeal and hypopharyngeal squamous cell carcinoma (LHSCC) remains highly challenging due to highly variable therapeutic responses. By establishing an in vitro model for LHSCC based on conditional reprogramming (CR), a cell-culture technique, we aim to investigate its potential value on personalized cancer therapies. Herein, a panel of 28 human LHSCC CR cells were established from 50 tumor tissues using the CR method. They retained tumorigenic potential upon xenotransplantation and recapitulated molecular characteristics of LHSCC. Differential responses to anticancer drugs and radiotherapy were detected in vitro. CR cells could be transformed to xenograft and organoid, and they shared comparable drug responses. The clinical drug responses were consistent with in vitro drug responses. Collectively, the patient-derived CR cell model could promisingly be utilized in clinical decision-making and assisted in the selection of personalized therapies for LHSCC.

Keywords: conditional reprogramming; drug sensitivity; head and neck squamous cell carcinoma; in vitro model; personalized treatment.


Conflict of interest statement

The authors declare that the research was conducted in the absence of any commercial or financial relationships that could be construed as a potential conflict of interest.

Figures

FIGURE 1
FIGURE 1
The establishment of CR system from patient-derived tissues and the characteristics of CRC lines. (A) Schematic representation of the digestion and initial culture condition of CRCs. Tissue obtained via biopsy or resection was collected, minced, digested using trypsin, and subsequently inoculated. (B) Hematoxylin and eosin (H&E) staining of primary tissue of T1, N1, T2, and N2, bright-field microscopic images of the corresponding CRCs, and immunofluorescence for pan-keratin and CD44 markers of corresponding cell slides. Black arrow, conditionally reprogrammed cells. White arrow, feeder cells. Scale bars for HE staining and immunofluorescence images, 125 μm. Scale bars for bright-field microscopy images, 500 μm. (C) The CRC lines were passaged repeatedly and continued to proliferate with a steady growth rate. The cell number was recorded at each passage, and a plot of population doublings versus time (days) was constructed. (D) Representative images of mice bearing tumors and the dissected tumors were shown. (E) Four independent mice were injected subcutaneously with 4 tumor CRC lines and 1 normal CRC line, and the number of mice developing tumors was depicted. (F) Hematoxylin and eosin (H&E) stained images of mice tumors resembled those of the corresponding patient tumors.
FIGURE 2
FIGURE 2
CRC lines as a platform for chemotherapy and radiotherapy sensitivity assay. (A–C) CRC lines revealed variable sensitivity to cisplatin, 5FU, and paclitaxel. Relative cell proliferation was plotted on the y-axis for different concentrations of drugs (x-axis). Heat maps indicated the CRCs ranking according to drug IC50. Red indicated high IC50 values; blue indicated low IC50 values. (D) CRC lines exhibited variable sensitivity to cetuximab. Relative cell proliferation was plotted on the y-axis for different concentrations of cetuximab (x-axis). Heat map showing the CRC lines ranked based on cetuximab sensitivity as measured by AUC. Red indicated high AUC values; blue indicated low AUC values. (E) Heat map showing Z factor scores of the performed drug screens for all drugs and all CRC lines presented in this study. (F) The consistency of cisplatin killing effects among different-passage CRC lines. 4 CRC lines were used to compare. (G) CRC lines revealed differential sensitivity to radiation. Relative cell proliferation was plotted on the y-axis for different amounts of radiation, ranging from 0 to 10 Gy (x-axis). Heat map showing the CRC lines ranked according to radiotherapy sensitivity as measured by AUC. Red indicated high AUC values; blue indicated low AUC values.
FIGURE 3
FIGURE 3
Genetic alterations identified by whole-exome sequencing in 3 paired tumor and normal CRC lines. (A) The number and type of somatic mutations. (B) The spectrum of mutations in LHSCC. (C) Mutations detected in LHSCC-derived CRCs that were sequenced using whole-exome sequencing. The color of the square indicated the type of mutation detected: missense (red), frameshift (green), deletion (yellow), splice variant (blue). Color intensities indicated the variant allele frequency (VAF) of the detected genetic alteration. (D) Heat map of copy number variant (CNV) of tumor-associated genes. Red indicated amplification with copy ratio > 1; blue indicated deletion with copy ratio < 1.
FIGURE 4
FIGURE 4
CR cell-derived xenografts used for drug testing. (A) T2 cell-derived xenografts were treated with vehicle control, cisplatin (DDT), and 5FU beginning from the same day after grouping for 4 weeks. Tumor sizes were measured as indicated. Mean ± SEM (n ≥ 3) was measured. (B) The tumor weight at the end of the treatment was plotted. Representative images of the tumor were presented. (C) Mouse body weights were also compared, with no significant difference. (D) T6 cell-derived xenografts were treated with vehicle control, DDT, 5FU, and paclitaxel (PTX) beginning from the same day after grouping for 4 weeks. Tumor sizes were measured as indicated. Mean ± SEM (n ≥ 3) was measured. (E) The values of tumor weight at the end of the treatment were plotted. Representative images of the tumor were presented. (F) Mouse body weights were also compared, with no significant difference. P < 0.05, ∗∗P < 0.01, ∗∗∗P < 0.001.
FIGURE 5
FIGURE 5
CRCs could form organoids, which could be further used for drug testing. (A) Schematic representation of the culture of CRC-derived organoids and further application for drug testing. (B) Bright-field microscopic images of CRC derived organoids (scale bar, 125 μm) and immunofluorescence analysis (scale bar, 10 μm) for the basal cell marker KRT5 (green) and p63 (red). Nuclei were counterstained with DAPI (blue). (C) Bright-field microscopic images of CRC derived organoids treated with different concentrations of cisplatin. Scale bar, 500 μm. (D) Kill curves of cisplatin to T1, T6, and T7 organoids.
FIGURE 6
FIGURE 6
CRCs reflect the clinical outcomes of representative patients with LHSCC. (A) The timeline of diagnosis and treatment procedure for patients receiving preoperative chemotherapy or radiotherapy before surgery. (B) CT images and microscopic images of tumor tissues of patient T11 before and after chemotherapy. The size of the primary tumor, indicated by a red arrow, decreased more than 50%. Microscopic morphologies indicated pathologic complete response after chemotherapy. Scale bar, 250 μm. (C) CT and MRI images and microscopic images of tumor tissues of patient T13 before and after chemotherapy. The size of the primary tumor (red arrow) decreased. Microscopic morphologies indicated pathologic complete response after chemotherapy. Scale bar, 250 μm. (D) Relative colony formation of T1 and T2, 7 days after treatment with 0 Gy or 4 Gy radiation. P < 0.05. (E) Relative cell proliferation of T1, T2, T7, and T11, 3 days’ culture after treatment with 4 Gy radiation. ∗∗P < 0.01, ∗∗∗P < 0.001.

Similar articles

Cited by

References

    1. Bailey M. H., Tokheim C., Porta-Pardo E., Sengupta S., Bertrand D., Weerasinghe A., et al. (2018). Comprehensive characterization of cancer driver genes and mutations. Cell 173 371–385.e318. 10.1016/j.cell.2018.02.060 - DOI - PMC - PubMed
    1. Bergamaschi D., Gasco M., Hiller L., Sullivan A., Syed N., Trigiante G., et al. (2003). p53 polymorphism influences response in cancer chemotherapy via modulation of p73-dependent apoptosis. Cancer Cell 3 387–402. 10.1016/s1535-6108(03)00079-5 - DOI - PubMed
    1. Bossi P., Resteghini C., Paielli N., Licitra L., Pilotti S., Perrone F. (2016). Prognostic and predictive value of EGFR in head and neck squamous cell carcinoma. Oncotarget 7 74362–74379. 10.18632/oncotarget.11413 - DOI - PMC - PubMed
    1. Dohmen A. J., Swartz J. E., Van Den Brekel M. W., Willems S. M., Spijker R., Neefjes J., et al. (2015). Feasibility of primary tumor culture models and preclinical prediction assays for head and neck cancer: a narrative review. Cancers (Basel) 7 1716–1742. 10.3390/cancers7030858 - DOI - PMC - PubMed
    1. Driehuis E., Kolders S., Spelier S., Lõhmussaar K., Willems S. M., Devriese L. A., et al. (2019). Oral mucosal organoids as a potential platform for personalized cancer therapy. Cancer Discov. 9 852–871. 10.1158/2159-8290.Cd-18-1522 - DOI - PubMed

LinkOut - more resources