. 2021 Nov 2:12:100154.
doi: 10.1016/j.mtbio.2021.100154. eCollection 2021 Sep.

Localized disruption of redox homeostasis boosting ferroptosis of tumor by hydrogel delivery system

Affiliations

Localized disruption of redox homeostasis boosting ferroptosis of tumor by hydrogel delivery system

Xiaomin Su et al. Mater Today Bio. .

Abstract

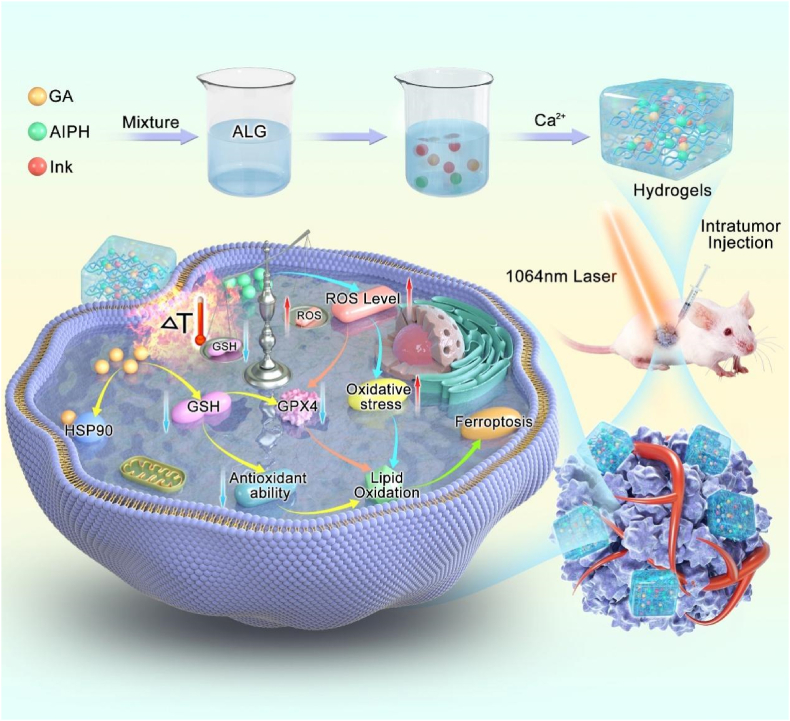
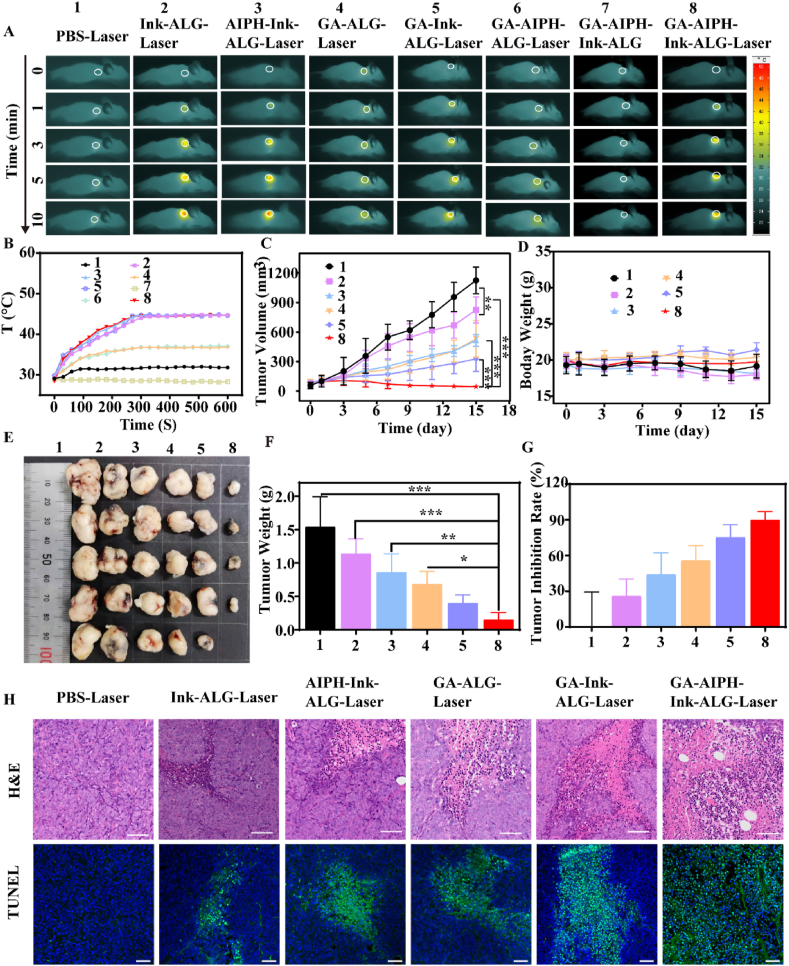
Ferroptosis has received ever-increasing attention due to its unparalleled mechanism in eliminating resistant tumor cells. Nevertheless, the accumulation of toxic lipid peroxides (LPOs) at the tumor site is limited by the level of lipid oxidation. Herein, by leveraging versatile sodium alginate (ALG) hydrogel, a localized ferroptosis trigger consisting of gambogic acid (GA), 2,2'-azobis [2-(2-imidazolin-2-yl) propane] dihydrochloride (AIPH), and Ink (a photothermal agent), was constructed via simple intratumor injection. Upon 1064 ​nm laser irradiation, the stored AIPH rapidly decomposed into alkyl radicals (R•), which aggravated LPOs in tumor cells. Meanwhile, GA could inhibit heat shock protein 90 (HSP90) to reduce the heat resistance of tumor cells, and forcefully consume glutathione (GSH) to weaken the antioxidant capacity of cells. Systematic in vitro and in vivo experiments have demonstrated that synchronous consumption of GSH and increased reactive oxygen species (ROS) facilitated reduced expression of glutathione peroxidase 4 (GPX4), which further contributed to disruption of intracellular redox homeostasis and ultimately boosted ferroptosis. This all-in-one strategy has a highly effective tumor suppression effect by depleting and generating fatal active compounds at tumor sites, which would pave a new route for the controllable, accurate, and coordinated tumor treatments.

Keywords: ABTS, 2,2-Azobis (3-ethylbenzothiazoline-6-sulfonic acid); AIPH, 2,2′-azobis [2-(2-imidazolin-2-yl) propane] dihydrochloride; ALG, sodium alginate; Alkyl radicals; CCK–8, Cell counting kit-8; CLSM, confocal laser scanning microscope; DAPI, 4′,6-diamidino-2-phenylindole; DCFH-DA, 2,7-dichlorofluorescin diacetate; DFO, deferoxamine mesylate; DLS, dynamic light scattering; DMEM, Dulbecco's Modified Eagle's Medium; DTNB, 5,5′-Dithiobis-(2-nitrobenzoic acid); FBS, fetal bovine serum; Fer-1, Ferrostatin -1; Ferroptosis; GA, gambogic acid; GPX4, glutathione peroxidase 4; GSH, glutathione; Glutathione peroxidase; HE, hematoxylin eosin; HSP90, heat shock protein 90; Hydrogel; IR, inhibitory rate; LPO, lipid peroxides; NPs, nanodrugs; PTT, photothermal therapy; ROS, reactive oxygen species; Redox homeostasis; R•, alkyl radicals.


Conflict of interest statement

The authors declare that they have no known competing financial interests or personal relationships that could have appeared to influence the work reported in this paper.

Figures

Image 1
Graphical abstract
Scheme 1
Scheme 1
Schematic diagram of the mechanism of GA–AIPH–Ink–ALG inducing ferroptosis.
Fig. 1
Fig. 1
Characterization of GA–AIPH–Ink–ALG hydrogel. (A) Photographs of Ink and ALG-Ink fluid after being injected into the Ca2+-containing solution at different times (ALG 5 ​mg/mL). (B) SEM image of GA–AIPH–Ink–ALG, scale bar ​= ​100 ​nm. (C) The UV–Vis–NIR spectra of different solutions. (D) The appearance of drug release changed at 0 ​h and 24 ​h. UV–Vis measured the release of GA (E), AIPH (F), and Ink (G) from ALG after 24-h of shock.
Fig. 2
Fig. 2
Photothermal conversion property and free radical release. (A) The temperature curves of Ink at various concentrations under 1064 ​nm laser (0.5 ​W/cm2) irradiation (the initial mean temperature was 26.98 ​°C) and (B) corresponding photothermal images. (C) The temperature change of different groups with 1064 ​nm laser (0.5 ​W/cm2) irradiation (the initial mean temperature was 26.74 ​°C) and (D) representative photothermal images. (E) Cycle stability of GA–AIPH–Ink–ALG and Ink. (F) The generation of ABTS+• in ABTS and AIPH at different temperatures and times. (G) The absorption of ABTS+• produced from the reaction of ABTS and GA–AIPH–Ink–ALG under 1064 ​nm (0.5 ​W/cm2) laser irradiation for different times. (F) The absorbance of different groups at 736 ​nm with a prolonged 1064 ​nm laser irradiation time.
Fig. 3
Fig. 3
Synergistic treatment of GA–AIPH–Ink–ALG in vitro. (A) Corresponding cell viability after being treated with an increasing concentration of AIPH and constant concentration of Ink. (B) Cell activity after dealing with elevated concentration of GA. (C) Cell viability after treatment with different concentrations of GA and stable concentration of Ink. (D) Cell viability after treatment with different concentrations of GA and constant concentration of Ink and AIPH. (E) Cell viability after treatment with different concentrations of GA and Changeless concentration of Ink, AIPH, and ALG (all of the above groups were divided into with and without 1064-nm laser (0.5 ​W/cm2) irradiation groups) (F) IC50 of different groups. (G) Confocal images of HCT116 ​cells co-stained Calcein -AM (green) and PI (red) after incubation with different groups (scale bars ​= ​50 ​μm) and (H) corresponding semi-quantitative analysis of (G). (I) Western blot expression of HSP90 after incubation with HCT116 ​cells in different groups.
Fig. 4
Fig. 4
Analysis of ferroptosis in vitro (A) Cell viability of HCT116 ​cells after being treated with an elevated concentration of Fer-1 and constant concentrations of GA, AIPH, Ink, and ALG under 1064 ​nm laser irradiation. (B) Quantitation of GSH levels in HCT116 ​cells with different treatments (n ​= ​4). (C) ROS generation of HCT116 ​cells with various treatments detected by CLSM. (D) Flow cytometer analysis of ROS generation under different conditions (DCFH-DA as the detection probe) (1: control 2: Ink–Laser 3: AIPH–Laser 4: GA–Laser 5: AIPH–Ink 6: AIPH–Ink–Laser 7: GA–Ink–Laser 8: GA–AIPH–Ink–Laser 9: GA–AIPH–Ink–ALG 10: GA–AIPH–Ink–ALG–Laser). (E)The expression of GPX4 in HCT116 ​cells treated with different formulations.
Fig. 5
Fig. 5
Lipidomic analysis. (A) Lipid classification of HCT116 ​cells. (B) PCA analysis of different groups by LC-MS after incubation with various formulations. (C) Hierarchical cluster analysis showing the relative lipid metabolism levels of cells after different treatments. Columns stand for samples and rows stand for lipids. (D) Number of differences in lipid metabolism between different groups. (E) Correlation diagram of different metabolites between different groups. (F–G) Lipids were selected as biomarkers, and the sub-lipid components of two major distinction lipids (PE and PC) were statistically analyzed. (A: control, B: GA–Laser, C: GA–Ink–Laser, D: GA–AIPH–Ink–Laser).
Fig. 6
Fig. 6
Photothermal effects and antitumor effect in vivo. (A) Thermal images and (B) temperature curve of the tumor site after 1064 ​nm laser irradiation for 10 ​min (0.5 ​W/cm2). (C) Tumor-volume changes during treatment period (n ​= ​5). (D) Mean body weight of mice after treatment in different groups during 15 days. The tumor tissue is photographed (E) and weighed (F) after 15 days of different treatments. (G) Inhibition rates of tumor growth with various treatments. (H) Hematoxylin and eosin (H&E) and TUNEL staining of tumor slicing (scale bar of H&E ​= ​50 ​μm; scale bar of TUNEL ​= ​20 ​μm).
Fig. 7
Fig. 7
Mechanical evaluation of GA–AIPH–Ink–ALG–induced ferroptosis in vivo. (A) Tumor volume and (B) body-weight changes during 15 days (n ​= ​5). (C) Tumor tissue were collected and photographed after 15 days of different treatments. (D) GSH levels of HCT116 with different treatments in vivo. (E) H&E and TUNEL staining of tumor sections after various treatments (Scale bar of H&E ​= ​50 ​μm; scale bar of TUNEL ​= ​20 ​μm). (F) Relative ROS generation of HCT116 ​cells after treatment with different groups.

References

    1. Reed J.C., Pellecchia M. Ironing out cell death mechanisms. Cell. 2012;149(5):963–965. doi: 10.1016/j.cell.2012.05.009. - DOI - PubMed
    1. Kong N., Chen X., Feng J., Duan T., Liu S., Sun X., Chen P., Pan T., Yan L., Jin T., Xiang Y., Gao Q., Wen C., Ma W., Liu W., Zhang M., Yang Z., Wang W., Zhang R., Chen B., Xie T., Sui X., Tao W. Baicalin induces ferroptosis in bladder cancer cells by downregulating FTH1. Acta Pharm. Sin. B. 2021 doi: 10.1016/j.apsb.2021.03.036. - DOI - PMC - PubMed
    1. Liang Y., Zhang L., Peng C., Zhang S., Chen S., Qian X., Luo W., Dan Q., Ren Y., Li Y., Zhao B. Tumor microenvironments self-activated nanoscale metal organic frameworks for ferroptosis based cancer chemodynamic/photothermal/chemo therapy. Acta Pharm. Sin. B. 2021 doi: 10.1016/j.apsb.2021.01.016. - DOI - PMC - PubMed
    1. Wang W., Green M., Choi J.E., Gijon M., Kennedy P.D., Johnson J.K., Liao P., Lang X., Kryczek I., Sell A., Xia H., Zhou J., Li G., Li J., Li W., Wei S., Vatan L., Zhang H., Szeliga W., Gu W., Liu R., Lawrence T.S., Lamb C., Tanno Y., Cieslik M., Stone E., Georgiou G., Chan T.A., Chinnaiyan A., Zou W. CD8(+) T cells regulate tumour ferroptosis during cancer immunotherapy. Nature. 2019;569(7755):270–274. doi: 10.1038/s41586-019-1170-y. - DOI - PMC - PubMed
    1. Jiang X., Stockwell B.R., Conrad M. Ferroptosis: mechanisms, biology and role in disease. Nat. Rev. Mol. Cell Biol. 2021;22(4):266–282. doi: 10.1038/s41580-020-00324-8. - DOI - PMC - PubMed

LinkOut - more resources