

Cardiac Imaging Trends from 2010 to 2019 in the Medicare Population
- PMID: 34778785
- PMCID: PMC8581585
- DOI: 10.1148/ryct.2021210156
Cardiac Imaging Trends from 2010 to 2019 in the Medicare Population
Abstract
Purpose: To evaluate changes in utilization of cardiac imaging-transthoracic, transesophageal, and stress echocardiography (TTE, TEE, and SE), coronary CT angiography (cCTA), cardiac MRI (cMRI), myocardial perfusion imaging (MPI), and cardiac positron emission tomography (cPET).
Materials and methods: The 2010-2019 Physician/Supplier Procedure Summary files were used to find imaging utilization per 100 000 Medicare beneficiaries. Global and professional claims were aggregated, representing total interpretive services. Specialty codes identified provider specialty. Results were stratified by physician offices, hospital outpatient departments (HOPDs), inpatient setting, and the emergency department.
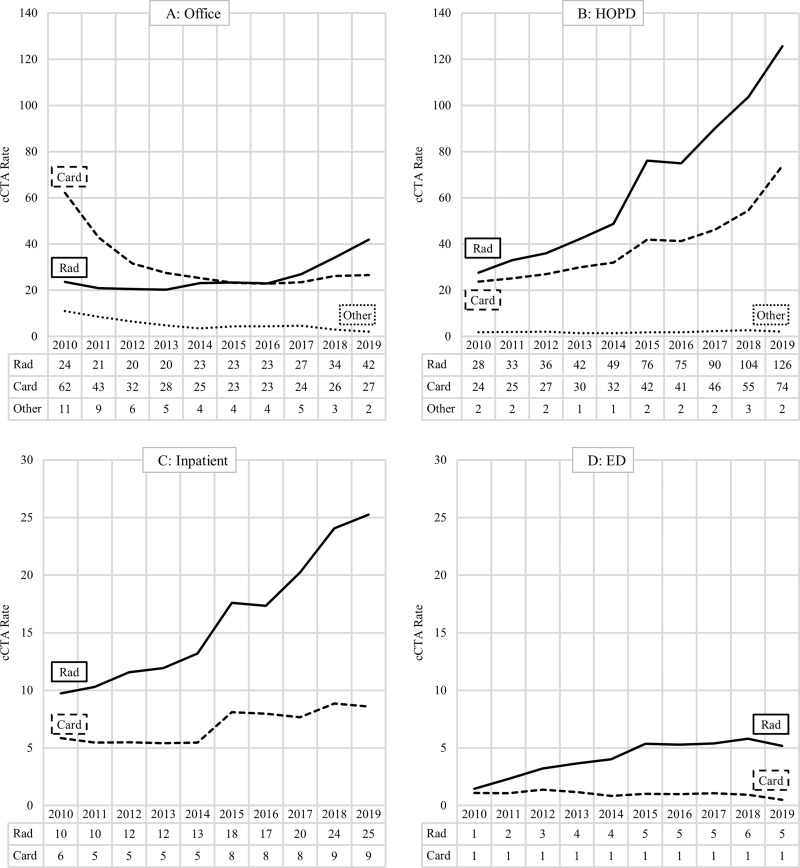
Results: From 2010 to 2019, there was a partial shift from cardiologist offices to the HOPD for TTE (office: -23%; HOPD: +107%) and SE (office: -44%; HOPD: +11%). Cardiologist cCTA also shifted from the office (-57%) to the HOPD (+211%). Radiologist-performed cCTA grew in all locations but most in the HOPD (+355%), with radiologists performing more cCTA than cardiologists in all settings. cMRI rates remain low but rose in the HOPD for both cardiologists (+209%) and radiologists (+207%). Cardiologist MPI rates dropped dramatically in the office (-52%), with a smaller absolute rate increase in the HOPD (+71%). cPET nearly tripled in the cardiology office (+193%), but rates remained steady for radiologists.
Conclusion: While most cardiologist in-office imaging has shifted to the HOPD, there has been an increase in in-office cPET, likely due to a combination of technological advances, interpretation familiarity, and financial incentives. Radiologist cCTA rates continue to increase, representing a growing opportunity for radiologists to collaborate in cardiac imaging.Keywords: CT Angiography, Echocardiography, MR Imaging, PET, Radionuclide Studies, SPECT, Cardiac, Work Force Issues Supplemental material is available for this article. © RSNA, 2021.
Keywords: CT Angiography; Cardiac; Echocardiography; MR Imaging; PET; Radionuclide Studies; SPECT; Work Force Issues.
2021 by the Radiological Society of North America, Inc.
Conflict of interest statement
Disclosures of Conflicts of Interest: R.A.R. disclosed no relevant relationships. E.J.H. disclosed no relevant relationships. V.M.R. former board member of RSNA.
Figures


References
-
- Kamel SI , Intenzo CM , Parker L , Rao V , Levin DC . Recent trends suggest possible inappropriate utilization of myocardial perfusion imaging . J Am Coll Radiol 2019. ; 16 ( 8 ): 1013 – 1017 . - PubMed
-
- Levin DC , Parker L , Halpern EJ , Rao VM . Recent trends in imaging for suspected coronary artery disease: what is the best approach? J Am Coll Radiol 2016. ; 13 ( 4 ): 381 – 386 . - PubMed
-
- Ohira H , Mc Ardle B , Cocker MS , deKemp RA , Dasilva JN , Beanlands RS . Current and future clinical applications of cardiac positron emission tomography . Circ J 2013. ; 77 ( 4 ): 836 – 848 . - PubMed
-
- Physician Supplier Procedure Summary . Centers for Medicare and Medicaid; . https://www.cms.gov/Research-Statistics-Data-and-Systems/Statistics-Tren.... Published 2019. Accessed September 27, 2020 .
-
- Medicare Enrollment . Centers for Medicare & Medicaid Services Program Statistics; . https://www.cms.gov/Research-Statistics-Data-and-Systems/Statistics-Tren.... Published 2020. Accessed March 30, 2020 .
LinkOut - more resources
Full Text Sources
