. 2021 Sep 1;2(6):600-615.
doi: 10.1158/2643-3230.BCD-21-0043. eCollection 2021 Nov.

Aberrant Extrafollicular B Cells, Immune Dysfunction, Myeloid Inflammation, and MyD88-Mutant Progenitors Precede Waldenstrom Macroglobulinemia

Affiliations

Aberrant Extrafollicular B Cells, Immune Dysfunction, Myeloid Inflammation, and MyD88-Mutant Progenitors Precede Waldenstrom Macroglobulinemia

Akhilesh Kaushal et al. Blood Cancer Discov. .

Abstract

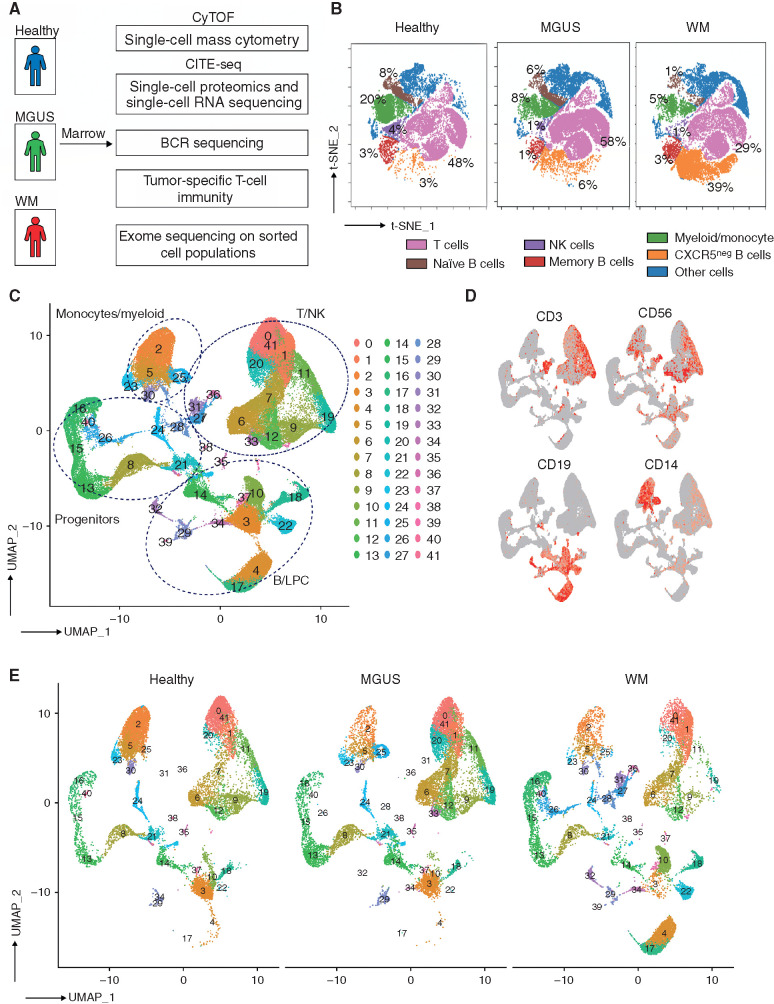
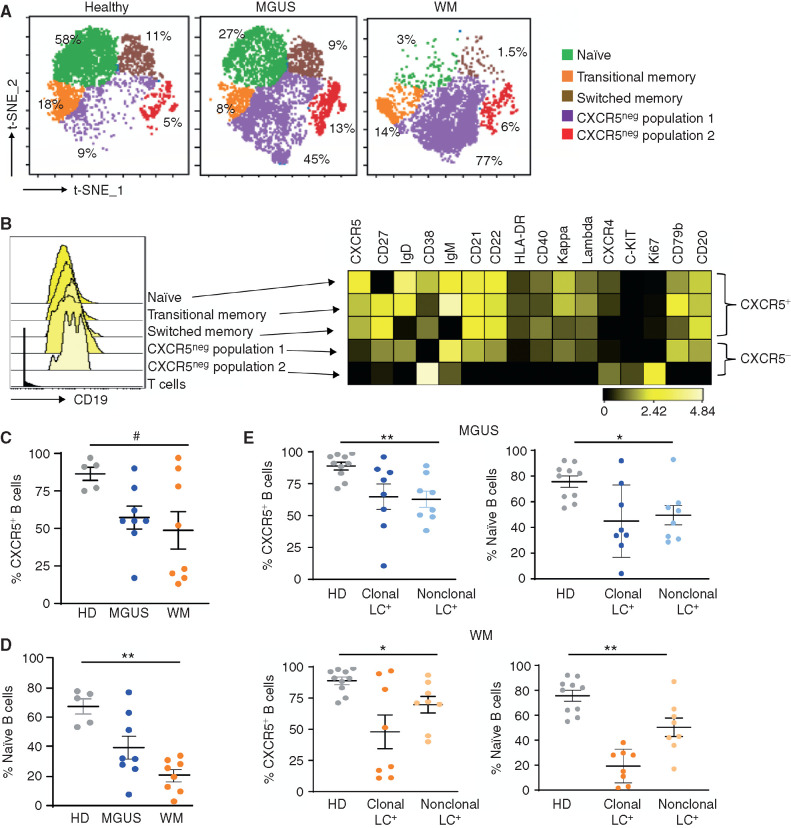
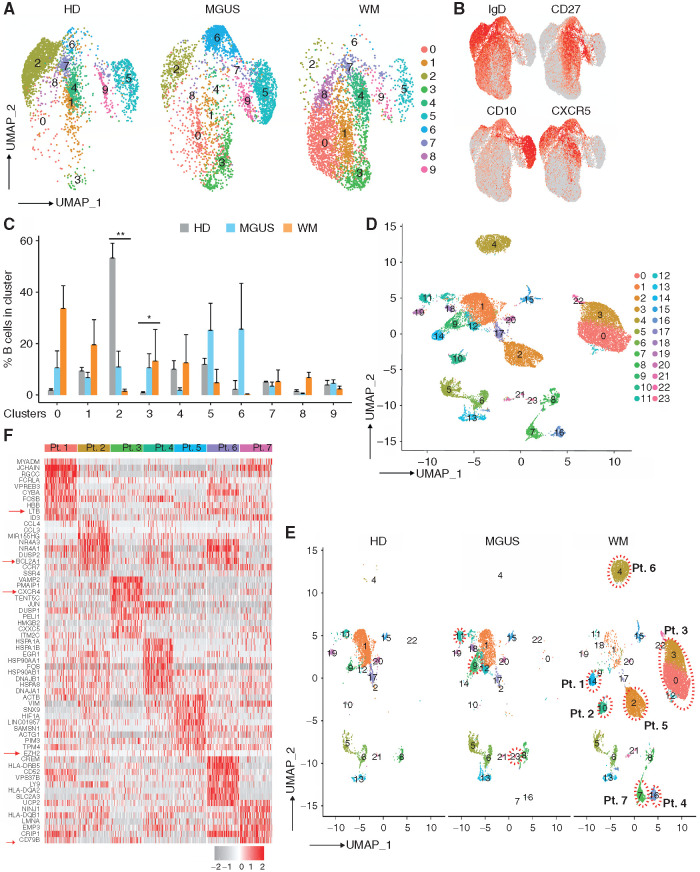
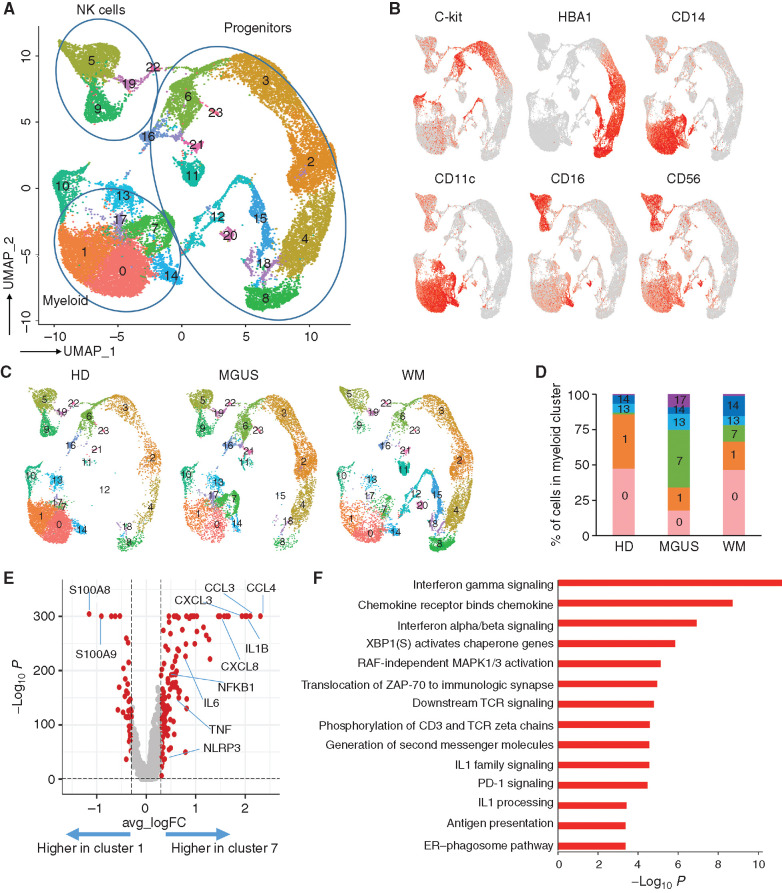
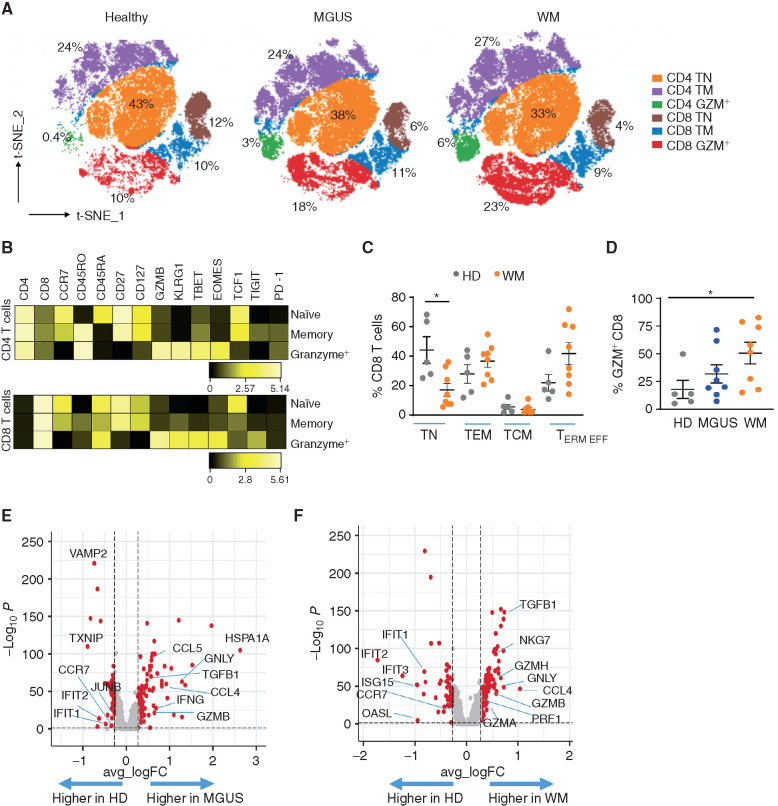
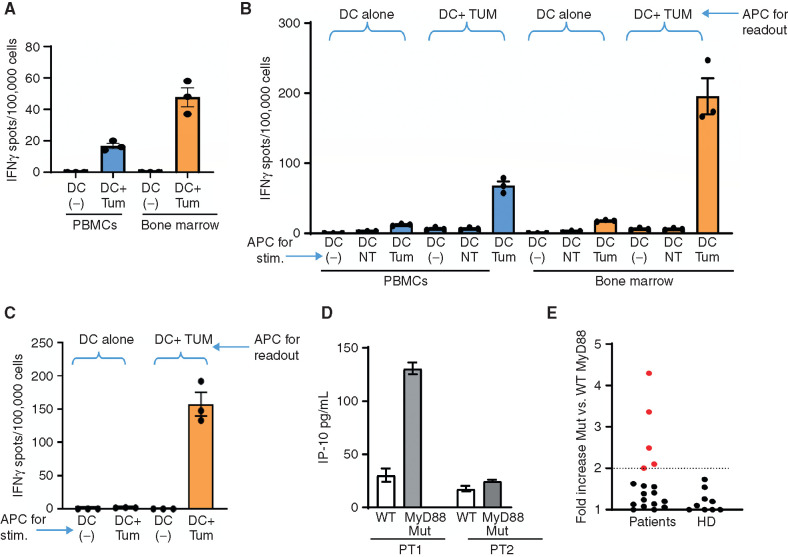
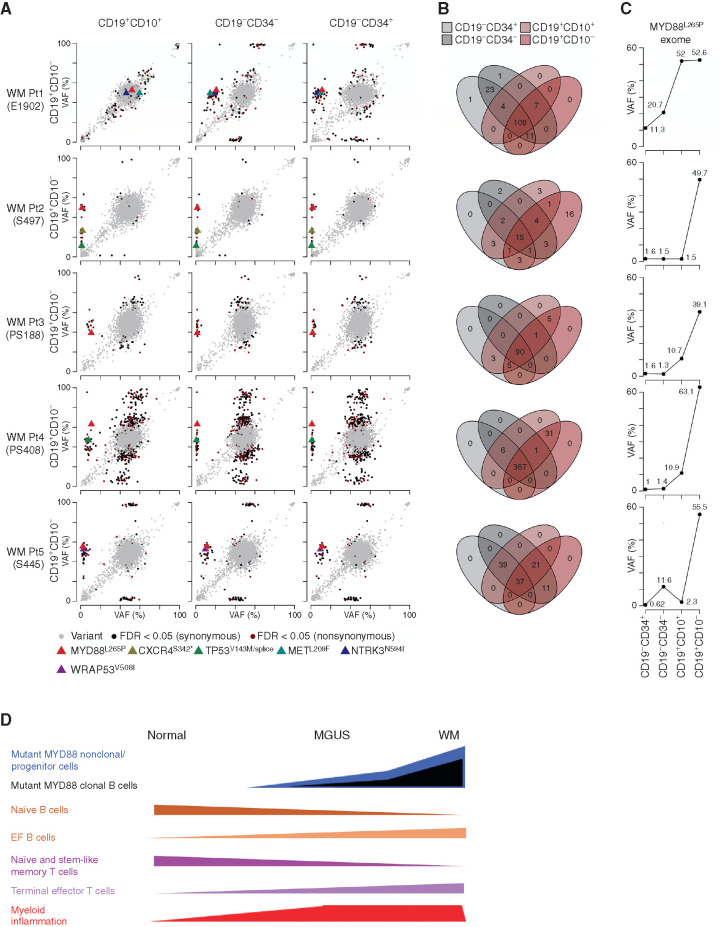
Waldenstrom macroglobulinemia (WM) and its precursor IgM gammopathy are distinct disorders characterized by clonal mature IgM-expressing B-cell outgrowth in the bone marrow. Here, we show by high-dimensional single-cell immunogenomic profiling of patient samples that these disorders originate in the setting of global B-cell compartment alterations, characterized by expansion of genomically aberrant extrafollicular B cells of the nonmalignant clonotype. Alterations in the immune microenvironment preceding malignant clonal expansion include myeloid inflammation and naïve B- and T-cell depletion. Host response to these early lesions involves clone-specific T-cell immunity that may include MYD88 mutation-specific responses. Hematopoietic progenitors carry the oncogenic MYD88 mutations characteristic of the malignant WM clone. These data support a model for WM pathogenesis wherein oncogenic alterations and signaling in progenitors, myeloid inflammation, and global alterations in extrafollicular B cells create the milieu promoting extranodal pattern of growth in differentiated malignant cells.

Significance: These data provide evidence that growth of the malignant clone in WM is preceded by expansion of extrafollicular B cells, myeloid inflammation, and immune dysfunction in the preneoplastic phase. These changes may be related in part to MYD88 oncogenic signaling in pre-B progenitor cells and suggest a novel model for WM pathogenesis. This article is highlighted in the In This Issue feature, p. 549.


Figures

Figure 1.
Figure 1.
Changes in the bone marrow microenvironment comparing HDs, IgM MGUS, and WM. A, Overall strategy. Bone marrow mononuclear cells (BMMNC) were obtained from patients with IgM MGUS (n = 8) and WM (n = 8), as well as age-matched HDs (n = 5). CITE-seq, single-cell mass cytometry, BCR sequencing, and exome sequencing were performed on the samples. BMMNCs were also used for functional assays to test T-cell reactivity to tumor. B, BMMNCs from HDs (n = 5), MGUS (n = 8), and WM (n = 8) were stained with metal-conjugated antibodies. Data were analyzed using Cytobank software. Figure shows t-distributed Stochastic Neighbor Embedding (t-SNE) plots of concatenated live-cell gated data from mass cytometry analysis. Concatenations were done with equal cell numbers of cells from each donor. The overlay plots show differences in different immune cell subsets including differences in B-cell subsets [naïve B cells (brown) and CXCR5neg B cells in MGUS and WM (orange)], myeloid/monocyte population (green), and T cells (pink) in patients with MGUS (pink). NK, natural killer. C, BMMNCs from HDs (n = 4), MGUS (n = 7), and WM (n = 7) were labeled with TotalSeq-C antibodies and processed using the 10x DropSeq platform. Figure shows Uniform Manifold Approximation and Projection (UMAP) clustering of 84,128 single BMMNCs based on transcriptome. Forty-two distinct clusters could be identified, including B/lymphoplasmacytoid (LPC) cells (clusters 3, 4, 10, 14, 18, 22, 29, 34, 32, 37, 39), T/NK cells (0, 1, 6, 7, 9, 11, 12, 19, 20, 27, 31, 33, 36, 41), myeloid cells including monocytes and dendritic cell subsets (clusters 2, 5, 23, 25, 30), as well as progenitors/precursor cells (clusters 8, 13, 15, 16, 21, 24, 26, 28, 40). D, Feature plots showing surface expression of lineage antibodies CD3, CD56, CD19, and CD14 on clusters in C. E, UMAP clustering of BMMNCs cells by cohort. Figure shows differences in distinct myeloid (clusters 2, 5) and B-cell populations (cluster 3) in MGUS and WM, as well as in B/LPC populations in MGUS and WM (e.g., clusters 4, 10, 17, 22).
Figure 2.
Figure 2.
Mass cytometry analysis of changes in B cells. Single-cell mass cytometry was performed on bone marrow mononuclear cells from HDs (n = 5) or patients with IgM MGUS (n = 8) and WM (n = 8). A, T-distributed Stochastic Neighbor Embedding (t-SNE) plot gated on CD19+ B cells by cohort. Figure shows differences in different B-cell subsets, including differences in naïve B cells (green) and switched memory B cells in MGUS and WM (brown) and in CXCR5neg B-cell subset in MGUS and WM patients compared with HDs (purple). B, Phenotypes of major subpopulations of CD19+ cells in A. Heatmap shows expression of cell-surface markers (CXCR5, CD27, CD38, CD21, CD22, HLA-DR, CD40, CXCR4, C-KIT, Ki67, CD79b, and CD20) and immunoglobulins (IgD, IgM) in the different CD19+ cell populations shown in A. Histogram shows expression of CD19 on the various B-cell populations and T cells as control. C, Differences in CXCR5-positive B cells. Graphs show the percentage of CXCR5-positive cells in HDs, MGUS, and WM. Each dot represents a unique patient. D, Differences in naïve B cells. Figure shows naïve B cells as a percentage of total B cells in HDs, MGUS, and WM. Each dot represents a unique patient. E, Differences in B cells based on expression of clonal light chain. CD19+ B cells from MGUS and WM were gated based on the presence of clonal Ig light chain (kappa/lambda, depending on the light chain of the M spike). Figure shows differences in B-cell populations including in naïve B cells (right) and CXCR5+ B cells (left) in both clonal light chain positive (clonal LC+) as well as B cells expressing the opposite light chain (termed as nonclonal LC+) in MGUS and WM. #, P = 0.06; *, P < 0.05; **, P < 0.01, Kruskal–Wallis.
Figure 3.
Figure 3.
CITE-seq analysis of differences in CD19+ cells. B cells were identified based on their surface binding of anti-CD19 antibody, and antibody-based UMAP clustering analysis was performed on the B-cell–associated antibodies used in CITE-seq (IgD, CD27, CXCR5, CD138, PD-1, CD10, CD16, CD21, CD79b, CD27, CD38, and CD20). B cells from patients with IgM MGUS (4,039 cells) and WM (13,077 cells) were compared with those from HDs (3,403 cells). A, UMAP of B cells clustered based on binding to antibodies. Figure shows distribution of B cells in 10 distinct clusters within the three cohorts, showing differences in IgD+CD27 naïve B cells (cluster 2) and in CXCR5neg B cells (cluster 3) in MGUS and WM. B, Feature plot showing binding of antibodies against IgD, CD27, CD10, and CXCR5 in B cells within the different clusters. C, Proportion of cell clusters by cohort. Bar graph shows distribution of B cells from HDs, MGUS, and WM within different clusters shown in A. MGUS and WM cohorts had decreased proportion of cells in cluster 2 and a relative increase in cluster 3 when compared with HD B cells. Graph shows mean ± SEM. *, P < 0.05; **, P < 0.01, Kruskal–Wallis. D, UMAP of CD19+ B cells based on transcriptome. UMAP clustering analysis was performed on all B cells (n = 20,519) from HDs, MGUS, and WM. This clustering analysis revealed 24 transcriptionally distinct B-cell populations. E, UMAP of CD19+ B cells based on transcriptome by cohort. Figure shows decline in B cells in cluster 1 in MGUS and WM, whereas this is the dominant cluster in HDs. Transcriptome-based UMAP also revealed unique (patient-specific) B-cell clusters (circled) in WM. F, Heatmap of patient-specific clusters of clonal B cells. Comparison of transcriptomes of unique B-cell clusters identified in WM revealed distinct patient-specific patterns of gene expression. Data shown in the heatmap include top 10 differentially expressed genes from each B-cell cluster.
Figure 4.
Figure 4.
Changes in myeloid cells. Bone marrow mononuclear cells that did not bind to either anti-CD3 or anti-CD19 antibody from HDs (11,160 cells), MGUS (10,376 cells), and WM (11,262 cells) were analyzed using transcriptome-based UMAP clustering to evaluate changes in myeloid cells, NK cells, and progenitors. A, UMAP of CD3CD19 cells based on transcriptome expression revealed 24 different clusters including myeloid/monocyte clusters (0, 1, 7, 13, 14, 17), NK cell clusters (5, 9, 19, 22), and progenitor/precursor cell clusters (2, 3, 4, 6, 8, 10, 12, 15, 16, 18, 21, 23). B, Feature plot showing antibody binding for CD14, CD11c, CD16, CD56, and C-kit as well as hemoglobin expression (by transcript). C, UMAP of CD3CD19 cells by cohort showing decreased proportion of cells in myeloid clusters 0 and 1 in WM. D, Proportion of myeloid clusters by cohort. Bar graph showing the proportions of all myeloid clusters in HDs, MGUS, or WM, with decline in cluster 1 and increase in cluster 7 in MGUS and WM compared with HD. E, Volcano plot of genes differentially expressed in myeloid cluster 7. Many of the genes overexpressed in this cluster include those associated with myeloid inflammation. F, Pathway analysis of differentially regulated genes enriched in myeloid cluster 7. ER, endoplasmic reticulum; TCR, T-cell receptor.
Figure 5.
Figure 5.
Changes in T cells. A, T-distributed Stochastic Neighbor Embedding (t-SNE) plot of changes in T cells by cohort. Bone marrow mononuclear cells from HDs, MGUS, and WM were analyzed using mass cytometry. CD3 T cells from HDs, MGUS, and WM cohorts were concatenated using equal numbers of cells from individual patients and analyzed using t-SNE analysis. Overlay plot shows distribution of T cells across different cohorts with progressive increase in CD8 granzyme+ T cells (red) in MGUS/WM and decline in naïve CD8+ T cells (brown) compared with HDs. TM, memory T cell; TN, naïve T cell. B, Phenotype of major CD4/CD8+ T-cell subsets. Heat map shows protein expression of cell-surface markers as well as transcription factors/lytic molecules in the different T-cell subsets shown in A. The CD8+ granzyme+ T cells enriched in WM have a phenotype of TCF1loTigit+ KLRG1+ T cells. C, Proportions of CD8 T-cell subsets in HDs and WM. Supplementary figure shows naïve (TN; CCR7, CD45RO), effector memory (TEM; CCR7CD45RO+), central memory (TCM; CCR7, CD45RO+CD45RA+), and terminal effector (TERM EFF; CCR7CD45RO) cells as a percentage of total CD8 T cells in HDs and WM patients. Each dot represents a unique patient. *, P < 0.05, Kruskal–Wallis. D, Proportion of granzyme-positive CD8 T cells as a proportion of total CD8 T cells in HDs as well as MGUS and WM patients. Each dot represents a unique patient. *, P < 0.05, Kruskal–Wallis. E, Volcano plot of differentially expressed genes in CD8+ T cells in MGUS versus HDs based on CITE-seq. F, Volcano plot of differentially expressed genes in CD8+ T cells WM versus HD based on CITE-seq.
Figure 6.
Figure 6.
Tumor-specific immunity in WM. A, Detection of WM-specific immunity in freshly isolated T cells from blood/bone marrow. Freshly isolated blood or marrow-derived T cells were cultured overnight in the presence of autologous monocyte-derived mature dendritic cells (DC) loaded with autologous tumor cells (or unpulsed mature DCs as control). Tumor-specific IFNγ-producing T cells were quantified with an Elispot assay. Each dot represents mean of replicates from an individual patient. PBMC, peripheral blood mononuclear cell. DC+ Tum, DCs loaded with tumor cells. B, Ex vivo expansion of WM-specific T cells by autologous tumor-loaded DCs. Blood or bone marrow T cells were stimulated for 10 to 14 days in the presence of autologous unloaded mature DCs [DC(-)], DCs loaded with CD19 cells (nontumor, DC NT), or tumor-loaded DCs (DC Tum). The presence of tumor-specific T cells was quantified using IFNγ Elispot following overnight culture with autologous unpulsed or tumor-loaded DCs. Each dot represents mean of replicates from an individual patient. APC, antigen-presenting cell. C, CD4 T-cell depletion: Responder T cells from the experiment described in B were depleted of CD4+ T cells utilizing magnetic beads prior to testing for reactivity using tumor-loaded DCs. The presence of tumor-specific T cells was quantified using IFNγ Elispot. Each dot represents mean of replicates from an individual patient. D and E, Detection of MYD88 L265P–specific reactivity in WM patients. Mononuclear cells were cultured with peptides spanning wild-type (WT) or mutant (Mut) MyD88 L265P sequences. The presence of peptide reactivity was assayed based on the detection of IP-10/CXCL-10 in the supernatant. D, Data from representative patients with or without MYD88 reactivity. E, Summary of MyD88 L265P reactivity in all patients and HDs studied.
Figure 7.
Figure 7.
Exome sequencing of early B-cell progenitors and proposed model for WM evolution. A–C, MYD88 mutations are present throughout the hematopoietic system. A, VAFs in CD19+CD10 cells (y-axis) as compared with CD19+CD10+ pre–B cells (left), CD19CD34 cells (middle), and CD19−CD34+ cells (right; x-axis). All variant alleles are shown, and those with significantly different allelic fractions (FDR ≤ 0.05) between any two cell fractions are shown in red, with select genes labeled in colored triangles. B, Venn diagrams of variants shared and distinct between cell fractions. C, VAF of MYD88L265P across CD19CD34+, CD19CD34, CD19+CD10+, and CD19+CD10 cell fractions. D, Proposed model for WM development: Acquisition of MYD88 mutation in hematopoietic progenitors is an early event in the origin of WM and associated with several changes in the immune microenvironment, including increase in extrafollicular B cells, myeloid inflammation, and alteration in immune function that begin as early as the MGUS stage. The B-cell clone emerges in this milieu and undergoes progressive growth and evolution in the WM stage. Host immune system mediates tumor-specific recognition of the clone but undergoes immune exhaustion over time.

Similar articles

Cited by

References

    1. Gertz MA.Waldenstrom macroglobulinemia: 2020 update on diagnosis, risk stratification, and management. Am J Hematol 2021;96:258–69. - PubMed
    1. Dhodapkar MV, Jacobson JL, Gertz MA, Rivkin SE, Roodman GD, Tuscano JM, et al. Prognostic factors and response to fludarabine therapy in patients with Waldenstrom macroglobulinemia: results of United States intergroup trial (Southwest Oncology Group S9003). Blood 2001;98:41–8. - PubMed
    1. Treon SP, Xu L, Yang G, Zhou Y, Liu X, Cao Y, et al. MYD88 L265P somatic mutation in Waldenstrom's macroglobulinemia. N Engl J Med 2012;367:826–33. - PubMed
    1. Xu L, Hunter ZR, Yang G, Zhou Y, Cao Y, Liu X, et al. MYD88 L265P in Waldenstrom macroglobulinemia, immunoglobulin M monoclonal gammopathy, and other B-cell lymphoproliferative disorders using conventional and quantitative allele-specific polymerase chain reaction. Blood 2013;121:2051–8. - PMC - PubMed
    1. Treon SP, Xu L, Guerrera ML, Jimenez C, Hunter ZR, Liu X, et al. Genomic landscape of Waldenstrom macroglobulinemia and its impact on treatment strategies. J Clin Oncol 2020;38:1198–208. - PMC - PubMed

Publication types

Substances