

County-Level Impact of the COVID-19 Pandemic on Excess Mortality Among U.S. Veterans: A Population-Based Study
- PMID: 34778864
- PMCID: PMC8577544
- DOI: 10.1016/j.lana.2021.100093
County-Level Impact of the COVID-19 Pandemic on Excess Mortality Among U.S. Veterans: A Population-Based Study
Abstract
Background: As the novel coronavirus (COVID-19) continues to impact the world at large, Veterans of the US Armed Forces are experiencing increases in both COVID-19 and non-COVID-19 mortality. Veterans may be more susceptible to the pandemic than the general population due to their higher comorbidity burdens and older age, but no research has examined if trends in excess mortality differ between these groups. Additionally, individual-level data on demographics, comorbidities, and deaths are provided in near-real time for all enrolees of the Veterans Health Administration (VHA). These data provide a unique opportunity to identify excess mortality throughout 2020 at a subnational level, and to validate these estimates against local COVID-19 burden.
Methods: We queried VHA administrative data on demographics and comorbidities for 11.4 million enrolees during 2016-2020. Pre-pandemic data was used to develop and cross-validate eight mortality prediction models at the county-level including Poisson, Poisson quasi-likelihood, negative binomial, and generalized estimating equations. We then estimated county-level excess Veteran mortality during 2020 and correlated these estimates with local rates of COVID-19 confirmed cases and deaths.
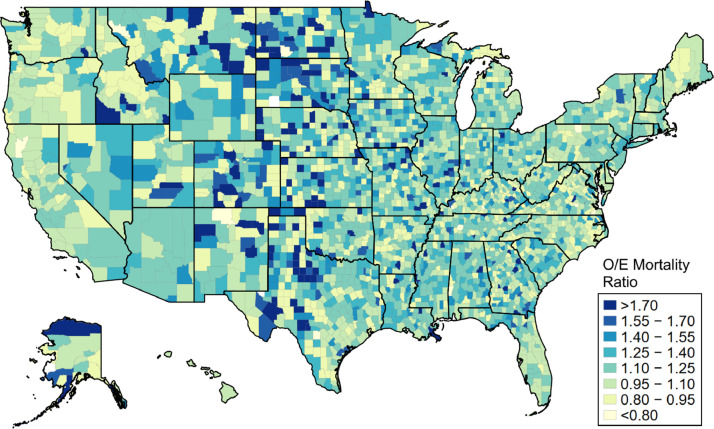
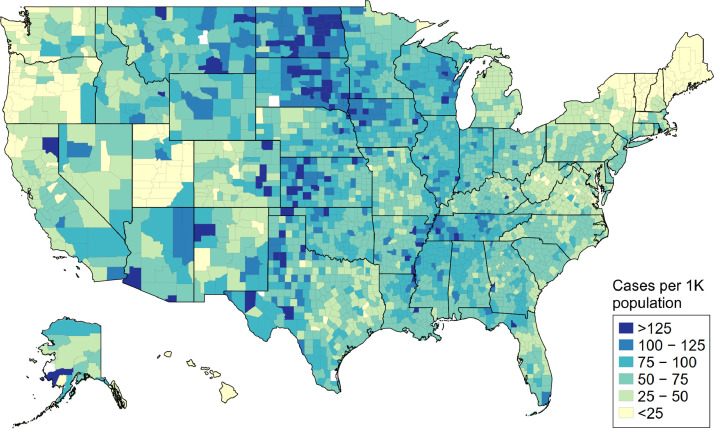
Findings: All models demonstrated excellent agreement between observed and predicted mortality during 2016-2019; a Poisson quasi-likelihood with county fixed effects minimized median squared error with a calibration slope of 1.00. Veterans of the U.S. Armed Forces faced an excess mortality rate of 13% in 2020, which corresponds to 50,299 excess deaths. County-level estimates of excess mortality were correlated with both COVID-19 cases (R2=0.77) and deaths per 1,000 population (R2=0.59).
Interpretation: We developed sub-national estimates of excess mortality associated with the pandemic and shared our data as a resource for researchers and data journalists. Despite Veterans' greater likelihood of risk factors associated with severe COVID-19 illness, their excess mortality rate was slightly lower than the general population. Consistent access to health care and the rapid expansion of VHA telemedicine during the pandemic may explain this divergence.
Funding: This work was supported by grants from the Department of Veterans Affairs Quality Enhancement Research Initiative [PEC 16-001]. Dr. Griffith's effort was supported in part by the Agency for Healthcare Research & Quality [K12 HS026395].
© 2021 The Author(s).
Conflict of interest statement
The authors have no conflicts of interest to disclose. The views expressed in this article are those of the authors and do not necessarily reflect the position or policy of the Department of Veterans Affairs, United States Government, Boston University, or Vanderbilt University.
Figures
Similar articles
-
Excess Mortality at Veterans Health Administration Facilities During the COVID-19 Pandemic.Med Care. 2023 Jul 1;61(7):456-461. doi: 10.1097/MLR.0000000000001866. Epub 2023 May 22. Med Care. 2023. PMID: 37219062 Free PMC article.
-
Excess mortality in US Veterans during the COVID-19 pandemic: an individual-level cohort study.Int J Epidemiol. 2023 Dec 25;52(6):1725-1734. doi: 10.1093/ije/dyad136. Int J Epidemiol. 2023. PMID: 37802889 Free PMC article.
-
Excess death among Latino people in California during the COVID-19 pandemic.medRxiv [Preprint]. 2021 Jan 25:2020.12.18.20248434. doi: 10.1101/2020.12.18.20248434. medRxiv. 2021. Update in: SSM Popul Health. 2021 Jul 02;15:100860. doi: 10.1016/j.ssmph.2021.100860. PMID: 33532794 Free PMC article. Updated. Preprint.
-
Systematic Review of Excess Mortality in India during the Covid-19 Pandemic with Differentiation between Model-Based and Data-Based Mortality Estimates.Indian J Community Med. 2022 Oct-Dec;47(4):491-494. doi: 10.4103/ijcm.ijcm_11_22. Epub 2022 Dec 14. Indian J Community Med. 2022. PMID: 36742946 Free PMC article. Review.
-
A systematic review of excess all-cause mortality estimation studies in India during COVID-19 pandemic.Med J Armed Forces India. 2023 Apr 15;79(5):506-15. doi: 10.1016/j.mjafi.2023.02.008. Online ahead of print. Med J Armed Forces India. 2023. PMID: 37360887 Free PMC article. Review.
Cited by
-
Associations of diabetes, hypertension and obesity with COVID-19 mortality: a systematic review and meta-analysis.BMJ Glob Health. 2023 Dec 14;8(12):e012581. doi: 10.1136/bmjgh-2023-012581. BMJ Glob Health. 2023. PMID: 38097276 Free PMC article.
-
COVID-19 and drivers of excess death rate in Peru: A longitudinal ecological study.Heliyon. 2022 Dec;8(12):e11948. doi: 10.1016/j.heliyon.2022.e11948. Epub 2022 Nov 30. Heliyon. 2022. PMID: 36466573 Free PMC article.
-
Disparities in Excess, All-Cause Mortality among Black, Hispanic, and White Veterans at the U.S. Department of Veterans Affairs during the COVID-19 Pandemic.Int J Environ Res Public Health. 2022 Feb 18;19(4):2368. doi: 10.3390/ijerph19042368. Int J Environ Res Public Health. 2022. PMID: 35206555 Free PMC article.
-
Mortality Trends in Pre-COVID-19 and COVID-19 Eras Among Oldest Veterans.J Gerontol A Biol Sci Med Sci. 2025 May 5;80(6):glaf051. doi: 10.1093/gerona/glaf051. J Gerontol A Biol Sci Med Sci. 2025. PMID: 40177974
-
An update on COVID-19: SARS-CoV-2 variants, antiviral drugs, and vaccines.Heliyon. 2023 Mar;9(3):e13952. doi: 10.1016/j.heliyon.2023.e13952. Epub 2023 Feb 23. Heliyon. 2023. PMID: 36855648 Free PMC article. Review.
References
Grants and funding
LinkOut - more resources
Full Text Sources
Research Materials
