. 2022 Mar;32(2):e13035.
doi: 10.1111/bpa.13035. Epub 2021 Nov 14.

Novel genetic variants in MAPT and alterations in tau phosphorylation in amyotrophic lateral sclerosis post-mortem motor cortex and cerebrospinal fluid

Affiliations

Novel genetic variants in MAPT and alterations in tau phosphorylation in amyotrophic lateral sclerosis post-mortem motor cortex and cerebrospinal fluid

Tiziana Petrozziello et al. Brain Pathol. 2022 Mar.

Abstract

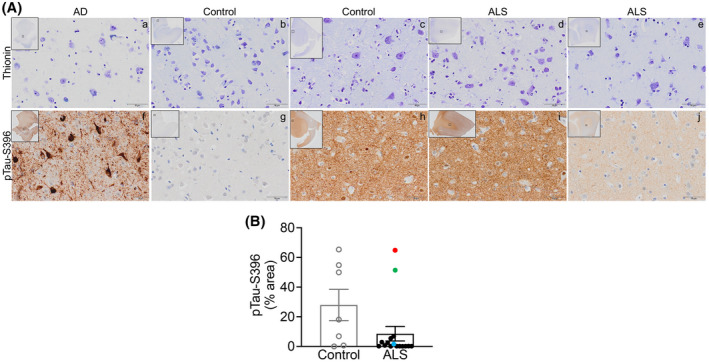
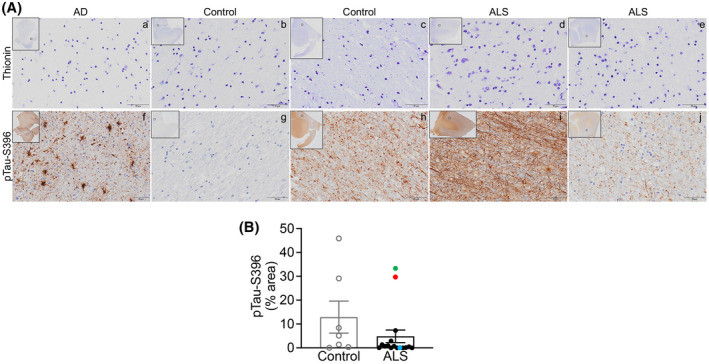
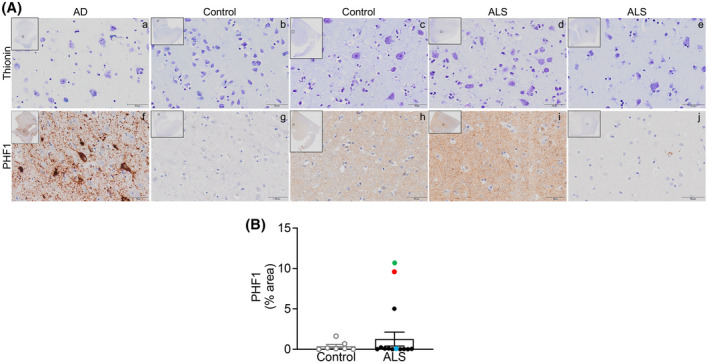
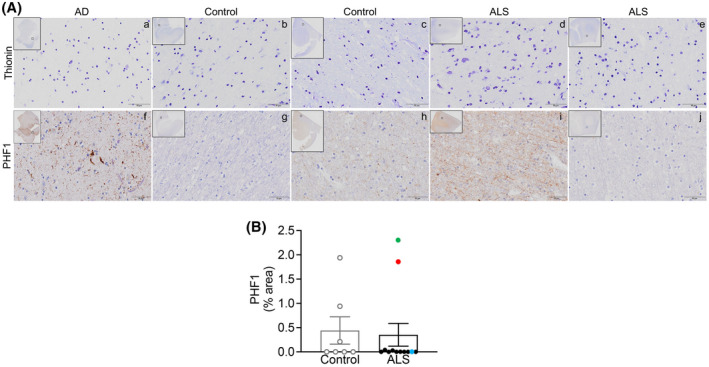
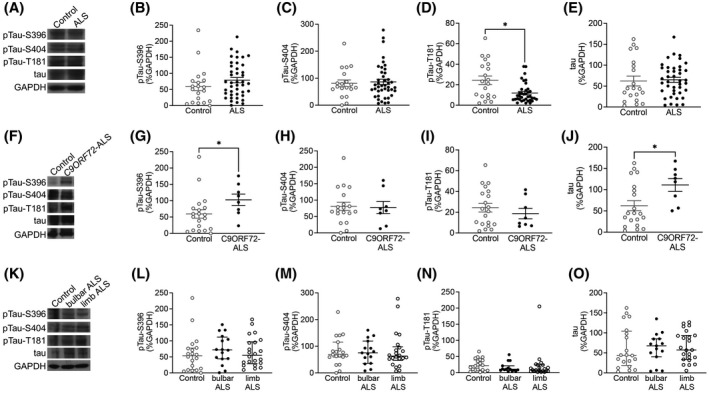
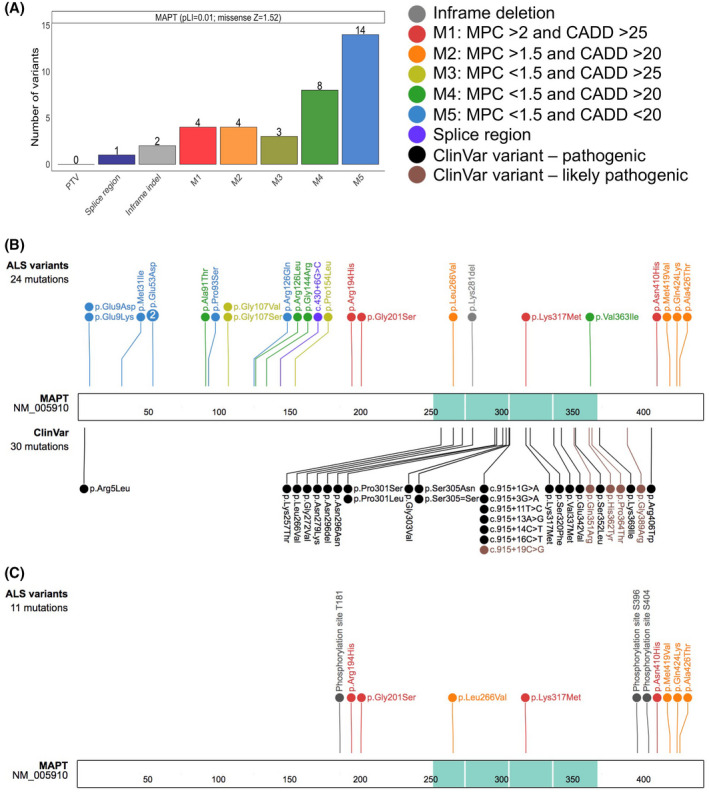
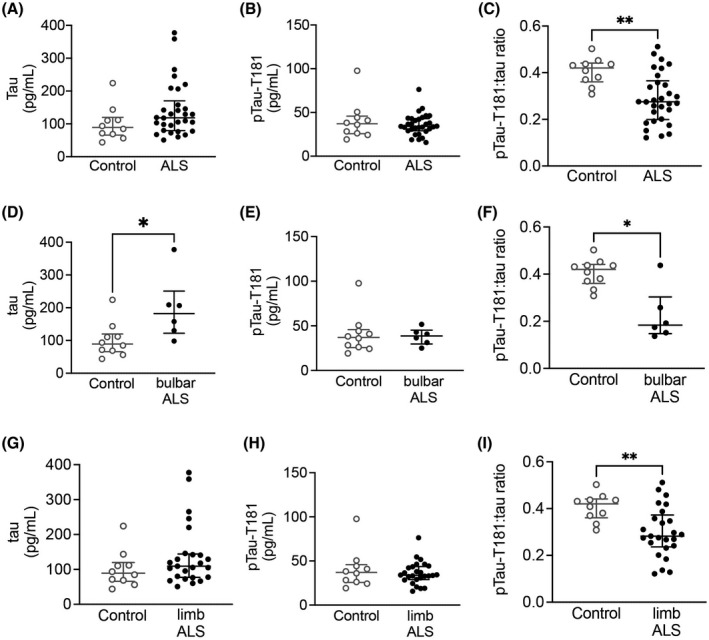
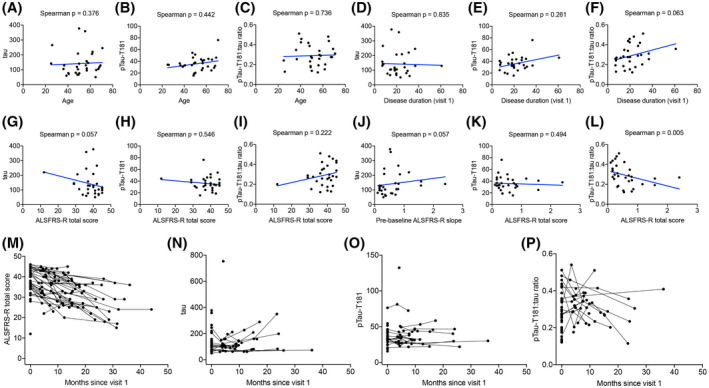
Although the molecular mechanisms underlying amyotrophic lateral sclerosis (ALS) are not yet fully understood, several studies report alterations in tau phosphorylation in both sporadic and familial ALS. Recently, we have demonstrated that phosphorylated tau at S396 (pTau-S396) is mislocalized to synapses in ALS motor cortex (mCTX) and contributes to mitochondrial dysfunction. Here, we demonstrate that while there was no overall increase in total tau, pTau-S396, and pTau-S404 in ALS post-mortem mCTX, total tau and pTau-S396 were increased in C9ORF72-ALS. Additionally, there was a significant decrease in pTau-T181 in ALS mCTX compared controls. Furthermore, we leveraged the ALS Knowledge Portal and Project MinE data sets and identified ALS-specific genetic variants across MAPT, the gene encoding tau. Lastly, assessment of cerebrospinal fluid (CSF) samples revealed a significant increase in total tau levels in bulbar-onset ALS together with a decrease in CSF pTau-T181:tau ratio in all ALS samples, as reported previously. While increases in CSF tau levels correlated with a faster disease progression as measured by the revised ALS functional rating scale (ALSFRS-R), decreases in CSF pTau-T181:tau ratio correlated with a slower disease progression, suggesting that CSF total tau and pTau-T181 ratio may serve as biomarkers of disease in ALS. Our findings highlight the potential role of pTau-T181 in ALS, as decreases in CSF pTau-T181:tau ratio may reflect the significant decrease in pTau-T181 in post-mortem mCTX. Taken together, these results indicate that tau phosphorylation is altered in ALS post-mortem mCTX as well as in CSF and, importantly, the newly described pathogenic or likely pathogenic variants identified in MAPT in this study are adjacent to T181 and S396 phosphorylation sites further highlighting the potential role of these tau functional domains in ALS.

Keywords: amyotrophic lateral sclerosis; biomarker; tau.


Conflict of interest statement

T.G.I. serves as member of a Lilly Monitoring Committee (DMC). B.T.H. is a member of Novartis, Dewpoint, and Cell Signaling Scientific Advisory Board (SAB), and of Biogen DMC, and acts as consultant for US DoJ, Takeda, Virgil, W20, and Seer; he receives grants from Abbvie, F prime, NIH, Tau consortium, Cure Alzheimer's fund, Brightfocus, and JPB foundations. S.E.A. has received honoraria and/or travel expenses for lectures from Abbvie, Eisai, and Biogen and has served on SAB of Cortexyme and vTv, and as consultant for Athira, Cassava, Cognito Therapeutics, EIP Pharma and Orthogonal Neuroscience, and has received research grant support from NIH, Alzheimer's Association, Alzheimer's Drug Discovery Foundation, Abbvie, Amylyx, EIP Pharma, Merck, Janssen/Johnson & Johnson, Novartis, and vTv. T.S.J. is on the scientific advisory board of Cognition Therapeutics and receives collaborative grant funding from European Research Council, UK Dementia Research Institute, and Autifony. M.E.C. acts as consultant for Aclipse, Mt Pharma, Immunity Pharma Ltd., Orion, Anelixis, Cytokinetics, Biohaven, Wave, Takeda, Avexis, Revelasio, Pontifax, Biogen, Denali, Helixsmith, Sunovian, Disarm, ALS Pharma, RRD, Transposon, and Quralis, and as DSBM Chair for Lilly. J.D.B. has received personal fees from Biogen, Clene Nanomedicine, and MT Pharma Holdings of America, and grant support from Alexion, Biogen, MT Pharma of America, Anelixis Therapeutics, Brainstorm Cell Therapeutics, Genentech, nQ Medical, NINDS, Muscular Dystrophy Association, ALS One, Amylyx Therapeutics, ALS Association, and ALS Finding a Cure. G.S‐V. is a consultant for MarvelBiome. None of these had any influence over the current paper.

Figures

FIGURE 1
FIGURE 1
pTau‐S396 levels are not altered in ALS post‐mortem motor cortex. (A) Top. Representative thionin immunostaining in grey matter from (a) AD EC, (b, c) control mCTX, and (d, e) ALS mCTX. Bottom. Representative pTau‐S396 immunostaining in grey matter from (f) AD EC, (g, h) control mCTX, and (i, j) ALS mCTX. (B) There was no significant change in pTau‐S396 levels in ALS mCTX (n = 16) compared with controls (n = 7) (Mann–Whitney U test = 32, p = 0.1181). Bulbar onset C9ORF72‐ALS is indicated with a red dot, limb onset C9ORF72‐ALS with a blue dot, and a single ALS case revealing brain alterations likely due to AD is indicated with a green dot. Scale bar: 50 µm
FIGURE 2
FIGURE 2
pTau‐S396 levels are not altered in ALS motor cortex white matter. (A) Top. Representative thionin immunostaining in white matter from (a) AD EC, (b, c) control mCTX, and (d, e) ALS mCTX. Bottom. Representative pTau‐S396 immunostaining in white matter from (f) AD EC, (g, h) control mCTX, and (i, j) ALS mCTX. (B) There was no significant change in pTau‐S396 levels in ALS mCTX WM (n = 16) compared with controls (n = 7) (Mann–Whitney U test = 34.50, p = 0.1574). Bulbar onset C9ORF72‐ALS is indicated with a red dot, limb onset C9ORF72‐ALS with a blue dot, and a single ALS case revealing brain alterations likely due to AD is indicated with a green dot. Scale bar: 50 µm
FIGURE 3
FIGURE 3
PHF1 levels are not altered in ALS post‐mortem motor cortex. (A) Top. Representative thionin immunostaining in grey matter from (a) AD EC, (b, c) control mCTX, and (d, e) ALS mCTX. Bottom. Representative PHF1 immunostaining in grey matter from (f) AD EC, (g, h) control mCTX, and (i, j) ALS mCTX. (B) There was no significant change in PHF1 levels in ALS mCTX (n = 12) compared with controls (n = 7) (Mann–Whitney U test = 34.50, p = 0.5483). Bulbar onset C9ORF72‐ALS is indicated with a red dot, limb onset C9ORF72‐ALS with a blue dot, and a single ALS case revealing brain alterations likely due to AD is indicated with a green dot. Scale bar: 50 µm
FIGURE 4
FIGURE 4
PHF1 levels are not altered in ALS motor cortex white matter. (A) Top. Representative thionin immunostaining in white matter from (a) AD EC, (b, c) control mCTX, and (d, e) ALS mCTX. Bottom. Representative PFH1 immunostaining in white matter from (f) AD EC, (g, h) control mCTX, and (i, j) ALS mCTX. (B) There was no significant change in PHF1 levels in WM from ALS mCTX (n = 12) compared with controls (n = 7) (Mann–Whitney U test = 39, p = 0.8068). Bulbar onset C9ORF72‐ALS is indicated with a red dot, limb onset C9ORF72‐ALS with a blue dot, and a single ALS case revealing brain alterations likely due to AD is indicated with a green dot. Scale bar: 50 µm
FIGURE 5
FIGURE 5
While pTau‐T181 levels are decreased in ALS motor cortex, pTau‐S396 and total tau levels are increased only in C9ORF72‐ALS. (A) Representative western blot images of pTau‐S396, pTau‐S404, pTau‐T181, total tau and GAPDH in control and ALS mCTX. There were no significant change in the levels of (B) pTau‐S396 (Mann–Whitney U test = 317, p = 0.1234) and (C) pTau‐S404 (Mann–Whitney U test = 396, p = 0.9665) between ALS (n = 43) and controls (n = 21). (D) pTau‐T181 levels were significantly decreased in ALS mCTX (n = 43) compared with controls (n = 21) (Mann–Whitney U test = 226.5, p = 0.0157). (E) There was no significant change in total tau levels between ALS (n = 43) and control mCTX (n = 21) (Mann–Whitney U test = 366, p = 0.5071). (F) Representative western blot images of pTau‐S396, pTau‐S404, pTau‐T181, total tau and GAPDH in control, and C9ORF72‐ALS mCTX. (G) There was a significant increase in pTau‐S396 levels in C9ORF72‐ALS (n = 8) compared with control mCTX (n = 21) (Mann–Whitney U test = 36, p = 0.0247). There were no significant changes in (H) pTau‐S404 (Mann–Whitney U test = 76, p > 0.999) and (I) pTau‐T181 levels (Mann–Whitney U test = 66, p = 0.5002) in C9ORF72‐ALS (n = 8) compared with control mCTX (n = 21). (J) There was a significant increase in total tau levels in C9ORF72‐ALS (n = 8) compared with controls (n = 21) (Mann–Whitney U test = 61, p = 0.0211). (K) Representative western blot images of pTau‐S396, pTau‐S404, pTau‐T181, total tau, and GAPDH in mCTX from control, bulbar, and limb onset ALS. There were no significant alterations in the levels of (L) pTau‐S396 (one‐way ANOVA [F(2,55) = 0.3652, p = 0.6958], (M) pTau‐S404 (one‐way ANOVA [F(2,53) = 0.02583, p = 0.9745], (N) pTau‐T181 (one‐way ANOVA [F(2,53) = 0.2965, p = 0.7447], and (O) total tau (one‐way ANOVA [F(2,55) = 0.04461, p = 0.9564] between controls (n = 21), bulbar onset ALS (n = 16), or limb onset ALS (n = 23). *p < 0.05
FIGURE 6
FIGURE 6
Protein schematic of MAPT variants observed in ALS. (A) Variant types are displayed on the X‐axis with their respective counts on the Y‐axis for the MAPT gene. The colors represent the type of non‐synonymous changes observed, and the number next to the variants, noted on top of each bar, depicts the number of individuals observed to carry the corresponding variant. The probability of loss of function (pLI) and the missense constraint Z scores for MAPT are shown adjacent to the gene label. PTV, protein truncating variant; indel, insertion/deletion; M in M1‐M5, missense. Missense variants were divided into five classes depending on their MPC (Missense badness, PolyPhen‐2, and Constraint) and CADD (Combined Annotation Dependent Depletion) deleteriousness scores. (B) Schematic representation highlighting the novel ALS MAPT variants displayed on top. Variants identified only in ALS cases were classified as “ALS unique variants,” while the variants observed in ALS cases and also at a very low allele frequency in gnomAD were classified as “ALS rare variants.” The variants displayed on the bottom were ClinVar pathogenic (black) and likely pathogenic (brown) variants. The microtubule‐binding domain is shown in turquoise. The numbers within the protein sequence depicts the amino acid position. (C) Schematic representation of the newly identified pathogenic or likely pathogenic MAPT variants in ALS together with the known phosphorylation sites at T181, S396 and S404 across tau protein
FIGURE 7
FIGURE 7
CSF pTau‐T181:tau ratio is decreased in ALS. While there was no difference in CSF (A) tau (Mann–Whitney U test = 100, p = 0.1234) and (B) pTau‐T181 (Mann–Whitney U test = 147, p = 0.8227), there was a significant decrease in (C) pTau‐T181:tau ratio (Mann–Whitney U test = 56, p = 0.0025) in ALS CSF (n = 40) compared with healthy controls (n = 10). (D) There was a significant increase in CSF tau levels in bulbar onset ALS (n = 6) (Mann–Whitney U test = 9, p = 0.0225). (E) CSF pTau‐T181 levels were not altered in bulbar onset ALS (Mann–Whitney U test = 27, p = 0.7925). (F) CSF pTau‐T181:tau ratio was significantly decreased in bulbar onset ALS (Mann–Whitney U test = 7, p = 0.0110). (G) CSF tau (Mann–Whitney U test = 91, p = 0.2253) and (H) pTau‐T181 levels (Mann–Whitney U test = 123, p = 0.8214) were not altered in limb onset ALS (n = 25). (I) There was a significant decrease in pTau‐T181:tau ratio in limb onset ALS (Mann–Whitney U test = 49, p = 0.0045). *p < 0.05; **p < 0.01
FIGURE 8
FIGURE 8
CSF pTau‐T181:tau ratio correlates with ALS duration and progression. There was no correlation between CSF (A) tau (Spearman correlation, p = 0.376), (B) pTau‐T181 (Spearman correlation, p = 0.442), or (C) pTau‐T181:tau ratio (Spearman correlation, p = 0.736) and the age at first visit. (D) CSF tau (Spearman correlation, p = 0.835) and (E) pTau‐T181 levels (Spearman test, p = 0.261) did not correlate with ALS disease duration. (F) There was a trend toward a significant correlation between CSF pTau‐T181:tau ratio and ALS disease duration (Spearman correlation, p = 0.063). (G) There was a trend toward a significant inverse correlation between CSF tau and ALSFRS‐R (Spearman correlation, p = 0.057). (H) There was no correlation between CSF pTau‐T181 and ALSFRS‐R (Spearman correlation, p = 0.546). (I) There was no correlation with CSF pTau‐T181:tau ratio and ALSFRS‐R (Spearman correlation, p = 0.222). (J) There was a trend toward a negative correlation between CSF tau and ALSFRS‐R slope (Spearman correlation, p = 0.057). (K) There was no correlation between CSF pTau‐T181 and ALSFRS‐R slope (Spearman correlation, p = 0.494). (L) There was a positive correlation between CSF pTau‐T181:tau ratio and ALSFRS‐R slope (Spearman correlation, p = 0.005). (M) There was a significant decline in ALSFRS‐R over time (p < 0.001). There was no significant alterations in CSF (N) tau (p = 0.907), (O) pTau‐T181 (p = 0.222), and (P) pTau‐T181:tau ratio (p = 0.578)

Similar articles

  • Targeting Tau Mitigates Mitochondrial Fragmentation and Oxidative Stress in Amyotrophic Lateral Sclerosis.
    Petrozziello T, Bordt EA, Mills AN, Kim SE, Sapp E, Devlin BA, Obeng-Marnu AA, Farhan SMK, Amaral AC, Dujardin S, Dooley PM, Henstridge C, Oakley DH, Neueder A, Hyman BT, Spires-Jones TL, Bilbo SD, Vakili K, Cudkowicz ME, Berry JD, DiFiglia M, Silva MC, Haggarty SJ, Sadri-Vakili G. Petrozziello T, et al. Mol Neurobiol. 2022 Jan;59(1):683-702. doi: 10.1007/s12035-021-02557-w. Epub 2021 Nov 10. Mol Neurobiol. 2022. PMID: 34757590
  • Plasma tau and phosphorylated tau at T181 are altered in amyotrophic lateral sclerosis.
    Petrozziello T, Mizerak E, Krishnamoorthy A, Donahue RA, Castillo Torres AL, Monsanto RZB, Hammerschlag BL, Fillingham B, Kivisäkk P, Timmons J, Fox K, Arnold SE, Cohen J, Klee J, Paganoni S, Cudkowicz ME, Chibnik LB, Berry JD, Sadri-Vakili G. Petrozziello T, et al. medRxiv [Preprint]. 2025 Jun 27:2025.06.26.25330363. doi: 10.1101/2025.06.26.25330363. medRxiv. 2025. PMID: 40666341 Free PMC article. Preprint.
  • Significance of CSF NfL and tau in ALS.
    Schreiber S, Spotorno N, Schreiber F, Acosta-Cabronero J, Kaufmann J, Machts J, Debska-Vielhaber G, Garz C, Bittner D, Hensiek N, Dengler R, Petri S, Nestor PJ, Vielhaber S. Schreiber S, et al. J Neurol. 2018 Nov;265(11):2633-2645. doi: 10.1007/s00415-018-9043-0. Epub 2018 Sep 5. J Neurol. 2018. PMID: 30187162
  • CSF markers in amyotrophic lateral sclerosis.
    Tarasiuk J, Kułakowska A, Drozdowski W, Kornhuber J, Lewczuk P. Tarasiuk J, et al. J Neural Transm (Vienna). 2012 Jul;119(7):747-57. doi: 10.1007/s00702-012-0806-y. Epub 2012 May 4. J Neural Transm (Vienna). 2012. PMID: 22555610 Review.
  • Biochemical markers in CSF of ALS patients.
    Süssmuth SD, Brettschneider J, Ludolph AC, Tumani H. Süssmuth SD, et al. Curr Med Chem. 2008;15(18):1788-801. doi: 10.2174/092986708785133031. Curr Med Chem. 2008. PMID: 18691039 Review.

Cited by

References

    1. Brown RH Jr, Al‐Chalabi A. Amyotrophic lateral sclerosis. N Engl J Med. 2017;377:1602. - PubMed
    1. Kim G, Gautier O, Tassoni‐Tsuchida E, Ma XR, Gitler AD. ALS genetics: gains, losses, and implications for future therapies. Neuron. 2020;108(5):822–942. - PMC - PubMed
    1. Nakamura S, Wate R, Kaneko S, Ito H, Oki M, Tsuge A, et al. An autopsy case of sporadic amyotrophic lateral sclerosis associated with the I113T SOD1 mutation. Neuropathology. 2014;34:58–63. - PubMed
    1. Takeuchi R, Toyoshima Y, Tada M, Tanaka H, Shimizu H, Shiga A, et al. Globular glial mixed four repeat tau and TDP‐43 proteinopathy with motor neuron disease and frontotemporal dementia. Brain Pathol. 2016;26:82–94. - PMC - PubMed
    1. Bodakuntla S, Jijumon AS, Villablanca C, Gonzalez‐Billault C, Janke C, et al. Microtubule‐associated proteins: structuring the cytoskeleton. Trends Cell Biol. 2019;29:804–19. - PubMed

Publication types