. 2021 Nov 15:10:e68584.
doi: 10.7554/eLife.68584.

Neural control of growth and size in the axolotl limb regenerate

Affiliations

Neural control of growth and size in the axolotl limb regenerate

Kaylee M Wells et al. Elife. .

Abstract

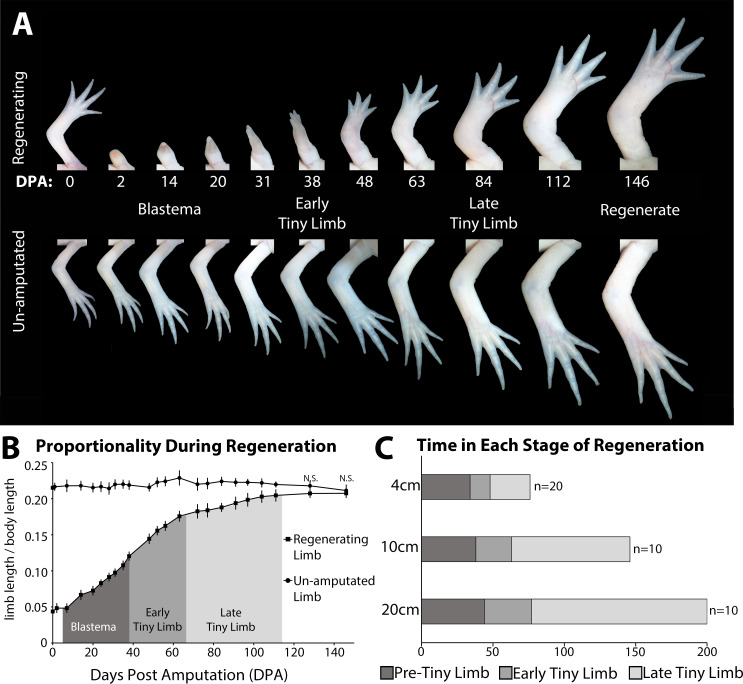
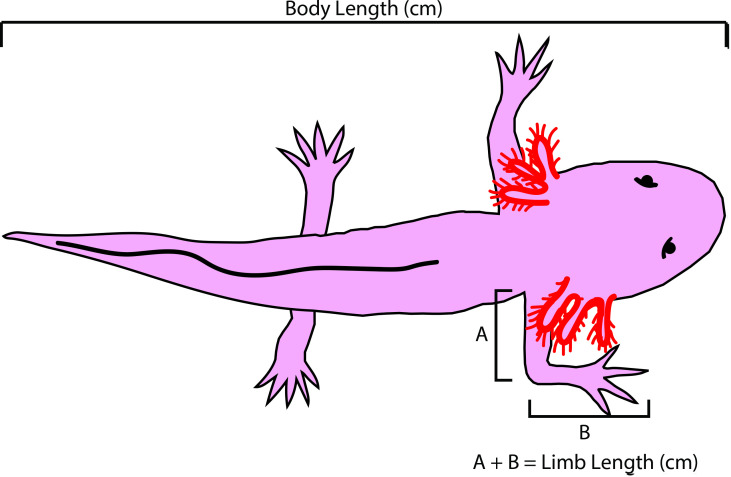
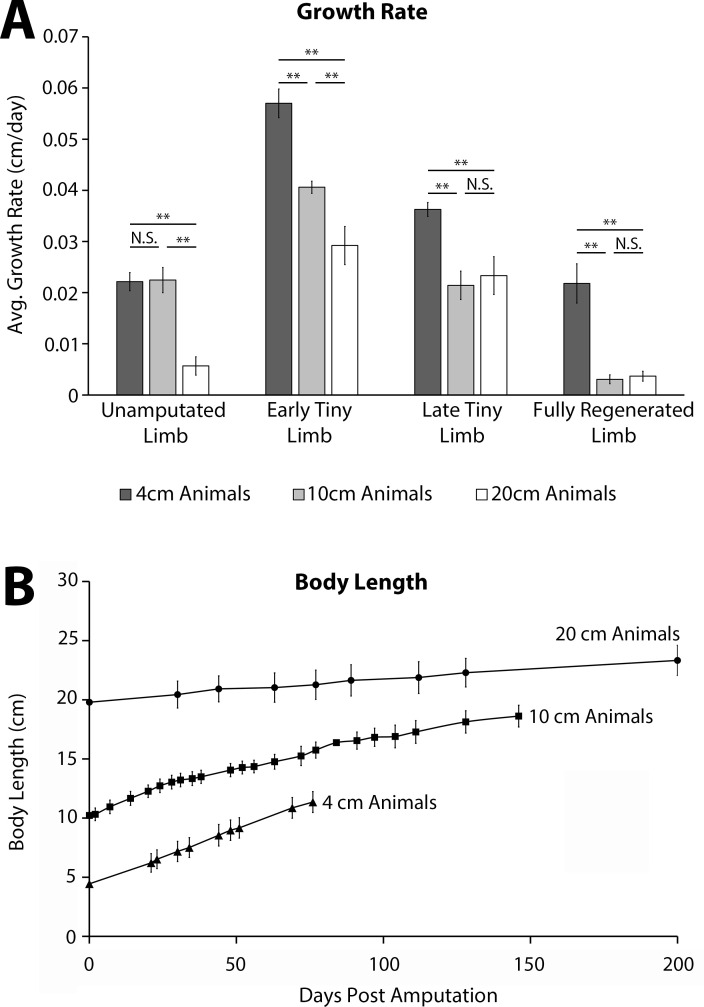
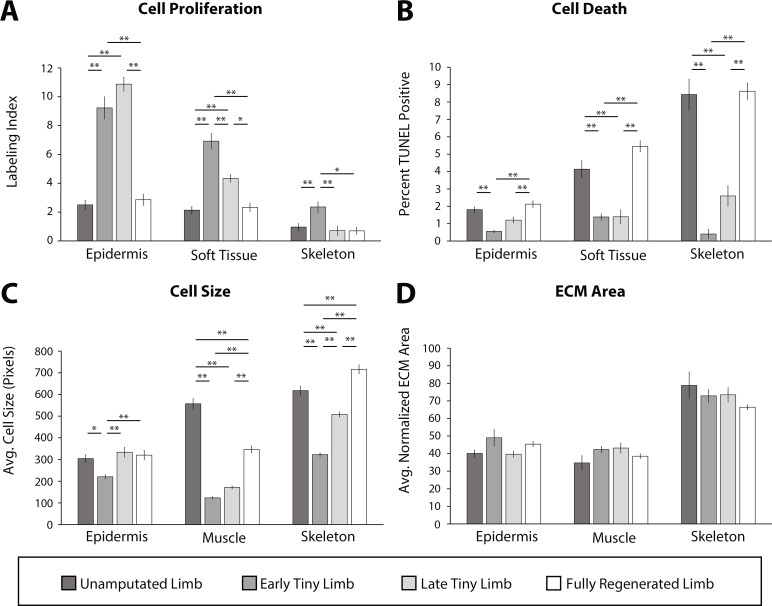
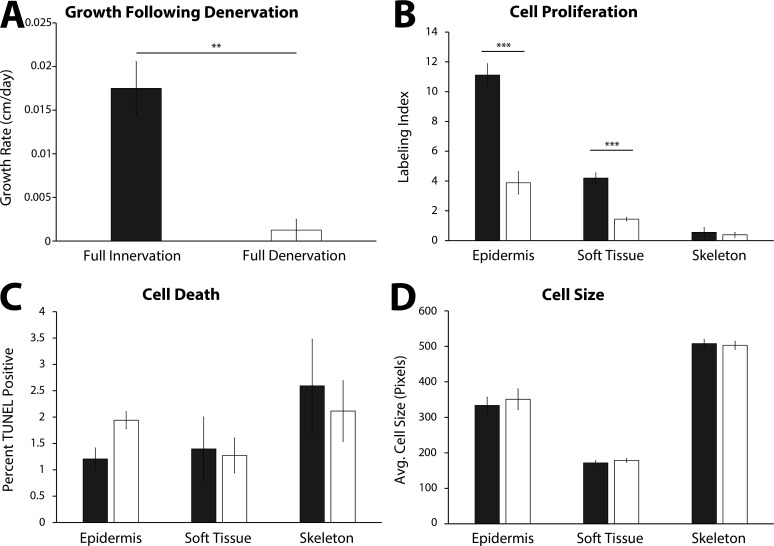
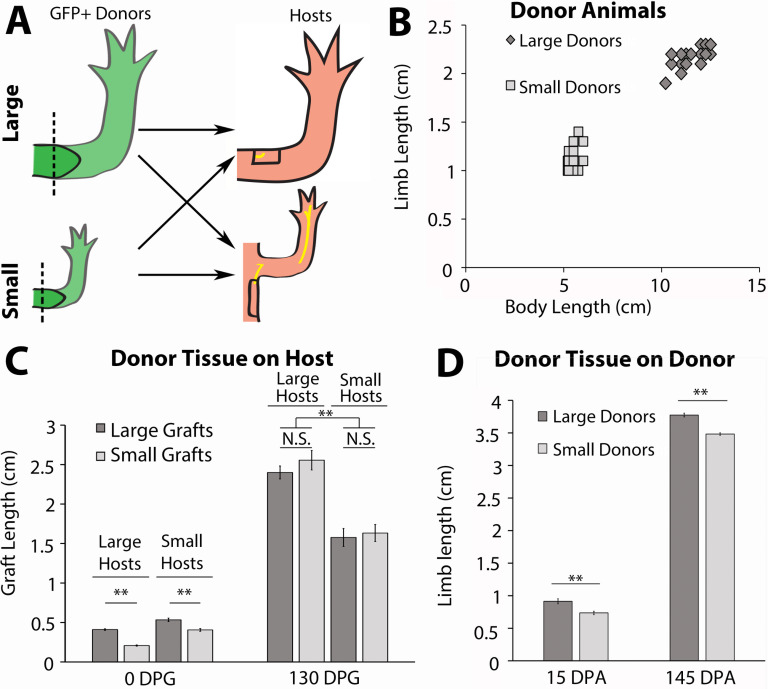
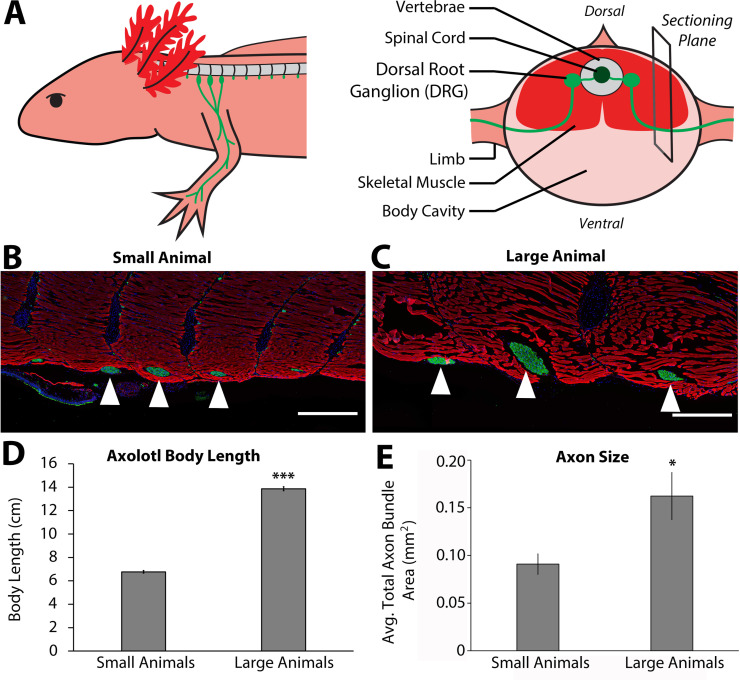
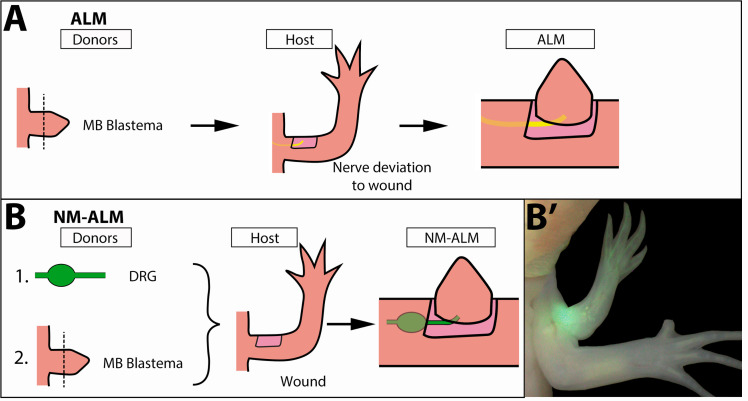
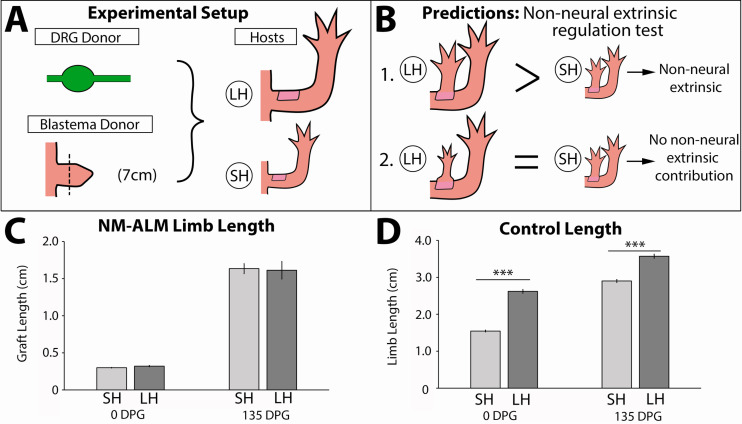
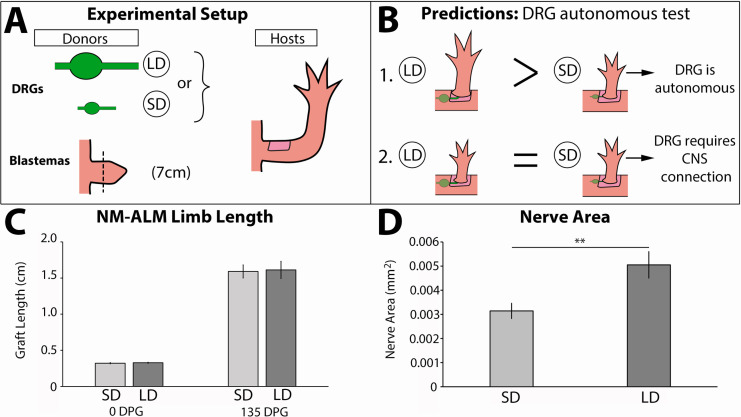
The mechanisms that regulate growth and size of the regenerating limb in tetrapods such as the Mexican axolotl are unknown. Upon the completion of the developmental stages of regeneration, when the regenerative organ known as the blastema completes patterning and differentiation, the limb regenerate is proportionally small in size. It then undergoes a phase of regeneration that we have called the 'tiny-limb' stage, which is defined by rapid growth until the regenerate reaches the proportionally appropriate size. In the current study we have characterized this growth and have found that signaling from the limb nerves is required for its maintenance. Using the regenerative assay known as the accessory limb model (ALM), we have found that growth and size of the limb positively correlates with nerve abundance. We have additionally developed a new regenerative assay called the neural modified-ALM (NM-ALM), which decouples the source of the nerves from the regenerating host environment. Using the NM-ALM we discovered that non-neural extrinsic factors from differently sized host animals do not play a prominent role in determining the size of the regenerating limb. We have also discovered that the regulation of limb size is not autonomously regulated by the limb nerves. Together, these observations show that the limb nerves provide essential cues to regulate ontogenetic allometric growth and the final size of the regenerating limb.

Keywords: axolotl; developmental biology; limb regeneration; neural control; proportionality; regenerative medicine; size regulation; stem cells.

Plain language summary

Humans’ ability to regrow lost or damaged body parts is relatively limited, but some animals, such as the axolotl (a Mexican salamander), can regenerate complex body parts, like legs, many times over their lives. Studying regeneration in these animals could help researchers enhance humans’ abilities to heal. One way to do this is using the Accessory Limb Model (ALM), where scientists wound an axolotl’s leg, and study the additional leg that grows from the wound. The first stage of limb regeneration creates a new leg that has the right structure and shape. The new leg is very small so the next phase involves growing the leg until its size matches the rest of the animal. This phase must be controlled so that the limb stops growing when it reaches the right size, but how this regulation works is unclear. Previous research suggests that the number of nerves in the new leg could be important. Wells et al. used a ALM to study how the size of regenerating limbs is controlled. They found that changing the number of nerves connected to the new leg altered its size, with more nerves leading to a larger leg. Next, Wells et al. created a system that used transplanted nerve bundles of different sizes to grow new legs in different sized axolotls. This showed that the size of the resulting leg is controlled by the number of nerves connecting it to the CNS. Wells et al. also showed that nerves can only control regeneration if they remain connected to the central nervous system. These results explain how size is controlled during limb regeneration in axolotls, highlighting the fact that regrowth is directly controlled by the number of nerves connected to a regenerating leg. Much more work is needed to reveal the details of this process and the signals nerves use to control growth. It will also be important to determine whether this control system is exclusive to axolotls, or whether other animals also use it.


Conflict of interest statement

KW, KK, MB, WV, CM No competing interests declared

Figures

Figure 1.
Figure 1.. The tiny limb grows at an increased rate compared to an unamputated limb.
(A) Time course of growth in amputated (top panel) and the contralateral non-amputated (lower panel) limbs on a 10 cm animal over 146 days. (B) The ratio of limb to body length in regenerating and unamputated limbs was measured over time (10 cm animals; n = 10). We have separated the growth of the limb regenerate into three stages: the blastema stage (dark gray), the early tiny limb stage (medium gray), and the late tiny limb stage (light gray). Error bars = standard deviation. t-Test was used to evaluate significance between the regenerating and uninjured limb size at each time point. All data points not marked with N.S. had p-values less than 0.005. (C) Histogram showing the average amount of time in days that the regenerating limb is in each growth stage for animals of different sizes (4, 10, and 20 cm in length).
Figure 1—figure supplement 1.
Figure 1—figure supplement 1.. Axolotl size measurements.
Body length is measured from snout to tail tip. Limb length is measured by measuring from the limb/trunk junction to the elbow (A) and then from the elbow to the tip of the longest digit (B). All measurements are recorded in centimeter (cm).
Figure 1—figure supplement 2.
Figure 1—figure supplement 2.. Animal size corresponds with growth rate during limb regeneration.
(A) Limb growth rates over the first 7 days of each growth phase were quantified using limb length measurements on unamputated limbs, early tiny limbs, late tiny limbs, and fully regenerated limbs of 4 cm (n = 20), 10 cm (n = 10), and 20 cm animals (n = 10). The body length represents their size at the time of amputation. Error bars = SEM. p-Values calculated by ANOVA and the Tukey post hoc test. * = p < 0.05 ** = p < 0.005. (B) Body length measurements of 4 cm (n = 20), 10 cm (n = 10), and 20 cm animals (n = 10) over time. Error bars = standard deviation. The body length represents their size at the time of amputation.
Figure 2.
Figure 2.. Tiny limb staged regenerates have increased proliferation, decreased cell death, and smaller cell sizes than uninjured or completely regenerated limbs.
Transverse sections through the zeugopod of limbs at different stages of regeneration were analyzed for cell proliferation (A), cell death (B), cell size (C), and extracellular matrix (ECM) size (D). (A and B) Cell proliferation and death were analyzed in the epidermis, soft tissue, and skeletal elements. (A) Cell proliferation was analyzed by EdU labeling (n = 5). (B) Cell death was analyzed using TUNEL labeling (n = 4). (C and D) Cell and ECM size measurements were quantified in the epidermis, muscle, and skeletal elements. (C) Cell size was quantified using fluorescently tagged wheat germ agglutinin (plasma membrane) for epidermal and muscular analysis and Alcian blue staining (collagen) for skeletal analysis (n = 4). (D) ECM area was calculated by [(tissue area – cellular area)/tissue area] (n = 4). Error bars = SEM. p-Values calculated by ANOVA and the Tukey post hoc test. * = p < 0.05 ** = p < 0.005.
Figure 2—figure supplement 1.
Figure 2—figure supplement 1.. Measurement of cell and extracellular matrix (ECM) size.
Cell size and ECM area were quantified using 7 μm cross sections through the zeugopod. Skeletal tissue was analyzed using the histology stain of hematoxylin, eosin, and Alcian blue. The epidermis and muscle (represented) were analyzed using fluorescent stains of wheat germ agglutinin (WGA – magenta) and DAPI (blue). (A) Average cell size was quantified by measuring the area of nucleated cells. (B) Normalized ECM area was quantified by finding the sum of all the cellular area in a tissue. The sum was then subtracted from the total tissue area (red arrow indicating tissue boarder) and divided by the total tissue area to provide the normalized ECM area.
Figure 3.
Figure 3.. The tiny limb staged regenerate has increased relative nerve abundance.
(A) Fluorescent images were obtained of transverse sections of uninjured, early, and late tiny limb stages, and fully regenerated limbs (DAPI = blue, phalloidin (for actin filaments) = red, acetylated tubulin (for nerves) = green; scale bars are 1000 µm). (B) Nerve area relative to total limb area was quantified from the sections represented in A (n = 5). Error bars = SEM. p-Values calculated by ANOVA and the Tukey post hoc test. * = p < 0.05 ** = p < 0.005.
Figure 3—figure supplement 1.
Figure 3—figure supplement 1.. Absolute abundance of nerves in different staged regenerates.
Total nerve area was quantified from transvers limb sections of unamputated limbs, early tiny limbs, late tiny limbs, and fully regenerated limbs (n = 5). Error bars = SEM. p-Values calculated by ANOVA and the Tukey post hoc test. * = p < 0.05 ** = p < 0.005.
Figure 4.
Figure 4.. The effect of denervation on the growth of the tiny limb staged regenerate.
(A) Dorsal root ganglia (DRGs) 3, 4, and 5 (green dots) are located lateral to the spinal column and their nerve bundles (green lines) feed into the forelimbs. Limbs were amputated and permitted to regenerate to the early tiny limb stage, at which point, either a mock, partial (1/3 = DRG 5 or 2/3 = DRGs 4 and 5), or full denervation (represented) was performed by severing (blue line) and removing sections of the nerve bundles. Limbs were collected 4 days post denervation, and growth rate (B), cell proliferation (C), cell death (D), and cell size (E) were analyzed for limbs with mock denervations (n = 6), 1/3 denervations (n = 5), 2/3 denervations (n = 5), and full denervations (n = 6). The color of the bars in panels C–E refers to the color of the bars in panel B. Error bars = SEM. p-Values calculated by ANOVA and the Tukey post hoc test. * = p < 0.05 ** = p < 0.005.
Figure 4—figure supplement 1.
Figure 4—figure supplement 1.. Impact of denervation on the growth characteristics of the late tiny limb (LTL) staged regenerate.
Amputated limbs were permitted to regenerate to the late tiny limb stage, at which point they underwent either a mock denervation (dark gray, n = 5) or a full denervation (white, n = 5). The limbs were collected and analyzed 4 days post denervation for growth rate (A), cell proliferation (B), cell death (C), and cell size (D) as previously described. Error bars = SEM. p-Values calculated by paired t-test. ** = p < 0.005 *** = p < 0.0005.
Figure 5.
Figure 5.. Host size correlates with the final size for the regenerated limb in the accessory limb model (ALM) assay.
(A) Blastemas with approximately 2 mm of stump tissue from large and small GFP+ donor animals were grafted onto a regenerative permissive environment, a wound site with a deviated limb nerve bundle, on large or small host animals. (B) Limb length and body length were measured on the GFP+ donor animals. (C) The regenerating grafted tissues were measured at 0 and 130 days post graft (DPG). Blastemas from large donors (dark gray) were grafted onto large (n = 7) and small (n = 9) host animals, and blastemas from small donors (light gray) were grafted onto large (n = 9) and small (n = 10) host animals. (D) The regenerating large (n = 10) and small (n = 20) animal donor limbs were measured at 15- and 145 days post amputation. Error bars = SEM. p-Values calculated by ANOVA and the Tukey post hoc test. * = p < 0.05 ** = p < 0.005.
Figure 5—figure supplement 1.
Figure 5—figure supplement 1.. Size of nerve bundles in the peripheral nervous system correlate with animal size.
(A) Three spinal dorsal root ganglia (DRGs) (3, 4, and 5, light green) extend through the spinal skeletal muscle (red) and enter the limb. The right panel shows that the sectioning plane for B and C is located at the point where the limb-bound axon bundles emerge from the skeletal muscle. (B–C) Representative immunofluorescent images of sections where the limb axon bundles (anti-acetylated tubulin antibodies – green) are emerging from the skeletal muscle (rhodamine phalloidin – red) and co-stained with DAPI (blue) in both small (n = 4, B) and large (n = 3, C) animals. Scale bars = 500 μm. White triangles indicate limb-bound axon bundles from DRGs 3, 4, and 5 (from left to right). (D) Body length, snout to tail tip was measured on small (n = 4) and large (n = 3) animals, and the average length is represented in the graph. (E) The cross-sectional area of the nerve bundles was quantified in millimeters squared, and the averages of the sum of the three axon bundles are represented in E. The large animals (n = 3) have a significantly larger cross-sectional area than the small animals (n = 4). Error bars = SEM. p-Values calculated by t-tests. * = p < 0.05 *** = p < 0.0005.
Figure 5—figure supplement 2.
Figure 5—figure supplement 2.. Growth of grafted limbs in accessory limb models (ALMs) and neural-modified ALMs (NM-ALMs).
(A) The ectopic limbs on the large and small host animals, generated from large and small blastema donor animals via traditional ALM surgery, were measured over time from 0 to 130 days post grafting. (B) The ectopic limbs on the large and small host animals, generated from large and small dorsal root ganglia (DRG) donor animals via NM-ALM surgery, were measured over time from 0 to 135 days post grafting. Error bars = SEM. p-Values calculated by ANOVA and the Tukey post hoc test. ** = p < 0.005. Statistical comparisons were made between the limbs on the differently sized host animals.
Figure 6.
Figure 6.. Decoupling host environment with nerve abundance using the neural-modified accessory limb model (NM-ALM).
(A) The traditional ALM (as used in Figure 5) requires a blastema donor and a host animal with a nerve bundle deviated to the wound site. (B) The NM-ALM requires a GFP+ dorsal root ganglia (DRG) donor, blastema donor, and host limb with a wound site. (B’) The DRG’s GFP+ axons regenerate and innervate the ectopic limb.
Figure 7.
Figure 7.. Regenerate scaling is not impacted by non-neural extrinsic factors in the neural-modified accessory limb model (NM-ALM).
(A) Dorsal root ganglia (DRGs) from GFP+ donor animals (~14 cm) were grafted into wound sites on large (~14 cm, n = 12) and small (~7 cm, n = 19) host animals followed by mid-bud blastemas from (~7 cm) donor animals. (B) If non-neural extrinsic factors play an instructive role in size regulation, then the large host animals would produce a larger ectopic limb than those on the small host animal. If non-neural factors do not play an instructive role, then the ectopic limbs will be the same size, regardless of host size. (C) The ectopic limb lengths were the same size at 0 day post graft (DPG) and remained the same throughout regeneration (135 DPG). (D) The unamputated limbs on the control animals remained different sizes throughout the course of the experiment (n = 10). Error bars = SEM. p-Values calculated by t-tests. *** = p < 0.0005.
Figure 8.
Figure 8.. Neurons lose the ability to regulate allometric growth in the neural-modified accessory limb model (NM-ALM).
(A) Dorsal root ganglia (DRGs) from large (~14 cm, n = 12) and small (~7 cm, n = 16) GFP+ animals were grafted into wound sites on host animals (~14 cm) followed by mid-bud blastemas from (~7 cm) donor animals. (B) If the ability to regulate size is autonomous to the DRGs, the DRGs from large animals will produce larger ectopic limbs than those from small animals. If size regulation is not autonomous, there will be no difference in ectopic limb size between grafts supplied by large or small animal DRGs. (C) The ectopic limb lengths were the same size at 0 day post graft (DPG) and remained the same throughout regeneration (135 DPG). Error bars = SEM. p-Values calculated by t-tests. (D) GFP+ innervation abundance was quantified in transverse sections of the ectopic limbs, showing significantly more nerve area (mm2) in the NM-ALMs grafted with DRGs from large donors compared to small donors (n = 5). Error bars = SEM. p-value = 0.0079, calculated by Mann-Whitney test.

Comment in

  • A matter of nerves.
    Duerr TJ, Monaghan JR. Duerr TJ, et al. Elife. 2021 Dec 23;10:e75629. doi: 10.7554/eLife.75629. Elife. 2021. PMID: 34939564 Free PMC article.

References

    1. Ağırdil Y. The growth plate: a physiologic overview. EFORT Open Reviews. 2020;5:498–507. doi: 10.1302/2058-5241.5.190088. - DOI - PMC - PubMed
    1. Aizawa R, Yamada A, Suzuki D, Iimura T, Kassai H, Harada T, Tsukasaki M, Yamamoto G, Tachikawa T, Nakao K, Yamamoto M, Yamaguchi A, Aiba A, Kamijo R. Cdc42 is required for chondrogenesis and interdigital programmed cell death during limb development. Mechanisms of Development. 2012;129:38–50. doi: 10.1016/j.mod.2012.02.002. - DOI - PubMed
    1. Bain JR, DeMatteo C, Gjertsen D, Packham T, Galea V, Harper JA. Limb length differences after obstetrical brachial plexus injury: a growing concern. Plastic and Reconstructive Surgery. 2012;130:558e–571e. doi: 10.1097/PRS.0b013e318262f26b. - DOI - PubMed
    1. Barna M, Hawe N, Niswander L, Pandolfi PP. Plzf regulates limb and axial skeletal patterning. Nature Genetics. 2000;25:166–172. doi: 10.1038/76014. - DOI - PubMed
    1. Bhattacharyya S, Feferman L, Tobacman JK. Regulation of chondroitin-4-sulfotransferase (CHST11) expression by opposing effects of arylsulfatase B on BMP4 and Wnt9A. Biochimica et Biophysica Acta. 2015;1849:342–352. doi: 10.1016/j.bbagrm.2014.12.009. - DOI - PMC - PubMed

Publication types