

Dynamic contrast-enhanced CEST MRI using a low molecular weight dextran
- PMID: 34779550
- PMCID: PMC8828685
- DOI: 10.1002/nbm.4649
Dynamic contrast-enhanced CEST MRI using a low molecular weight dextran
Abstract
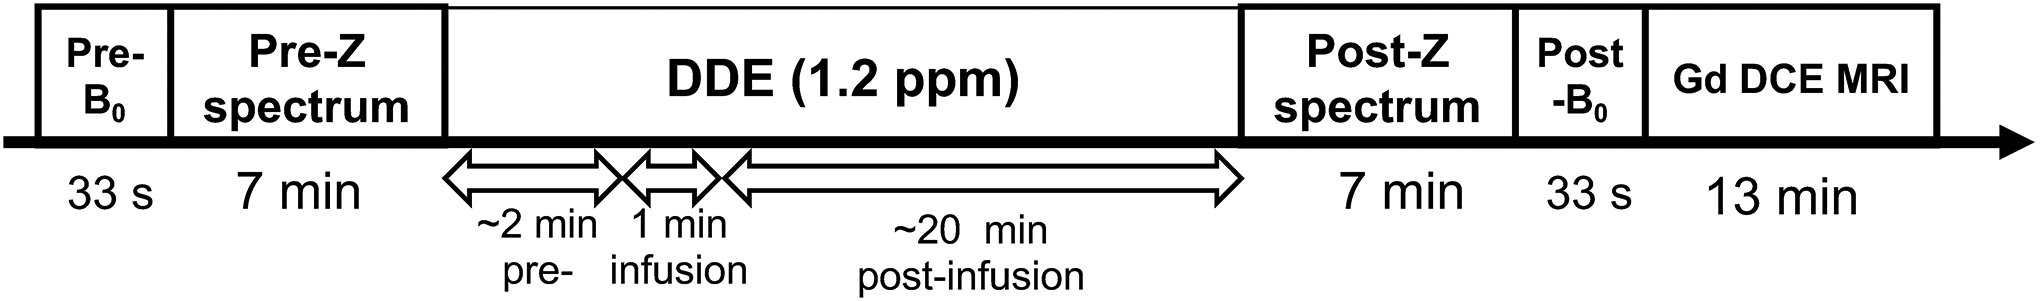
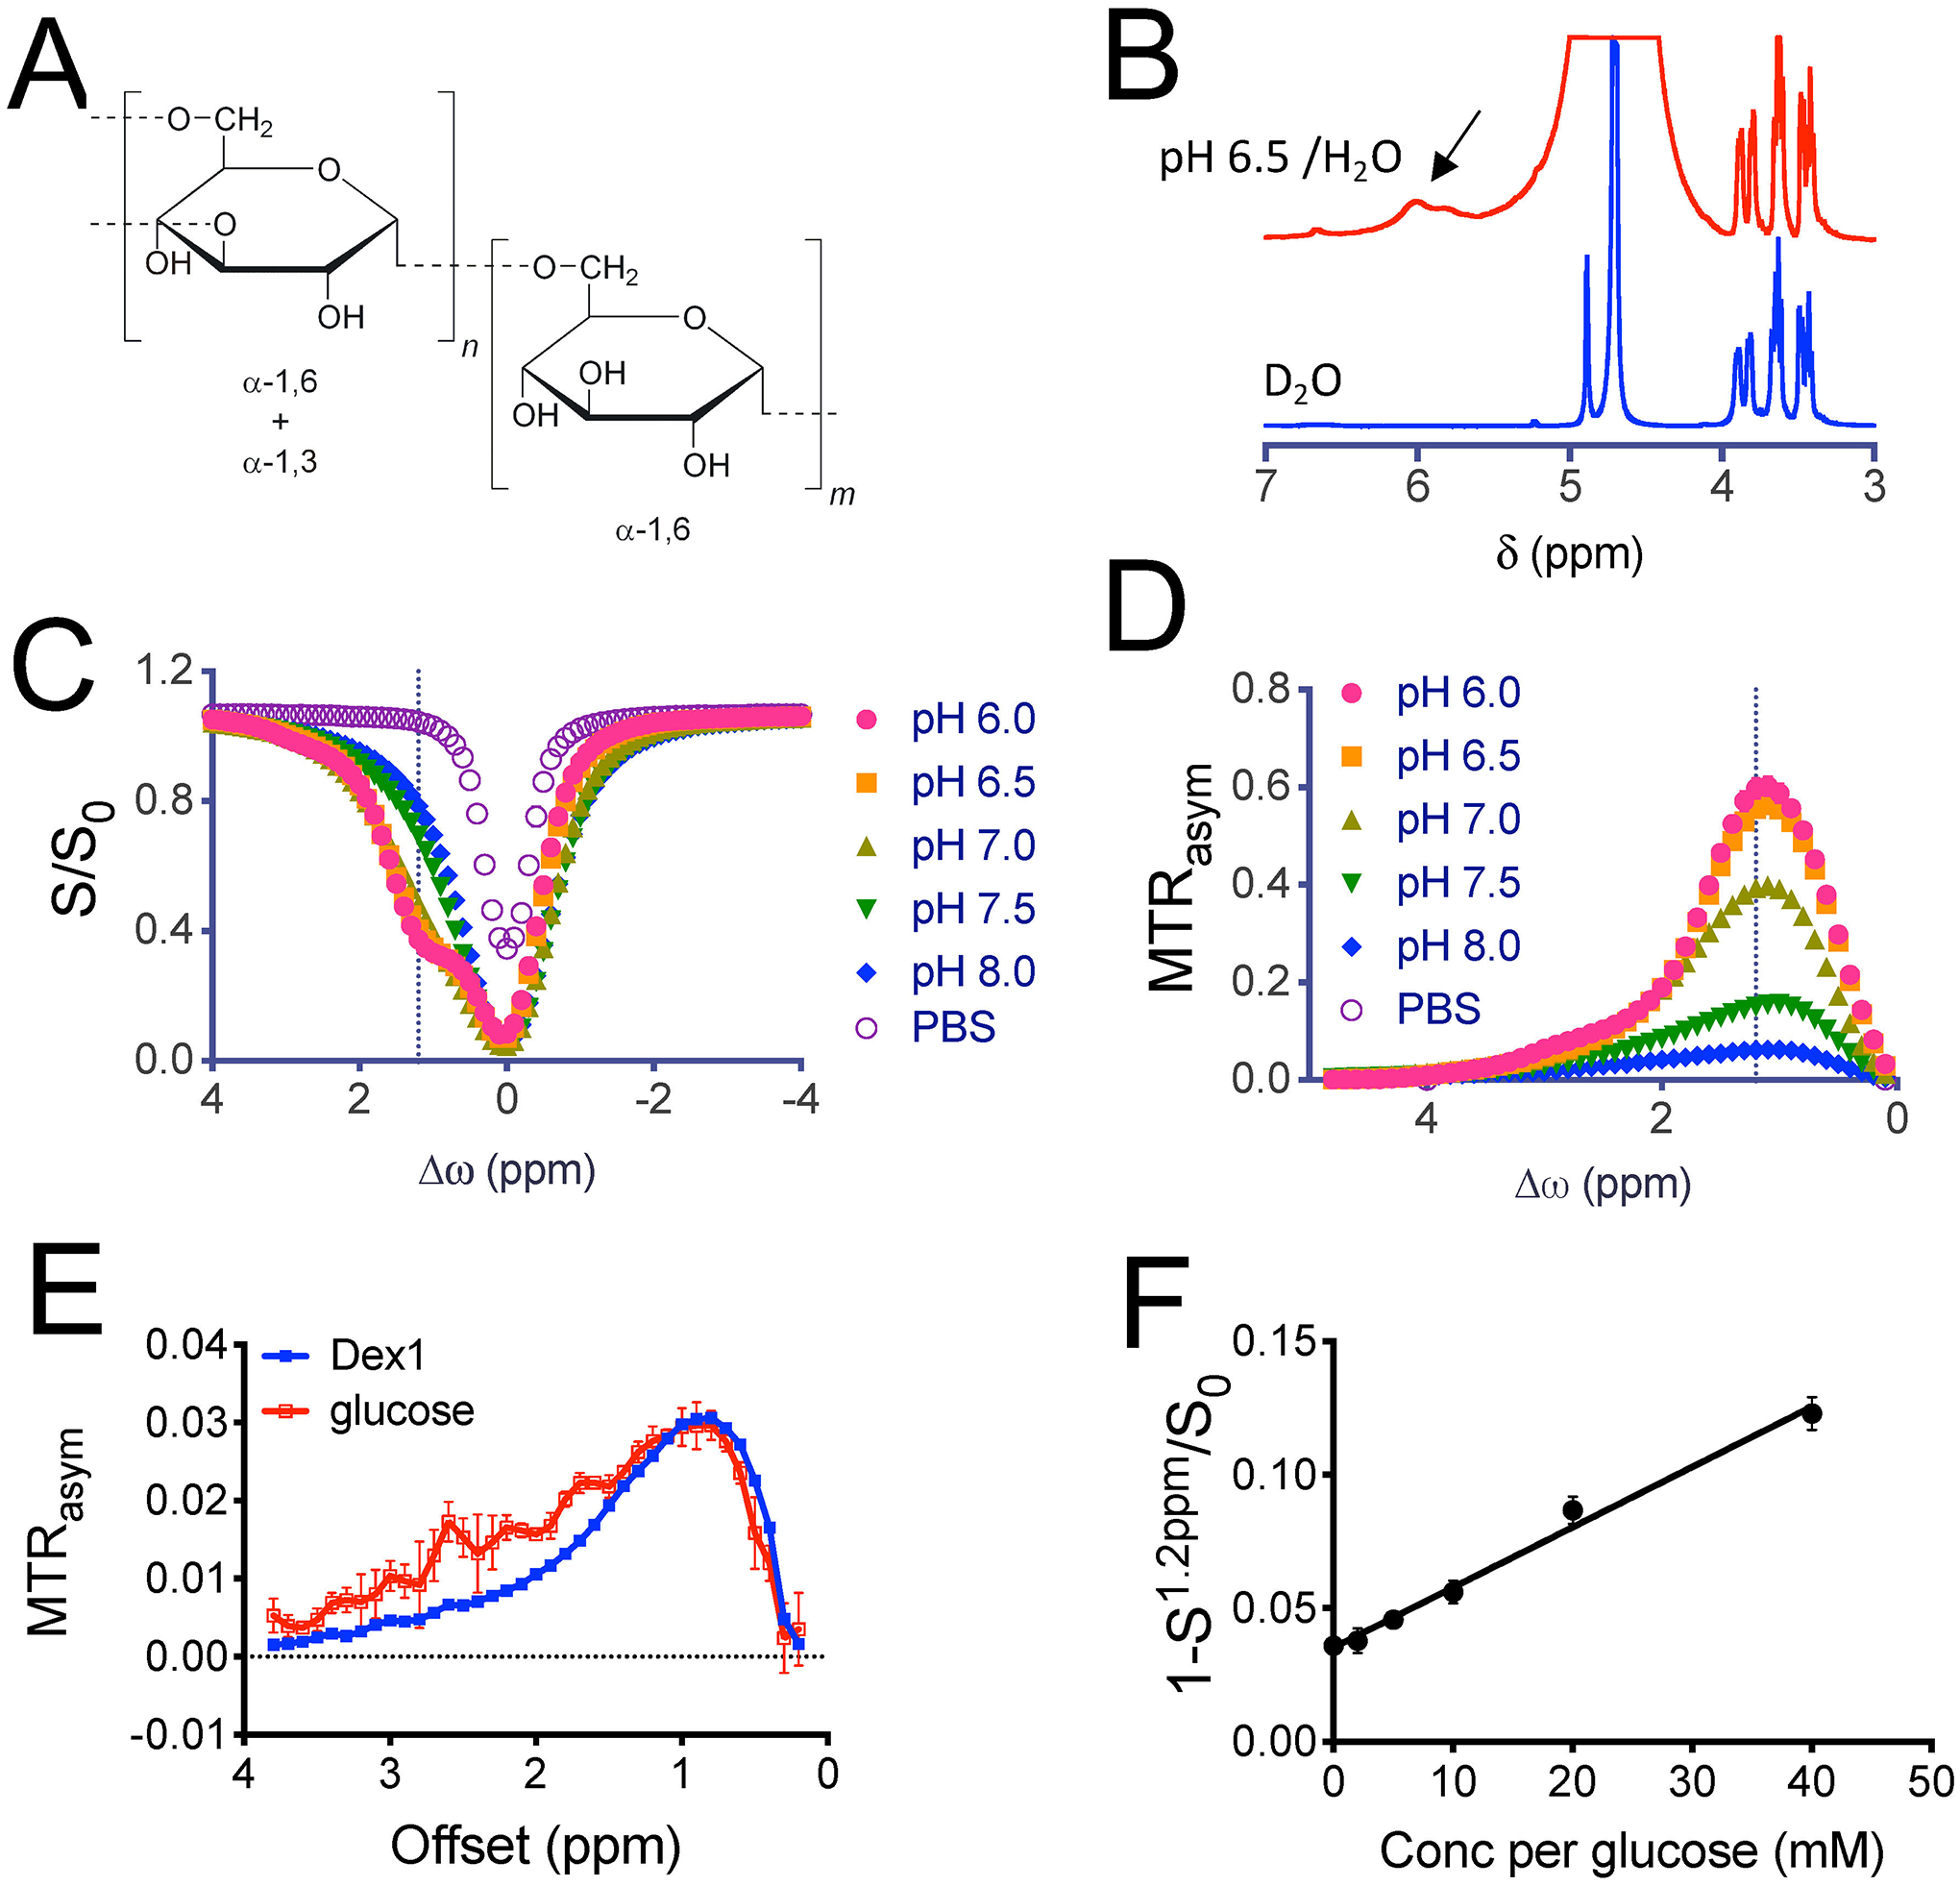
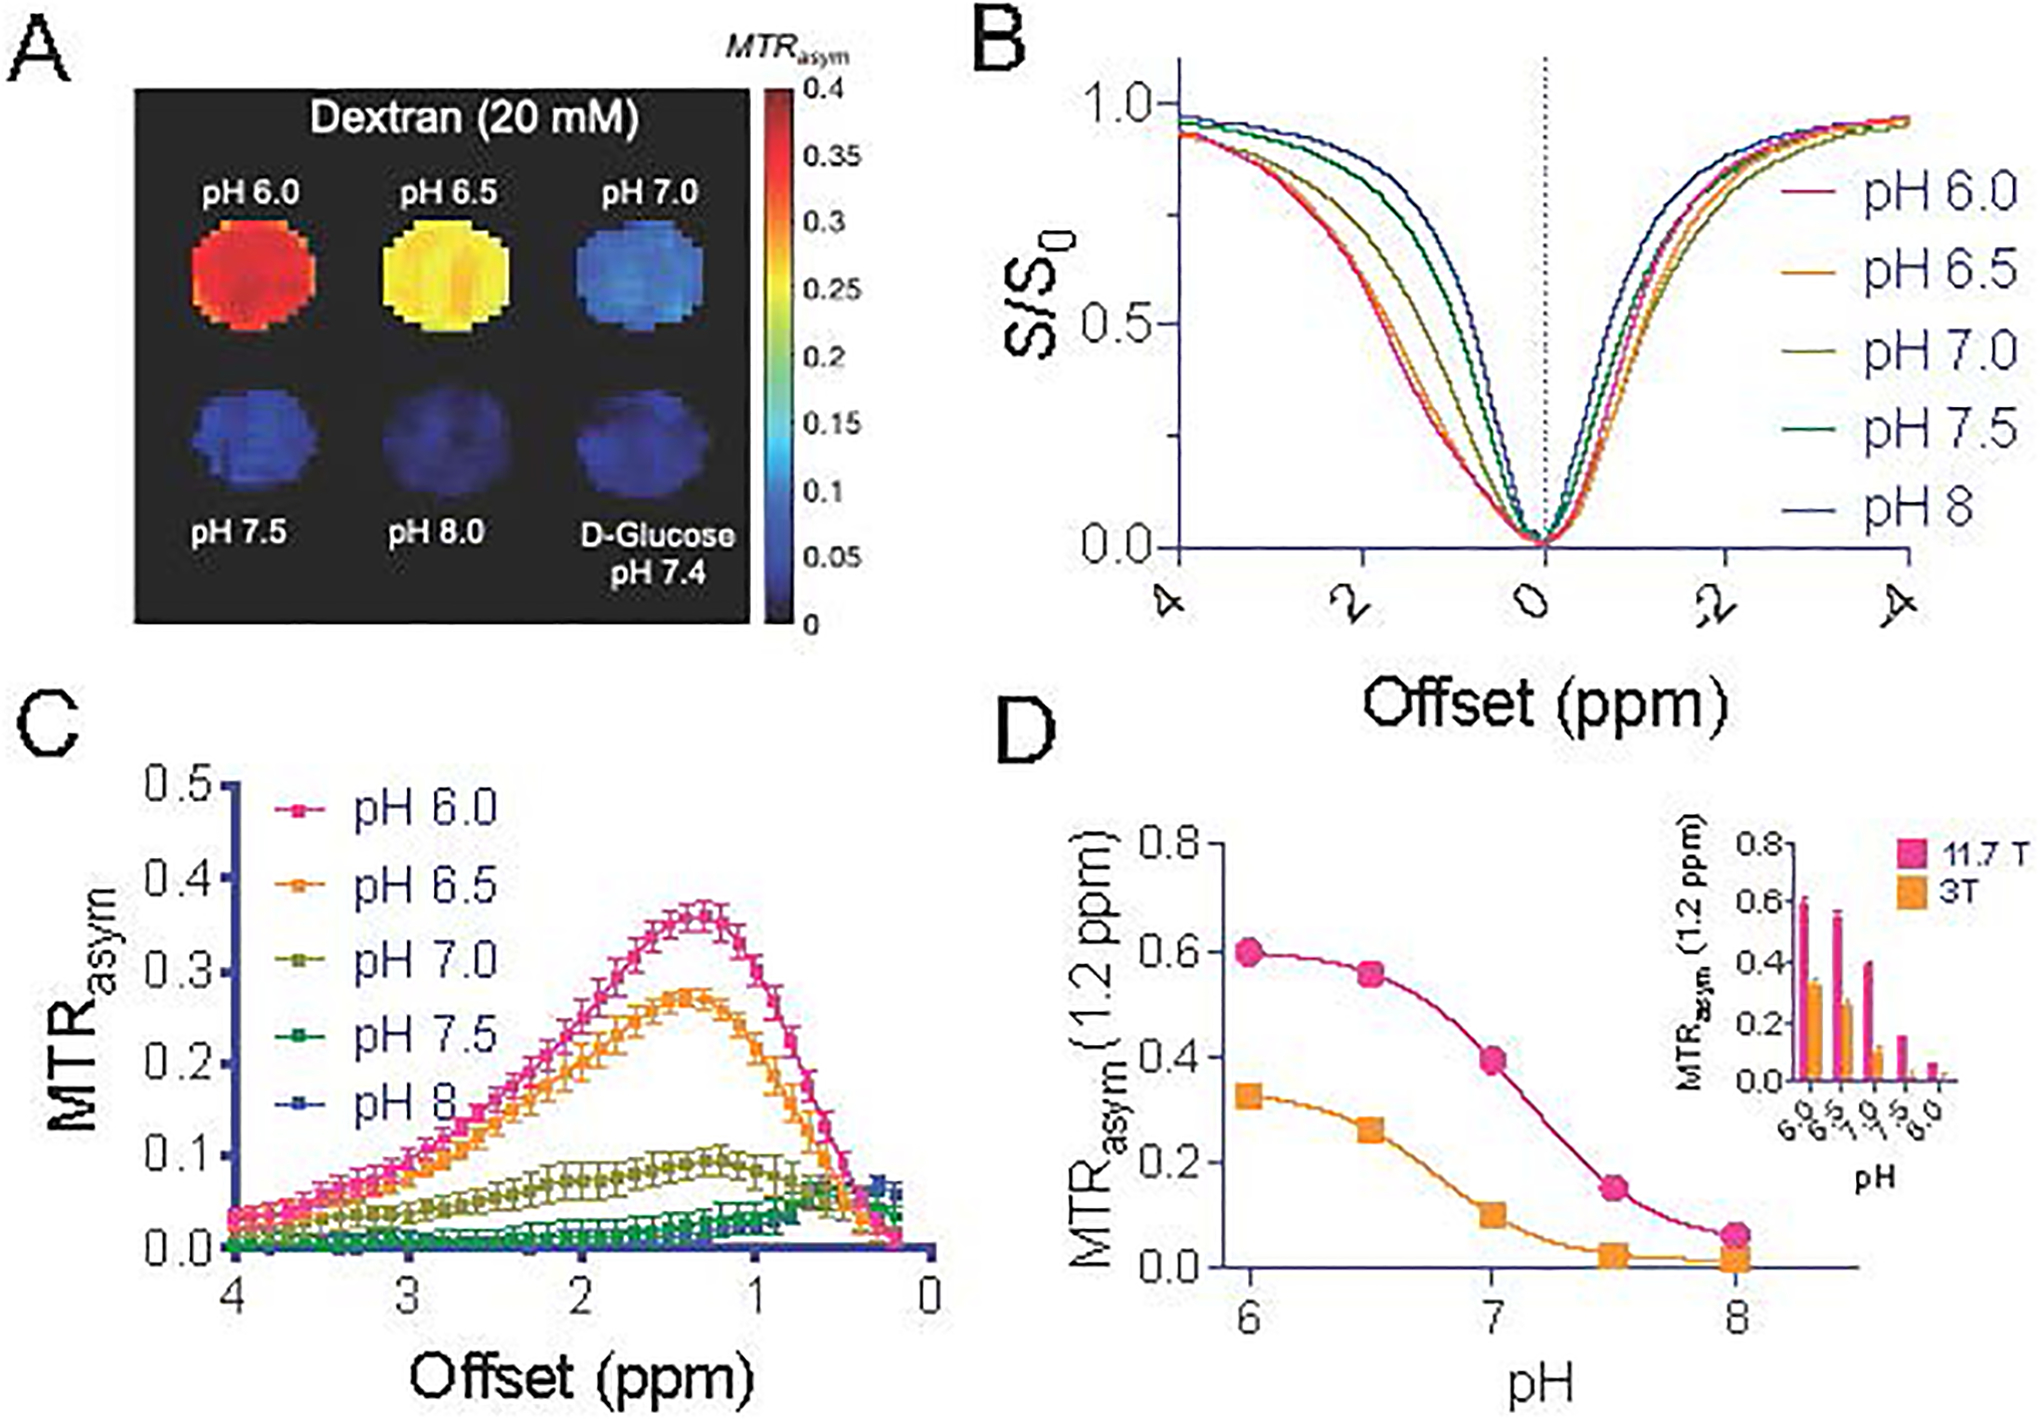
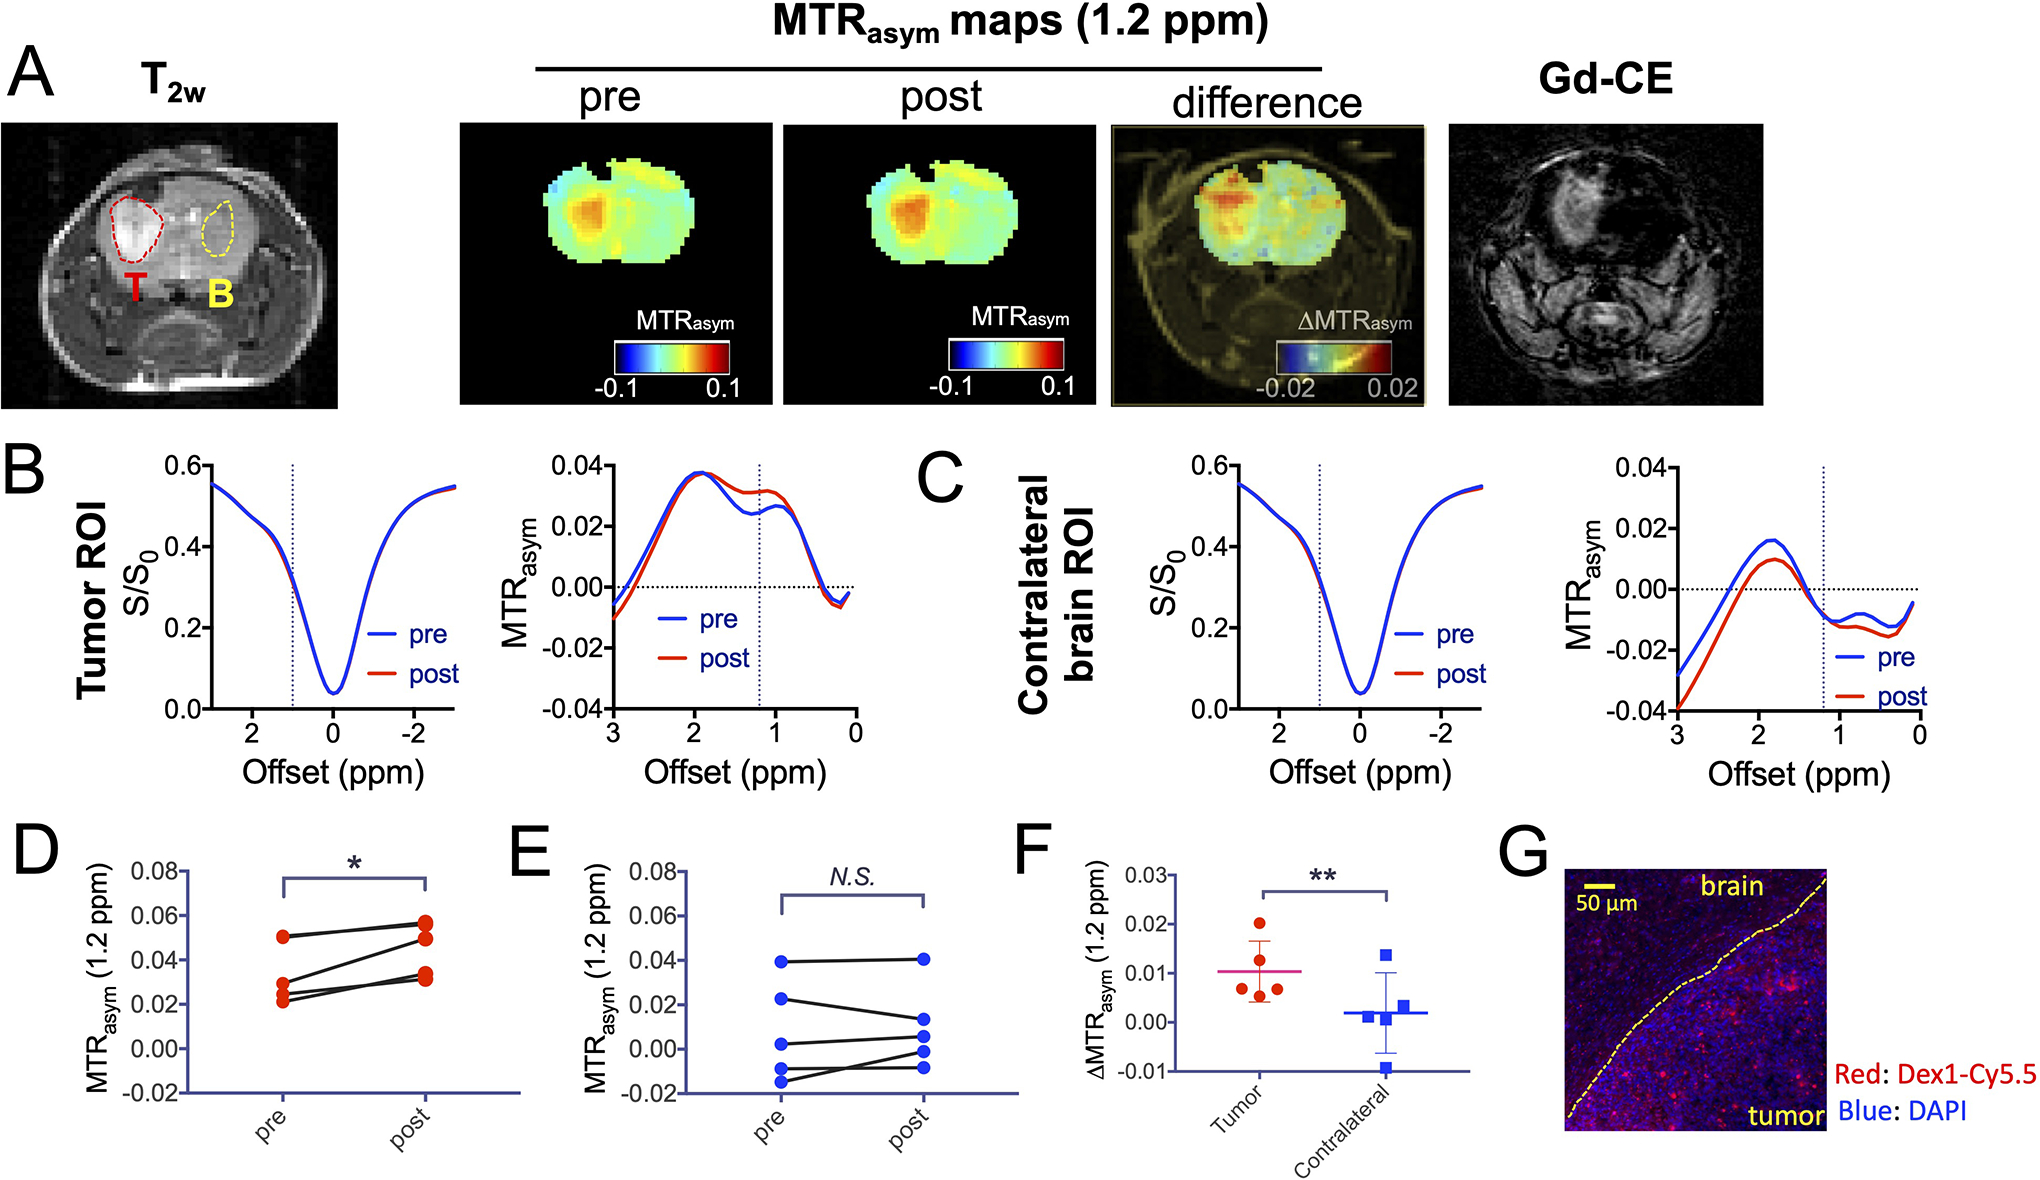
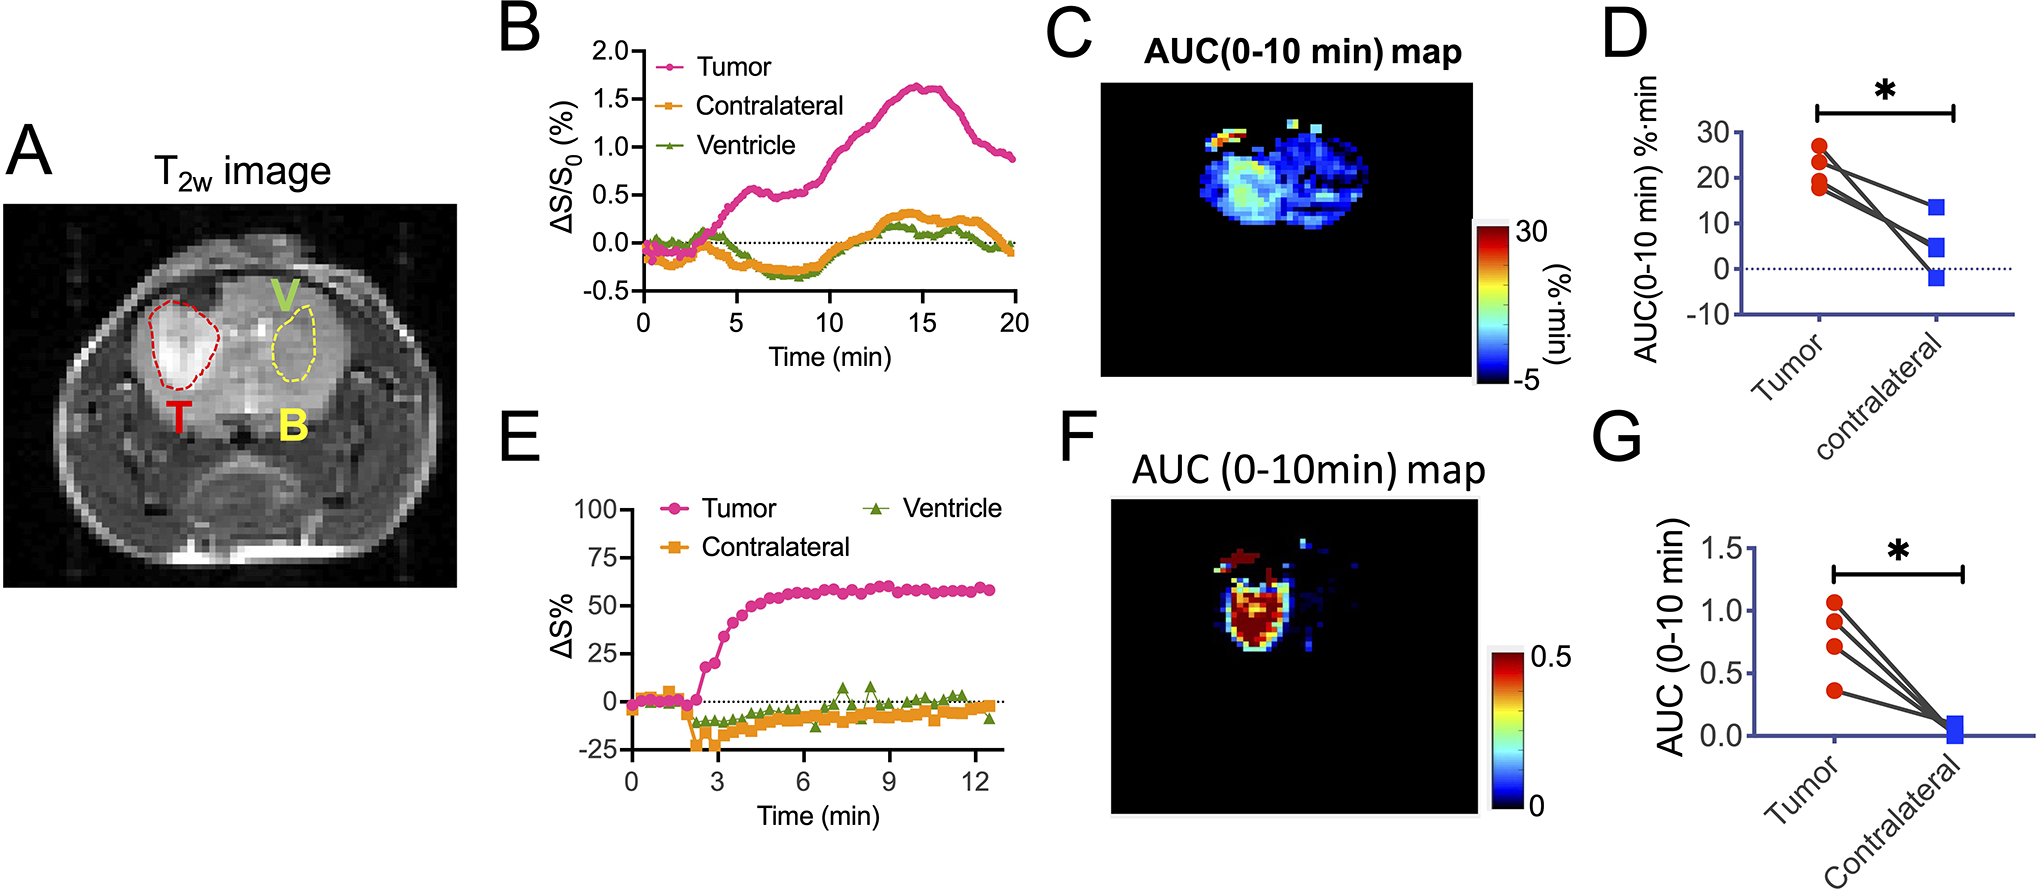
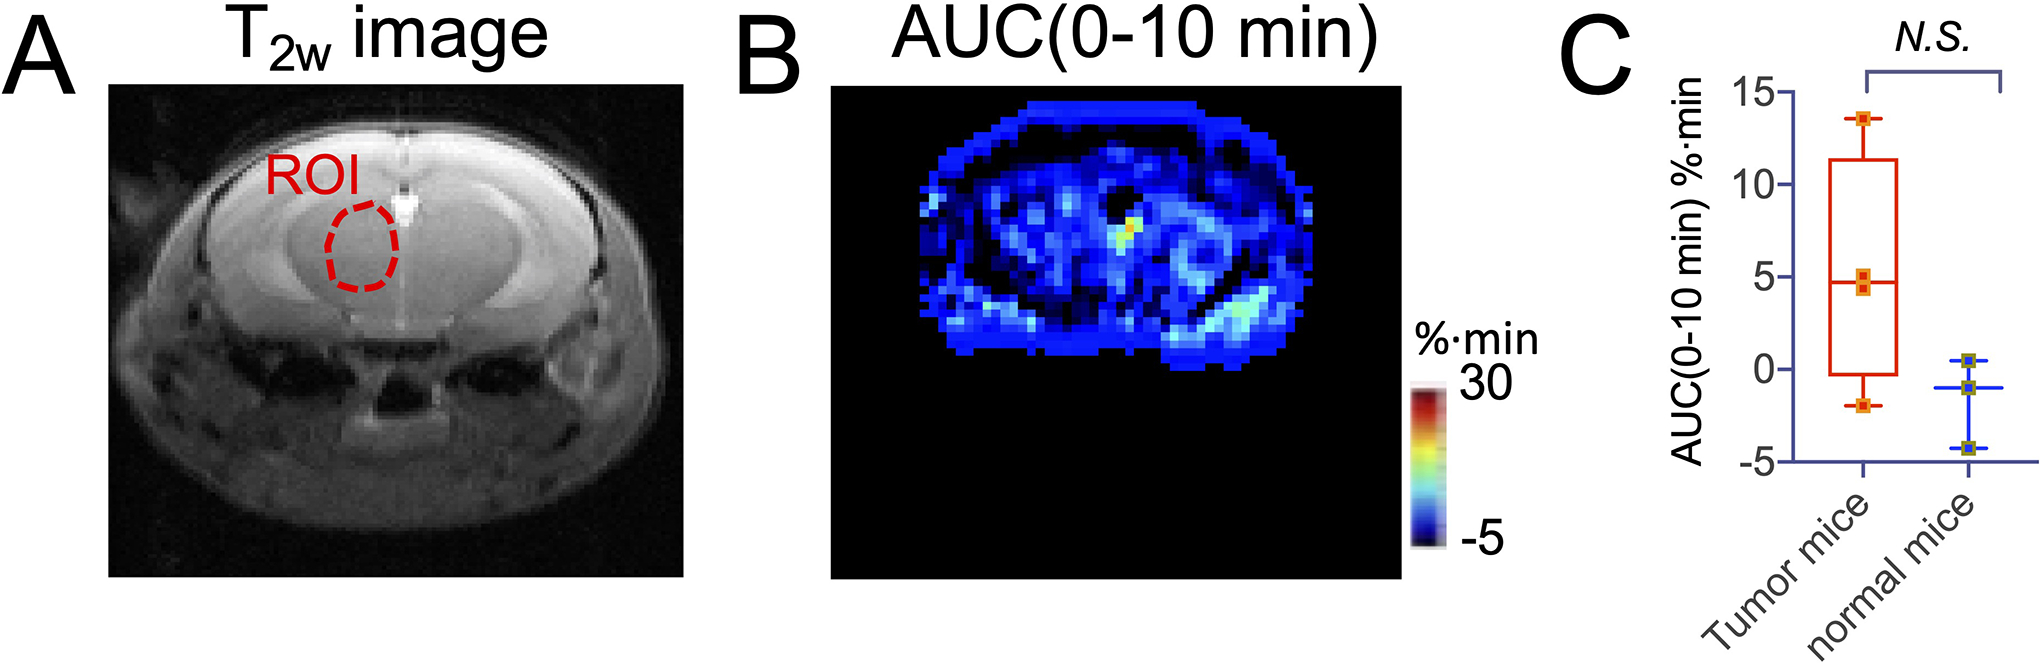
Natural and synthetic sugars have great potential for developing highly biocompatible and translatable chemical exchange saturation transfer (CEST) MRI contrast agents. In this study, we aimed to develop the smallest clinically available form of dextran, Dex1 (molecular weight, MW ~ 1 kDa), as a new CEST agent. We first characterized the CEST properties of Dex1 in vitro at 11.7 T and showed that the Dex1 had a detectable CEST signal at ~1.2 ppm, attributed to hydroxyl protons. In vivo CEST MRI studies were then carried out on C57BL6 mice bearing orthotopic GL261 brain tumors (n = 5) using a Bruker BioSpec 11.7 T MRI scanner. Both steady-state full Z-spectral images and single offset (1.2 ppm) dynamic dextran-enhanced (DDE) images were acquired before and after the intravenous injection of Dex1 (2 g/kg). The steady-state Z-spectral analysis showed a significantly higher CEST contrast enhancement in the tumor than in contralateral brain (∆MTRasym1.2 ppm = 0.010 ± 0.006 versus 0.002 ± 0.008, P = 0.0069) at 20 min after the injection of Dex1. Pharmacokinetic analyses of DDE were performed using the area under the curve (AUC) in the first 10 min after Dex1 injection, revealing a significantly higher uptake of Dex1 in the tumor than in brain tissue for tumor-bearing mice (AUC[0-10 min] = 21.9 ± 4.2 versus 5.3 ± 6.4%·min, P = 0.0294). In contrast, no Dex1 uptake was foundling in the brains of non-tumor-bearing mice (AUC[0-10 min] = -1.59 ± 2.43%·min). Importantly, the CEST MRI findings were consistent with the measurements obtained using DCE MRI and fluorescence microscopy, demonstrating the potential of Dex1 as a highly translatable CEST MRI contrast agent for assessing tumor hemodynamics.
Keywords: CEST; MRI; brain tumor; dextran; permeability.
© 2021 John Wiley & Sons, Ltd.
Figures
Similar articles
-
Characterization of tumor vascular permeability using natural dextrans and CEST MRI.Magn Reson Med. 2018 Feb;79(2):1001-1009. doi: 10.1002/mrm.27014. Epub 2017 Nov 28. Magn Reson Med. 2018. PMID: 29193288 Free PMC article.
-
CEST MRI monitoring of tumor response to vascular disrupting therapy using high molecular weight dextrans.Magn Reson Med. 2019 Oct;82(4):1471-1479. doi: 10.1002/mrm.27818. Epub 2019 May 20. Magn Reson Med. 2019. PMID: 31106918 Free PMC article.
-
Systematic Evaluation of Amide Proton Chemical Exchange Saturation Transfer at 3 T: Effects of Protein Concentration, pH, and Acquisition Parameters.Invest Radiol. 2016 Oct;51(10):635-46. doi: 10.1097/RLI.0000000000000292. Invest Radiol. 2016. PMID: 27272542
-
A review of optimization and quantification techniques for chemical exchange saturation transfer MRI toward sensitive in vivo imaging.Contrast Media Mol Imaging. 2015 May-Jun;10(3):163-178. doi: 10.1002/cmmi.1628. Epub 2015 Jan 12. Contrast Media Mol Imaging. 2015. PMID: 25641791 Free PMC article. Review.
-
Application of chemical exchange saturation transfer (CEST) MRI for endogenous contrast at 7 Tesla.J Neuroimaging. 2013 Oct;23(4):526-32. doi: 10.1111/j.1552-6569.2012.00751.x. Epub 2013 Feb 12. J Neuroimaging. 2013. PMID: 23402307 Free PMC article. Review.
Cited by
-
Metabolic and vascular imaging markers for investigating Alzheimer's disease complicated by sleep fragmentation in mice.Front Physiol. 2024 Sep 20;15:1456690. doi: 10.3389/fphys.2024.1456690. eCollection 2024. Front Physiol. 2024. PMID: 39371598 Free PMC article.
-
Theranostic Cancer Treatment Using Lentinan-Coated Selenium Nanoparticles and Label-Free CEST MRI.Pharmaceutics. 2022 Dec 29;15(1):120. doi: 10.3390/pharmaceutics15010120. Pharmaceutics. 2022. PMID: 36678748 Free PMC article.
-
Motion and magnetic field inhomogeneity correction techniques for chemical exchange saturation transfer (CEST) MRI: A contemporary review.NMR Biomed. 2025 Jan;38(1):e5294. doi: 10.1002/nbm.5294. Epub 2024 Nov 12. NMR Biomed. 2025. PMID: 39532518 Review.
-
Novel non‑metal‑based contrast agents for MR imaging: Emerging approaches and clinical perspectives (Review).Int J Oncol. 2025 Aug;67(2):70. doi: 10.3892/ijo.2025.5776. Epub 2025 Jul 19. Int J Oncol. 2025. PMID: 40682851 Free PMC article. Review.
-
Design Chemical Exchange Saturation Transfer Contrast Agents and Nanocarriers for Imaging Proton Exchange in Vivo.ACS Nano. 2024 Dec 17;18(50):33775-33791. doi: 10.1021/acsnano.4c05923. Epub 2024 Dec 6. ACS Nano. 2024. PMID: 39642940 Free PMC article. Review.
References
-
- Knopp MV, Giesel FL, Marcos H, von Tengg-Kobligk H, Choyke P. Dynamic contrast-enhanced magnetic resonance imaging in oncology. Top Magn Reson Imaging 2001;12(4):301–308. - PubMed
-
- Larsson HB, Stubgaard M, Frederiksen JL, Jensen M, Henriksen O, Paulson OB. Quantitation of blood-brain barrier defect by magnetic resonance imaging and gadolinium-DTPA in patients with multiple sclerosis and brain tumors. Magn Reson Med 1990;16(1):117–131. - PubMed
-
- Marckmann P, Skov L, Rossen K, Dupont A, Damholt MB, Heaf JG, Thomsen HS. Nephrogenic systemic fibrosis: suspected causative role of gadodiamide used for contrast-enhanced magnetic resonance imaging. J Am Soc Nephrol 2006;17(9):2359–2362. - PubMed
Publication types
MeSH terms
Substances
Grants and funding
LinkOut - more resources
Full Text Sources
Medical
