

Volatile Chemical Product Enhancements to Criteria Pollutants in the United States
- PMID: 34779612
- PMCID: PMC9247718
- DOI: 10.1021/acs.est.1c04298
Volatile Chemical Product Enhancements to Criteria Pollutants in the United States
Abstract
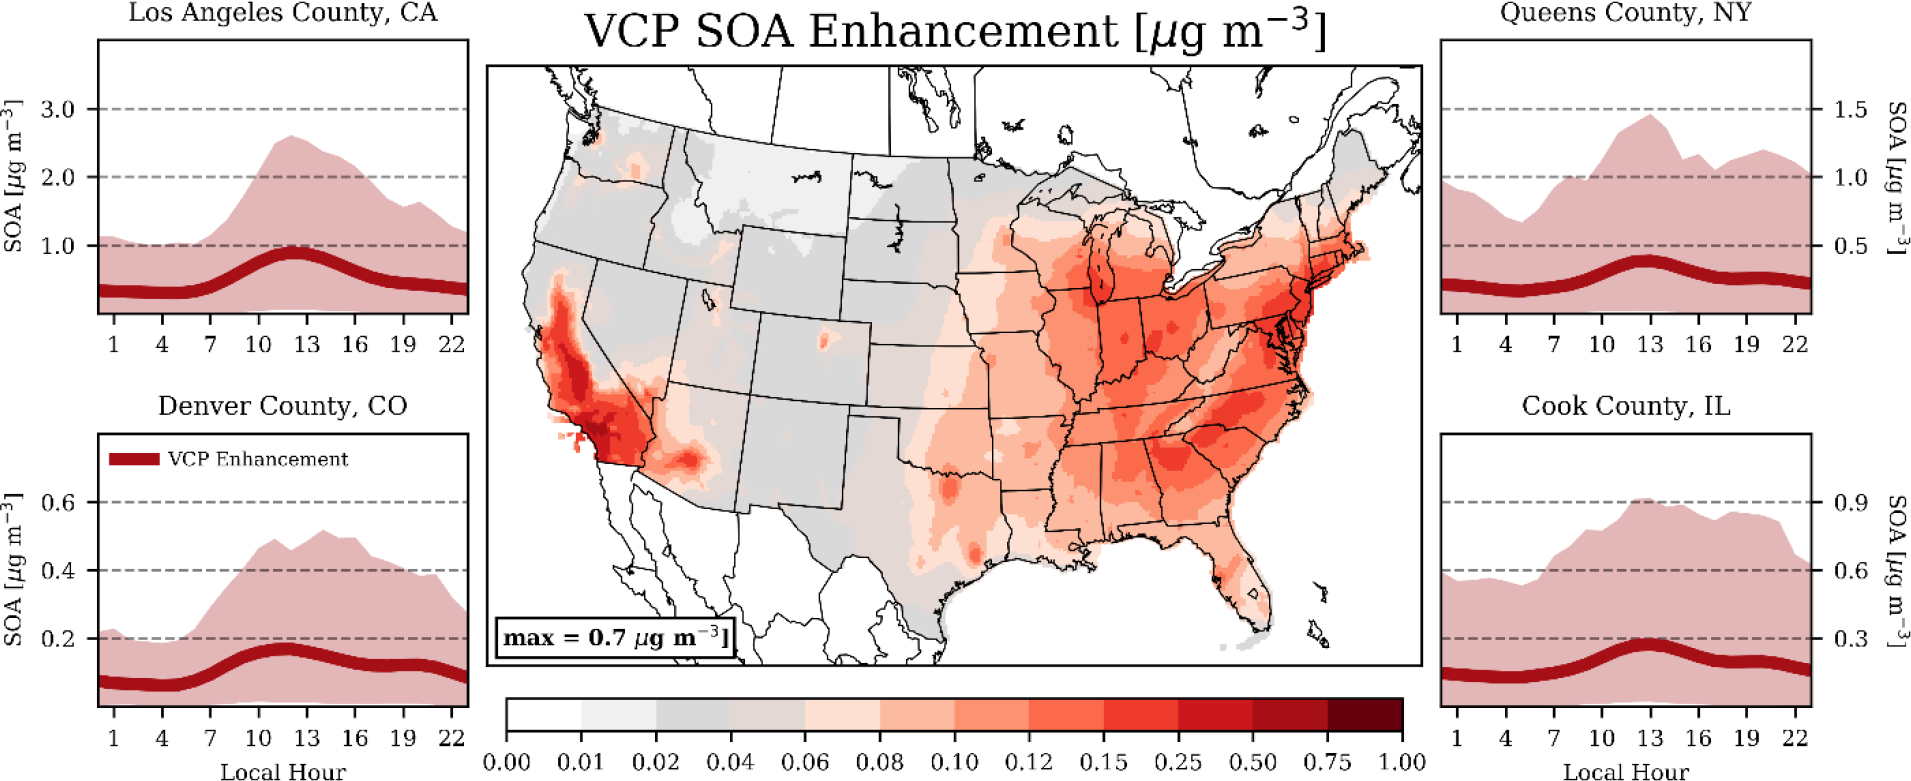
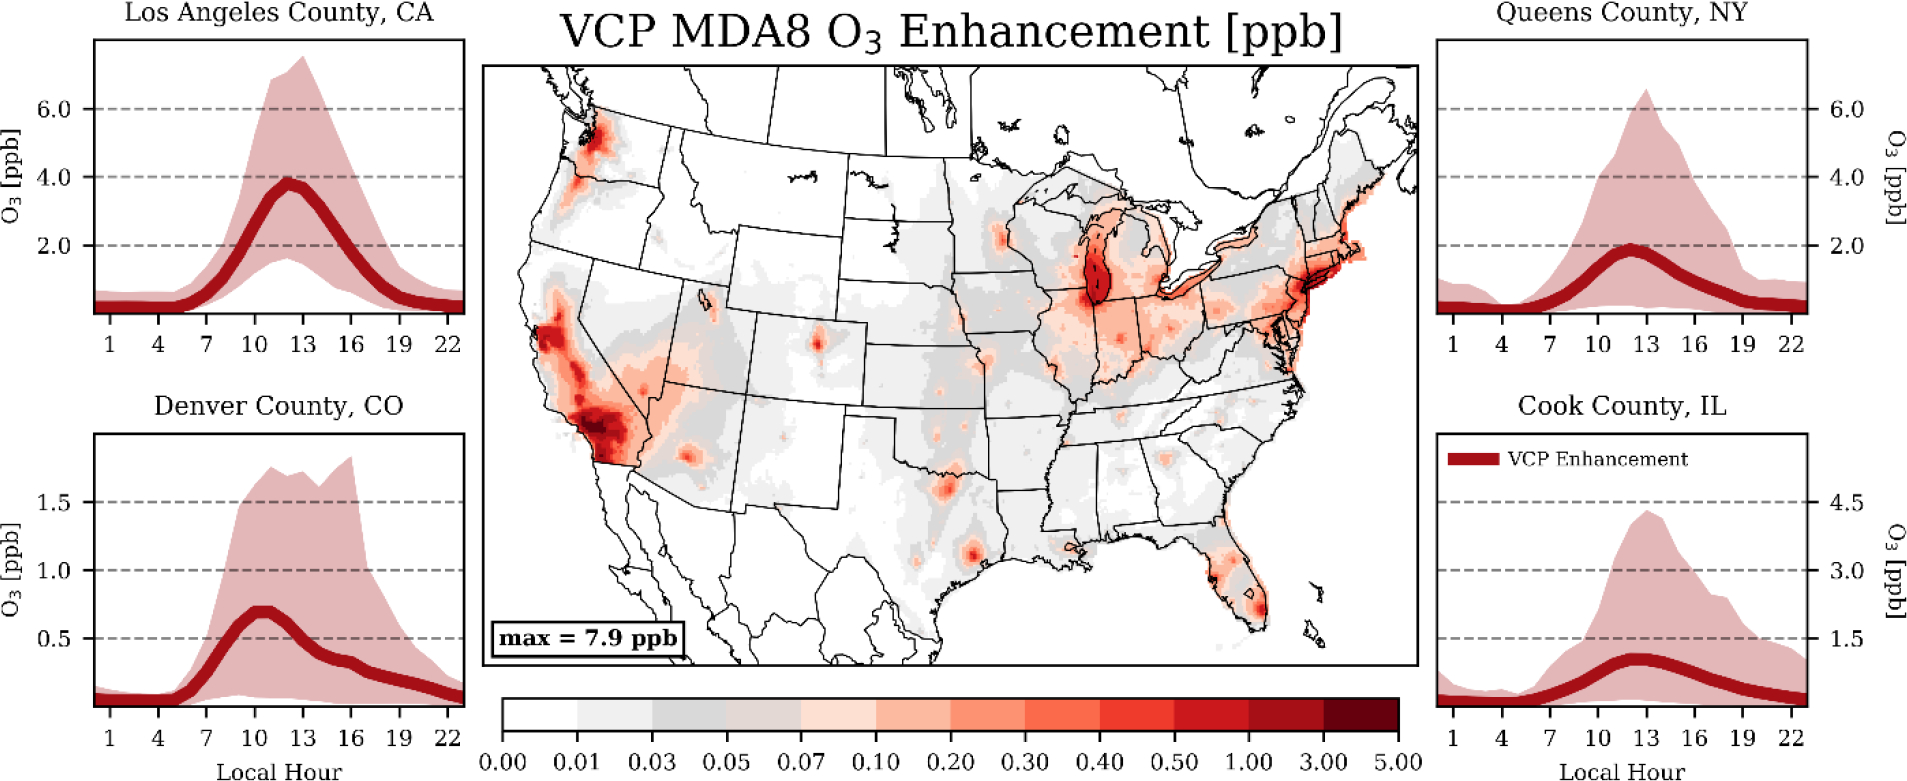
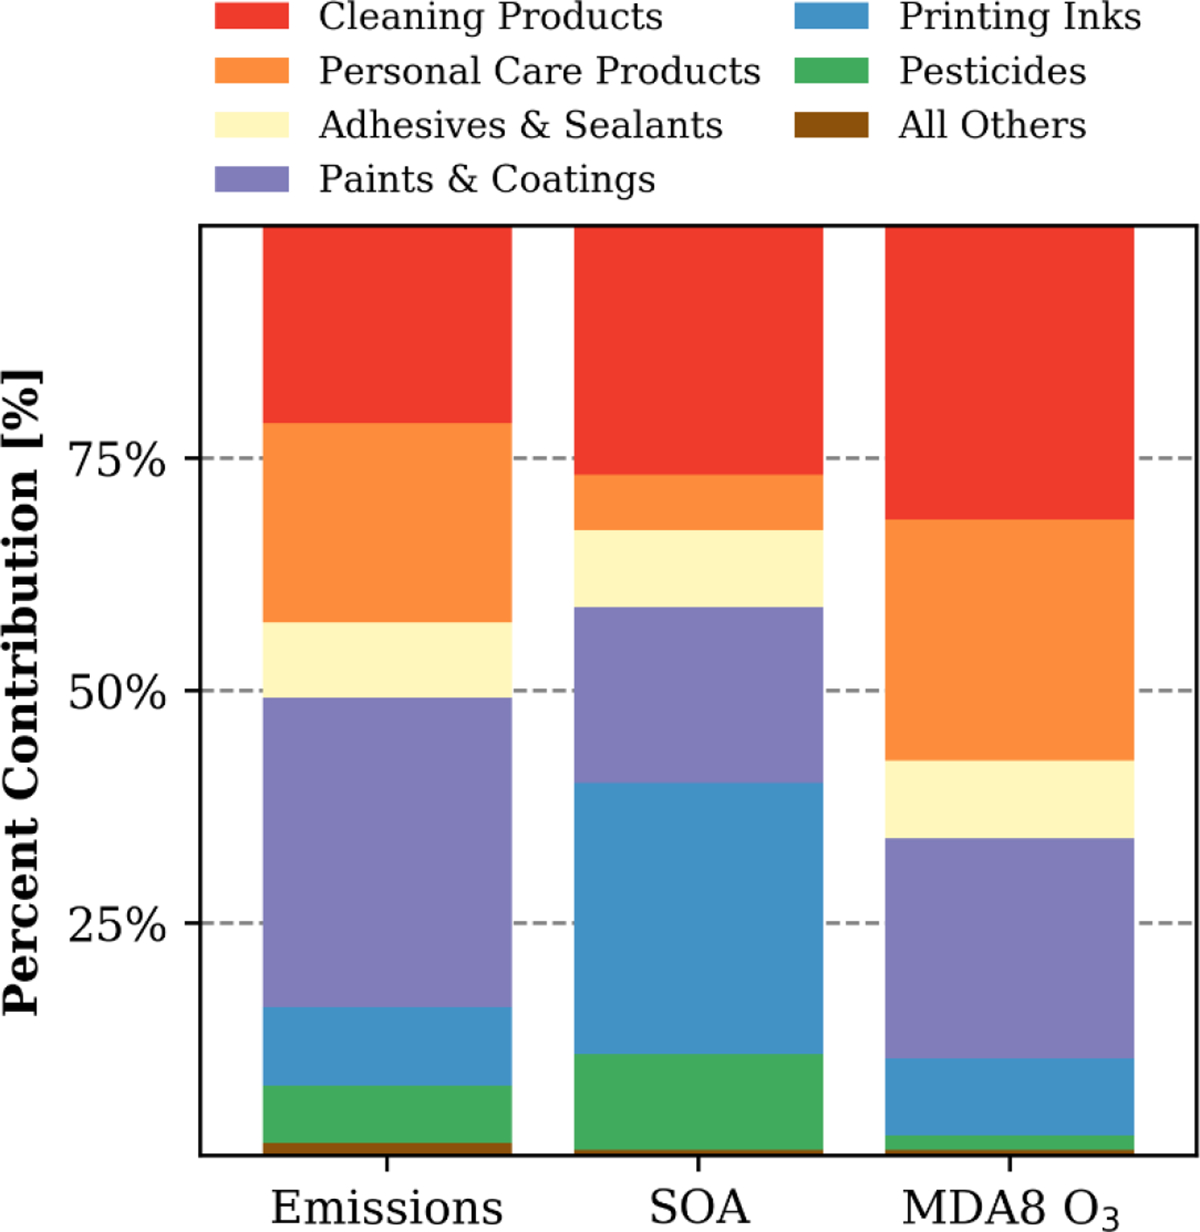
Volatile chemical products (VCPs) are a significant source of reactive organic carbon emissions in the United States with a substantial fraction (>20% by mass) serving as secondary organic aerosol (SOA) precursors. Here, we incorporate a new nationwide VCP inventory into the Community Multiscale Air Quality (CMAQ) model with VCP-specific updates to better model air quality impacts. Model results indicate that VCPs mostly enhance anthropogenic SOA in densely populated areas with population-weighted annual average SOA increasing 15-30% in Southern California and New York City due to VCP emissions (contribution of 0.2-0.5 μg m-3). Annually, VCP emissions enhance total population-weighted PM2.5 by ∼5% in California, ∼3% in New York, New Jersey, and Connecticut, and 1-2% in most other states. While the maximum daily 8 h ozone enhancements from VCP emissions are more modest, their influence can cause a several ppb increase on select days in major cities. Printing Inks, Cleaning Products, and Paints and Coatings product use categories contribute ∼75% to the modeled VCP-derived SOA and Cleaning Products, Paints and Coatings, and Personal Care Products contribute ∼81% to the modeled VCP-derived ozone. Overall, VCPs enhance multiple criteria pollutants throughout the United States with the largest impacts in urban cores.
Keywords: PM2.5; air quality impacts; ozone; reactive organic carbon; secondary organic aerosol; volatile chemical products.
Conflict of interest statement
The authors declare no competing financial interest.
Figures
Similar articles
-
Volatile chemical product emissions enhance ozone and modulate urban chemistry.Proc Natl Acad Sci U S A. 2021 Aug 10;118(32):e2026653118. doi: 10.1073/pnas.2026653118. Proc Natl Acad Sci U S A. 2021. PMID: 34341119 Free PMC article.
-
Observations Confirm that Volatile Chemical Products Are a Major Source of Petrochemical Emissions in U.S. Cities.Environ Sci Technol. 2021 Apr 20;55(8):4332-4343. doi: 10.1021/acs.est.0c05471. Epub 2021 Mar 15. Environ Sci Technol. 2021. PMID: 33720711
-
Volatile chemical products emerging as largest petrochemical source of urban organic emissions.Science. 2018 Feb 16;359(6377):760-764. doi: 10.1126/science.aaq0524. Science. 2018. PMID: 29449485
-
Watching Paint Dry: Organic Vapor Emissions from Architectural Coatings and their Impact on Secondary Organic Aerosol Formation.Environ Sci Technol. 2022 Aug 16;56(16):11236-11245. doi: 10.1021/acs.est.2c02478. Epub 2022 Aug 5. Environ Sci Technol. 2022. PMID: 35929857
-
Modeling an air pollution episode in northwestern United States: identifying the effect of nitrogen oxide and volatile organic compound emission changes on air pollutants formation using direct sensitivity analysis.J Air Waste Manag Assoc. 2012 Oct;62(10):1150-65. doi: 10.1080/10962247.2012.697093. J Air Waste Manag Assoc. 2012. PMID: 23155861
Cited by
-
Policy-Related Gains in Urban Air Quality May Be Offset by Increased Emissions in a Warming Climate.Environ Sci Technol. 2023 Jul 4;57(26):9683-9692. doi: 10.1021/acs.est.2c05904. Epub 2023 Jun 16. Environ Sci Technol. 2023. PMID: 37327457 Free PMC article.
-
Indoor Air Sources of Outdoor Air Pollution: Health Consequences, Policy, and Recommendations: An Official American Thoracic Society Workshop Report.Ann Am Thorac Soc. 2024 Mar;21(3):365-376. doi: 10.1513/AnnalsATS.202312-1067ST. Ann Am Thorac Soc. 2024. PMID: 38426826 Free PMC article.
-
Anthropogenic Secondary Organic Aerosol and Ozone Production from Asphalt-Related Emissions.Environ Sci Atmos. 2023 Jul 9;3:1221-1230. doi: 10.1039/d3ea00066d. Environ Sci Atmos. 2023. PMID: 39206140 Free PMC article.
-
Emissions of Condensable Organic Aerosols from Stationary Combustion Sources over Japan.Atmos Environ (1994). 2022 Nov 15;289:119319. doi: 10.1016/j.atmosenv.2022.119319. Atmos Environ (1994). 2022. PMID: 40012955 Free PMC article.
-
Evaporation-Induced Transformations in Volatile Chemical Product-Derived Secondary Organic Aerosols: Browning Effects and Alterations in Oxidative Reactivity.Environ Sci Technol. 2024 Jun 25;58(25):11105-11117. doi: 10.1021/acs.est.4c02316. Epub 2024 Jun 12. Environ Sci Technol. 2024. PMID: 38866390 Free PMC article.
References
-
- Safieddine SA; Heald CL; Henderson BH, The global nonmethane reactive organic carbon budget: A modeling perspective. Geophys Res Lett 2017, 44 (8), 3897–3906.
Publication types
MeSH terms
Substances
Grants and funding
LinkOut - more resources
Full Text Sources
Medical
Miscellaneous
