

Development of Reaching, Grasping & Manipulation indicators to advance the quality of spinal cord injury rehabilitation: SCI-High Project
- PMID: 34779738
- PMCID: PMC8604521
- DOI: 10.1080/10790268.2021.1961052
Development of Reaching, Grasping & Manipulation indicators to advance the quality of spinal cord injury rehabilitation: SCI-High Project
Abstract
Objective: To describe the development of structure, process, and outcome indicators aimed to advance the quality of Reaching, Grasping & Manipulation (RG&M) rehabilitation for Canadians living with spinal cord injury or disease (SCI/D).
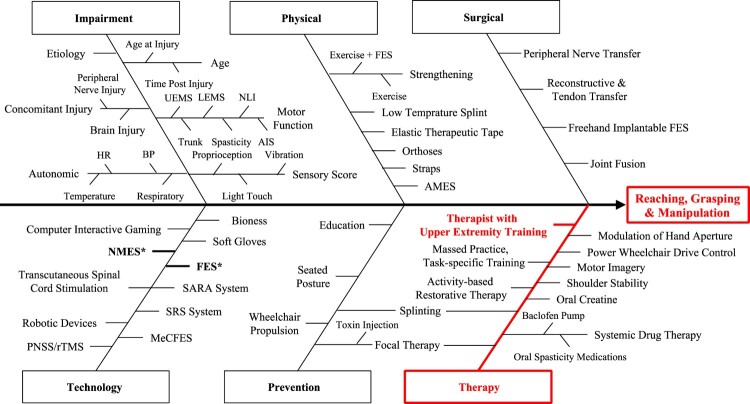
Method: Upper extremity rehabilitation experts developed a framework of indicators for evaluation of RG&M rehabilitation quality. A systematic search of the literature identified potential upper extremity indicators that influence RG&M outcomes. A Driver diagram summarized factors influencing upper extremity outcomes to inform the selection of structure and process indicators. Psychometric properties, clinical utility, and feasibility of potential upper extremity measures were considered when selecting outcome indicators.
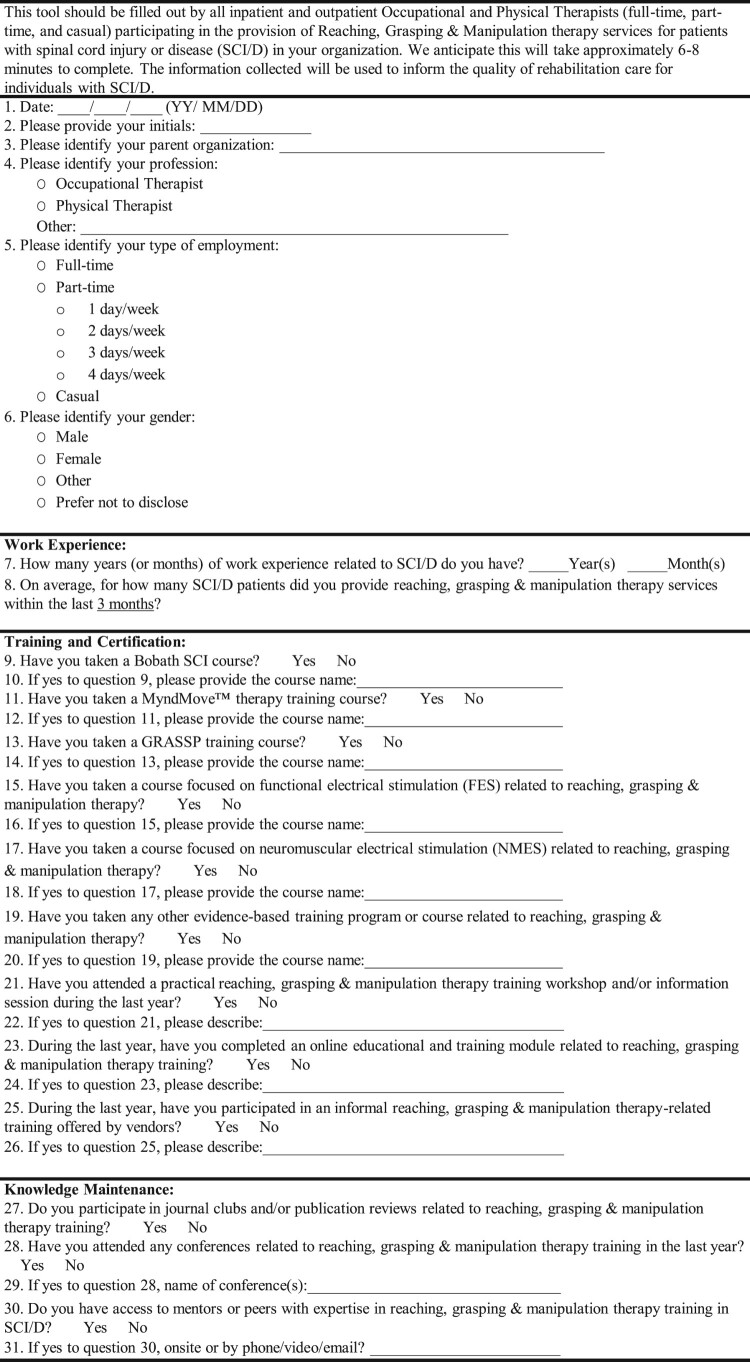
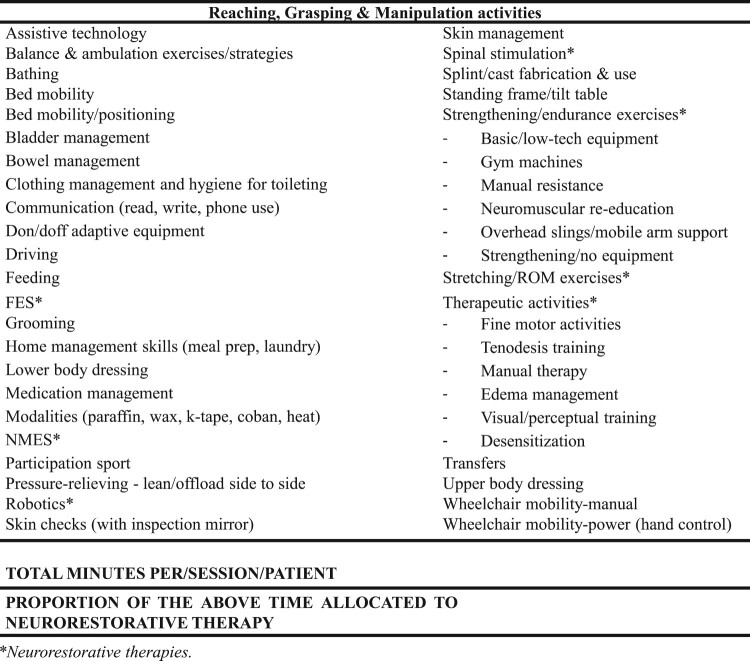
Results: The selected structure indicator is the number of occupational and physical therapists with specialized certification, education, training and/or work experience in upper extremity therapy related to RG&M at a given SCI/D rehabilitation center. The process indicator is the total hours of upper extremity therapies related to RG&M and the proportion of this time allocated to neurorestorative therapy for each individual with tetraplegia receiving therapy. The outcome indicators are the Graded Redefined Assessment of Strength, Sensation and Prehension (GRASSP) strength and Spinal Cord Independence Measure III (SCIM III) Self-Care subscores implemented at rehabilitation admission and discharge, and SCIM III Self-Care subscore only at 18 months post-admission.
Conclusion: The selected indicators align with current practice, will direct the timing of routine assessments, and enhance the volume and quality of RG&M therapy delivered, with the aim to ultimately increase the proportion of individuals with tetraplegia achieving improved upper extremity function by 18 months post-rehabilitation.
Keywords: Health care; Outcome assessment; Physical functional performance; Quality indicators; Rehabilitation; Tetraplegia; Upper extremity.
Figures
Similar articles
-
Development of community participation indicators to advance the quality of spinal cord injury rehabilitation: SCI-High Project.J Spinal Cord Med. 2021;44(sup1):S79-S93. doi: 10.1080/10790268.2021.1955204. J Spinal Cord Med. 2021. PMID: 34779731 Free PMC article.
-
Development of Walking indicators to advance the quality of spinal cord injury rehabilitation: SCI-High Project.J Spinal Cord Med. 2019 Oct;42(sup1):119-129. doi: 10.1080/10790268.2019.1647385. J Spinal Cord Med. 2019. PMID: 31573443 Free PMC article.
-
Development of the Graded Redefined Assessment of Strength, Sensibility and Prehension (GRASSP): reviewing measurement specific to the upper limb in tetraplegia.J Neurosurg Spine. 2012 Sep;17(1 Suppl):65-76. doi: 10.3171/2012.6.AOSPINE1258. J Neurosurg Spine. 2012. PMID: 22985372
-
Safety and efficacy of transcranial direct current stimulation in upper extremity rehabilitation after tetraplegia: protocol of a multicenter randomized, clinical trial.Spinal Cord. 2022 Sep;60(9):774-778. doi: 10.1038/s41393-022-00768-z. Epub 2022 Mar 5. Spinal Cord. 2022. PMID: 35246620 Free PMC article.
-
Robot-assisted upper extremity rehabilitation for cervical spinal cord injuries: a systematic scoping review.Disabil Rehabil Assist Technol. 2018 Oct;13(7):704-715. doi: 10.1080/17483107.2018.1425747. Epub 2018 Jan 15. Disabil Rehabil Assist Technol. 2018. PMID: 29334467
Cited by
-
Development of community participation indicators to advance the quality of spinal cord injury rehabilitation: SCI-High Project.J Spinal Cord Med. 2021;44(sup1):S79-S93. doi: 10.1080/10790268.2021.1955204. J Spinal Cord Med. 2021. PMID: 34779731 Free PMC article.
-
Reframing the Science and Practice of Spinal Cord Injury Rehabilitation: Two Decades of Reflection.Top Spinal Cord Inj Rehabil. 2023 Fall;29(Suppl):iv-xi. doi: 10.46292/1945-5763-29.suppl.iv. Epub 2023 Nov 17. Top Spinal Cord Inj Rehabil. 2023. PMID: 38174127 Free PMC article. No abstract available.
References
-
- Anderson KD. Targeting recovery: priorities of the spinal cord-injured population. J Neurotrauma 2004;21(10):1371–83. - PubMed
-
- New PW, Cripps RA, Bonne Lee B.. Global maps of non-traumatic spinal cord injury epidemiology: towards a living data repository. Spinal Cord 2014;52(2):97–109. - PubMed
-
- Kalsi-Ryan S, Riehm LE, Tetreault L, Martin AR, Teoderascu F, Massicotte E, et al. Characteristics of upper limb impairment related to degenerative cervical myelopathy: development of a sensitive hand assessment (Graded redefined assessment of strength, sensibility, and prehension version myelopathy). Neurosurgery 2020;86(3):E292–E9. - PMC - PubMed
-
- Tetreault L, Kopjar B, Nouri A, Arnold P, Barbagallo G, Bartels R, et al. The modified Japanese Orthopaedic Association scale: establishing criteria for mild, moderate and severe impairment in patients with degenerative cervical myelopathy. Eur Spine J 2017;26(1):78–84. - PubMed
Publication types
MeSH terms
LinkOut - more resources
Full Text Sources
Medical